HAL Id: hal-00301016
https://hal.archives-ouvertes.fr/hal-00301016
Submitted on 16 Dec 2002HAL is a multi-disciplinary open access
archive for the deposit and dissemination of sci-entific research documents, whether they are pub-lished or not. The documents may come from teaching and research institutions in France or abroad, or from public or private research centers.
L’archive ouverte pluridisciplinaire HAL, est destinée au dépôt et à la diffusion de documents scientifiques de niveau recherche, publiés ou non, émanant des établissements d’enseignement et de recherche français ou étrangers, des laboratoires publics ou privés.
Interhemispheric differences in the chemical
characteristics of the Indian Ocean aerosol during
INDOEX
M. Norman, C. Leck, H. Rodhe
To cite this version:
M. Norman, C. Leck, H. Rodhe. Interhemispheric differences in the chemical characteristics of the Indian Ocean aerosol during INDOEX. Atmospheric Chemistry and Physics Discussions, European Geosciences Union, 2002, 2 (6), pp.2373-2411. �hal-00301016�
ACPD
2, 2373–2411, 2002 Interhemispheric differences during INDOEX M. Norman et al. Title Page Abstract Introduction Conclusions References Tables Figures J I J I Back Close Full Screen / EscPrint Version Interactive Discussion
© EGU 2002
Atmos. Chem. Phys. Discuss., 2, 2373–2411, 2002 www.atmos-chem-phys.org/acpd/2/2373/
© European Geosciences Union 2002
Atmospheric Chemistry and Physics Discussions
Interhemispheric di
fferences in the
chemical characteristics of the Indian
Ocean aerosol during INDOEX
M. Norman1, C. Leck1, and H. Rodhe1
1
Department of Meteorology, Stockholm University, S-106 91 Stockholm, Sweden
Received: 5 October 2002 – Accepted: 29 November 2002 – Published: 16 December 2002 Correspondence to: M. Norman ([email protected])
ACPD
2, 2373–2411, 2002 Interhemispheric differences during INDOEX M. Norman et al. Title Page Abstract Introduction Conclusions References Tables Figures J I J I Back Close Full Screen / EscPrint Version Interactive Discussion
© EGU 2002
Abstract
The water soluble inorganic part of the sub-micrometer aerosol was measured from two research vessels over the Indian Ocean during the winter monsoon season (February and March) as part of the INDOEX project in 1998 and 1999. Additional measurements were made of gas phase SO2 from one of the vessels in 1999. All samples collected
5
north of the ITCZ were clearly affected by continental, anthropogenic sources. A sharp transition occurred across the ITCZ with concentrations of nss-SO2−4 , NH+4 and nss-K+ being lower by a factor of 7–15, > 20 and > 40, respectively, on the southern side of the ITCZ. The contribution from DMS to the sub-micrometer nss-SO2−4 was estimated to be up to 40% in clean air north of the ITCZ but less than 10% in polluted air originating
10
from India. South of the ITCZ virtually all nss-SO2−4 was likely to be derived from oxida-tion of DMS. The concentraoxida-tion of SO2decreased rapidly with distance from the Indian coast, the ratio SO2/nss-SO2−4 reaching values below 5% after 35 h travel time over the ocean. Surprisingly, MSA, which is derived from DMS, also showed higher concen-trations in the sub-micrometer aerosol north of the ITCZ than south of it. This could
15
be explained by the larger sub-micrometer surface area available north of the ITCZ for the condensation of MSA. South of the ITCZ a major part of the MSA was found on the super-micrometer particles. The total amount of MSA, on both sub-micrometer and super-micrometer particles, varied little across the ITCZ. An analysis based on the air trajectories showed that systematic variation in the observed concentrations was
asso-20
ciated with variations in the transport from source regions. For example, differences in time since air parcels left the Arabian or Indian coasts was shown to be an important factor for explaining the substantial differences in absolute concentrations.
1. Introduction
Aerosols have been found to have a large influence on the radiative properties of the
25
(Charl-ACPD
2, 2373–2411, 2002 Interhemispheric differences during INDOEX M. Norman et al. Title Page Abstract Introduction Conclusions References Tables Figures J I J I Back Close Full Screen / EscPrint Version Interactive Discussion
© EGU 2002
son et al., 1992) and indirectly by changing the properties of clouds present in the atmosphere (Twomey, 1974; IPCC, 2001). Anthropogenic activities have substantially increased the amount of aerosols present in the atmosphere and the climate effects of the anthropogenic aerosols have received large attention due the magnitude and large uncertainties of their climatic effects (IPCC, 2001). In order to reduce these
5
uncertainties measurements of the aerosol physical and chemical properties of the aerosol are needed to trace the nature, location and strength of the sources as well as to understand their physical and chemical transformation processes occurring in the atmosphere.
The Indian Ocean during January to March is a unique location to investigate the
10
effects of continental and anthropogenic aerosol against a background marine aerosol. Large emissions of aerosols and aerosol precursors from fossil fuel combustion (Arndt et al., 1997), biomass burning (Galanter et al., 2000) as well as soil dust (Tegen and Fung, 1994) take place over India and neighbouring countries. These aerosol parti-cles and gases are transported with the northeasterly trade winds, mainly in the lower
15
troposphere out over the Indian Ocean (Ramanathan et al., 1996). In addition there are large emissions of soil dust from the continental areas north and northwest of the Arabian Sea (Tegen and Fung, 1994), which are subsequently advected out over the Arabian sea. These two major airflows converge over the Indian Ocean and continue southwards. At the Inter Tropical Convergence Zone, ITCZ (usually located between
20
the equator and 10◦S at the time of the year), the polluted air will meet pristine marine air containing aerosols mainly from natural marine sources, including sea spray and dimethyl sulfide (DMS).
The Indian Ocean experiment, INDOEX, was performed over the Indian Ocean dur-ing the Asian winter monsoon season January–March. In focus was the radiative effect
25
of the anthropogenic aerosols. The INDOEX campaign began with ship and land based observations in 1995–1997 and was intensified during a First Field Phase (FFP) during 1998 (Mitra, 1999) and culminated with the Intensive Field Phase (IFP) during 1999 which included a large variety of platforms and measurements (Ramanathan et al.,
ACPD
2, 2373–2411, 2002 Interhemispheric differences during INDOEX M. Norman et al. Title Page Abstract Introduction Conclusions References Tables Figures J I J I Back Close Full Screen / EscPrint Version Interactive Discussion
© EGU 2002
2001). References to several detailed studies carried out as part of INDOEX are given in Sect. 3. Two of the main objectives were to asses the role of the ITCZ in the trans-port of aerosols and gases and to study the imtrans-portance of sulfate and other continental aerosol components for the radiative forcing over the Indian Ocean (Ramanathan et al., 1996).
5
In this paper we present results from ship based measurements of the concentration and relative chemical composition of the water soluble inorganic fraction of the aerosol in the Marine boundary layer (MBL). The measurements were performed over the In-dian Ocean during the FFP in 1998 and the IFP 1999. In addition, measurements of gas phase sulfur dioxide (SO2) were performed during the IFP 1999. The main
ob-10
jectives of this study were (i) to study the role of the ITCZ in the transport of marine boundary layer aerosol and SO2over the Indian Ocean, (ii) to investigate the variation in concentration and relative chemical composition of the aerosol in relation to the air mass origin (iii) and to investigate the interannual difference of the aerosol between the 1998 and 1999.
15
2. Method
2.1. Cruise track and observing periods
The measurements were performed on board the US research vessel Ronald H. Brown during the IFP 1999 and on board the Indian research vessel Sagar Kanya during both the FFP 1998 and the IFP 1999. In total three cruises were performed, the Sagar
20
Kanya 1998 (SK 1998) consisting of two Legs, the Sagar Kanya 1999 (SK 1999) also consisting of two Legs and the Ronald H. Brown 1999 (RB 1999) consisting of three Legs. Table 1 shows the sampling periods together with the start and end locations of each Leg. Figure 1 shows the cruise tracks for the cruises.
ACPD
2, 2373–2411, 2002 Interhemispheric differences during INDOEX M. Norman et al. Title Page Abstract Introduction Conclusions References Tables Figures J I J I Back Close Full Screen / EscPrint Version Interactive Discussion
© EGU 2002
2.2. Sampling
2.2.1. Particulate phase
The collection of particulate mass on board Ronald H. Brown was made from an intake located at the top of a 6 m mast in front of the bridge. The height of the collection point was 18 m above sea level.
5
Ambient sub-micron aerosol mass (here referred to as fpm) was determined using a filter pack set (flow rate 50 dm−3min−1) mounted on a sliding tray next to the entrance of the mast. The size of the sampled particles (D50 = 0.9 µm aerodynamic diameter, EAD) was determined by using a cyclone on the inlet (Quinn and Bates, 1989). The set held three units: two of them collected samples and one served as a sampling and
10
an analytical blank. Each of the units consisted of one 47 mm Millipore Teflon aerosol particle filter with 1.0 µm pore size held in a polyacetal (Deldrin®) filter holder. More details are given in Leck and Persson (1996). Each sample prolonged for about 6 h.
In order to limit the sampling to periods of clean air, the pumps to the aerosol sam-pling systems were controlled by the ship’s pollution sensor (Quinn et al., 2001). The
15
sample air was considered to be free of ship contamination or influence from other ships in the surroundings when the relative wind speed was greater than 3 ms−1 and forward of the beam and with no rapid increase in number concentration of particles greater than 15 nm in diameter.
The same setup for ambient sub-micron aerosol was used on board the Sagar
20
Kanya, but the control system for avoiding contamination was limited to wind direc-tion.
2.2.2. Gas phase SO2
The measurement of SO2 was performed with an automated real-time modified Saltz-man et al. (1993) technique involving high pressure liquid chromatography with
fluores-25
ACPD
2, 2373–2411, 2002 Interhemispheric differences during INDOEX M. Norman et al. Title Page Abstract Introduction Conclusions References Tables Figures J I J I Back Close Full Screen / EscPrint Version Interactive Discussion
© EGU 2002
line with a total flow rate of 50 dm3min−1. The 0.9 µm EAD inlet used the same type of cyclone as for the fpm sampling. The inlet was placed next to the aerosol inlets and with a teflon tubing running parallel to the aerosol sampling line. To further reduce potential surface particle losses the air was drawn through a filter to remove particles. Calibration was performed with gas phase calibration using a permeation device with
5
known emission at a specific temperature. The gas was diluted with controlled flow of zero gas to different concentrations. The detection limit was estimated to 5 pptv with accuracy of 20% and examples of calculated reproducibility were 43.2±2.5 pptv (5.7%) and 21.1 ± 0.9 pptv (4.5%).
2.3. Analysis of particulate matter
10
All filter substrate, samples and blanks were carefully handled in a glove box (free from particles and gases such as ammonia (NH3) and SO2both prior to and after collection. After exposure all filters and substrates were extracted (inside the glove box) by wetting with 0.5 cm3 methanol and 4.5 cm3 deionized water (Millipore Alpha-Q, resistivity 18 MΩ−1cm−1). The extracts were then analyzed for major cations, major anions and
15
methane sulfonate (CH3SOO−, MSA) using chemically suppressed IC. The analysis of cations used Dionex CG12A/CS12A columns and a CRSR-I auto suppressor. Strong anions were analyzed with a DIONEX AG4A/AS4A column and a CSRS-1 membrane suppressor. MSA was analyzed with a Dionex AG4/AS4 column using a stepwise elution. A Dionex ATC-1 column was used prior to the injection valve in order to retain
20
ionic contaminants in the eluent during the run. More details are given in Quinn et al. (1998).
The average blank to sample fractions were < 5% for sulfate (SO2−4 ) and ammonium (NH+4), < 10% for nitrate (NO−3) and potassium (K+), < 15% for MSA and magnesium (Mg2+) and < 30% for sodium (Na+), chloride (Cl−) and calcium (Ca2+). Duplicate
25
samples agreed on average, within 25%.
ACPD
2, 2373–2411, 2002 Interhemispheric differences during INDOEX M. Norman et al. Title Page Abstract Introduction Conclusions References Tables Figures J I J I Back Close Full Screen / EscPrint Version Interactive Discussion
© EGU 2002
ratios to Na+ or Mg2+ (when no Na+ data were available) in sea water taken from Wilson (1975). All concentrations for the particulate matter and gas phase have been converted to standard atmosphere temperature and pressure (STP) by using observed temperature and pressure.
2.4. Trajectories and supporting meteorological data
5
2.4.1. Trajectories
Air mass back trajectories were calculated for the Ronald H. Brown cruise during IFP 1999 for the arrival height of 500 m at the ship position every six hours. The trajectories were calculated with the hybrid single-particle Langrangian integrated model HY-SPLIT 4 based on the FNL global wind field (Draxler, 1992). Trajectories for the Sagar Kanya
10
cruises 1998 and 1999 were calculated for the arrival height of 950 hPa and at the ship position for the center time for each filterpack sample. The trajectories were calculated with the McGrath (1989) model at the European Center of Medium-range Weather Forecasts (ECMWF) using their analyzed wind and pressure fields. All trajectories were calculated for a time period of seven days backward in time.
15
A comparison between the two trajectory models showed that the difference was small (< 500 km) for the first 100 h backwards in time and that the mean difference never exceeded 1000 km for the whole 7 days calculated period.
2.4.2. Supporting data
Meteorological parameters including surface temperature, relative humidity (RH), wind
20
speed and wind direction (both relative and absolute), pressure and short wave radia-tion were measured on board both Ronald H. Brown and Sagar Kanya.
ACPD
2, 2373–2411, 2002 Interhemispheric differences during INDOEX M. Norman et al. Title Page Abstract Introduction Conclusions References Tables Figures J I J I Back Close Full Screen / EscPrint Version Interactive Discussion
© EGU 2002
3. Influence of the ITCZ on the Indian Ocean MBL aerosol and SO2
One of the main objectives of the INDOEX project was to assess the role of ITCZ in the transport of trace constituents and pollutants over the Indian Ocean (Ramanathan et al., 1996). This study included four separate cross ITCZ transects: Sagar Kanya 1998 southwards during Leg 1 (SK 1998 south), Sagar Kanya 1998 northwards during
5
Leg 2 (SK 1998 north), Sagar Kanya 1999 northwards during Leg 2 (SK 1999 north) and Ronald H. Brown 1999 northwards during Leg 1 (RB 1999 north). Figure 2 shows the cruise tracks. Also shown are the calculated trajectories for each transect and the position of the ITCZ. The concentrations of fpm for selected water-soluble components as a function of latitude relative to the ITCZ are presented in Fig. 3. The
concentra-10
tions were normalized such that the median concentrations north of the ITCZ were set equal to one for each transect. Figure 3a shows that the sum of the analyzed fpm had a marked change in concentration at the position of the ITCZ. This applied to all four pas-sages, although the median concentration ratio between north of the ITCZ and south of the ITCZ varied between 6 and 14. As seen in Figs. 3b–d a similar sharp
concentra-15
tion increase was observed for constituents with typical anthropogenic or continental sources like nss-SO2−4 mainly from fossil fuel combustion, NH+4 from agriculture and nss-K+ from biomass burning. The fpm NO−3 was only observed in concentrations close to the detection limit and will not be further discussed. The north/south ratios for nss-SO2−4 , NH+4 and nss-K+ range between 6–16, 20–80 times and above 40,
re-20
spectively. The relative larger concentration differences observed for nss-K+ and NH+4 are consistent with their relatively weaker natural sources over the ocean (Quinn et al., 1992; Saxena, 1983) compared to that of nss-SO2−4 (Ayers et al., 1996). The fpm soil dust influence, here represented by nss-Ca2+, also showed slightly enhanced con-centration north of the ITCZ. However, Fig. 3e shows that the variation was high and
25
the south-north difference was not significant. No significant south-north trend was ob-served in the sea salt components, calculated as the sum of Na+, Cl−, sea salt SO2−4 , sea salt K+ and sea salt Ca2+, see Fig. 3f. This suggests that the observed south
ACPD
2, 2373–2411, 2002 Interhemispheric differences during INDOEX M. Norman et al. Title Page Abstract Introduction Conclusions References Tables Figures J I J I Back Close Full Screen / EscPrint Version Interactive Discussion
© EGU 2002
north gradient for constituents of anthropogenic origin was not primarily caused by dif-ferences in meteorological factors, like precipitation and variability in boundary layer height. We conclude that the different origin of the air north respectively south of the ITCZ was the reason for the observed differences.
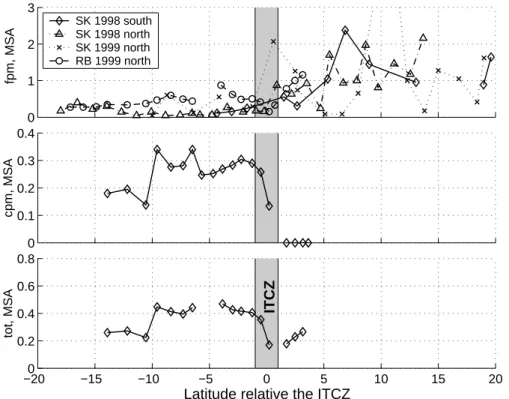
A somewhat striking result was the high concentration of fpm MSA observed in the
5
samples collected north of the ITCZ, Fig. 4a. The coarse particulate mode (cpm) MSA was measured by Quinn et al. (2002) during RB 1999 north, Fig. 4b. The cpm MSA was found to be below detection limit north of the ITCZ. The only source of particulate MSA is the oxidation from DMS in the atmosphere (Saltzman et al., 1983). However, when comparing with the observed DMS concentrations, both in air and in sea
wa-10
ter (only available for Ronald H. Brown cruise), no indication of higher concentrations north of the ITCZ was recorded (Bates 2002, unpublished data). Variation in the DMS concentration could therefore be ruled out as the cause of the observed gradient in the particulate MSA across the ITCZ. According to Yin et al. (1990), formaldehyde (HCHO), nitrogen dioxide, ozone (O3) and hydrogen dioxide (HO2) are important
oxi-15
dants in the DMS oxidation scheme for the MSA production. Measurements during the RB 1999 north transect showed substantially higher concentrations of HCHO (Wagner et al., 2001) and O3 (Stehr et al., 2002) north of the ITCZ. This would have lead to an increased production of particulate MSA in the polluted air independent of the particle size. However, the cpm MSA results during the RB 1999 north transect, Fig. 4b, was
20
observed to be below detection limit north of the ITCZ. The sum of total analyzed MSA (fpm+ cpm), Fig. 4c, shows that here was about the same concentration on both sides of the ITCZ suggesting a redistribution of MSA rather than stronger sources or sinks on either side. This indicates that the higher oxidant levels were not the major reason for the higher fpm MSA observed in the polluted air north of the ITCZ. We suggest that the
25
available aerosol surface area might have been the cause of the observed MSA pattern. Kerminen and Leck (2001) calculated that the condensation of gas phase MSA will fa-vor the aerosol size range with the largest available surface area. Bates et al. (2002) reported during the RB 1999 north transect significantly higher submicrometer particle
ACPD
2, 2373–2411, 2002 Interhemispheric differences during INDOEX M. Norman et al. Title Page Abstract Introduction Conclusions References Tables Figures J I J I Back Close Full Screen / EscPrint Version Interactive Discussion
© EGU 2002
number north of the ITCZ compared to south of the ITCZ. The calculated aerosol vol-ume size distribution was dominated by the coarse mode in samples collected south of the ITCZ while the submicrometer aerosol dominated in the air originating from India. The aerosol surface size distribution is likely to have been even more dominated by the smaller sizes in the polluted air masses. Thus a larger fraction of gas phase MSA
5
could then be assumed to have been condensed on the fpm north of the ITCZ. This would explain not only the higher fpm MSA observed north of the ITCZ, but also the higher cpm MSA observed in the clean air south of the ITCZ.
During the INDOEX IFP 1999 several additional measurements of aerosol and gaseous components were performed. For a direct comparison with this study one
10
ITCZ cross transect is available (RB 1999 north). Ball et al. (2002) and Quinn et al. (2002) reported results of the fpm water-soluble ionic composition in good agree-ment with the present study. This is reassuring since different sampling and analytical techniques were applied. A similar south/north gradient was also found for fpm organic carbon and elemental carbon across the ITCZ (Neus ¨uss et al., 2002). Measurements
15
of cloud condensation nuclei during FFP 1998 (Cantrell at al., 2000) also showed a similar marked north/south gradient indicating the climatic relevance of these results.
Measurements of gases with anthropogenic origin, like carbon monoxide (CO) and O3, also showed substantially higher concentrations north of the ITCZ on board the Ronald H. Brown during IFP 1999, as observed by Stehr et al. (2002). The difference
20
was smaller for gases than for aerosols. In contrast to the parameters discussed above, measurements of SO2during the RB 1999 north, Fig. 5, did not show any south to north concentration increase. Instead a slight decrease was recorded. These noticeable results will be further discussed in Sects. 4.1 and 5.1.
All ship based particulate and gaseous measurements (SO2not included) were
sup-25
ported by aircraft measurements within the MBL (Reiner et al., 2001; Sprung et al., 2001; Wisthaler et al., 2002). The aircraft measurements showed marked differences in both gas and particulate phase constituents across the ITCZ although these dif-ferences were smaller than the ones we report here for the ship based observations
ACPD
2, 2373–2411, 2002 Interhemispheric differences during INDOEX M. Norman et al. Title Page Abstract Introduction Conclusions References Tables Figures J I J I Back Close Full Screen / EscPrint Version Interactive Discussion
© EGU 2002
(Sprung et al., 2001; Reiner et al., 2001). The reason might be that there was a more efficient cross ITCZ transport in the free troposphere than in the MBL, as also indicated by trajectory analysis by Verver et al. (2001). Measurements showed that major part of the pollution over the Indian Ocean was transported from southern and southeast Asia at altitudes above the MBL with a sea breeze circulation underneath it (Lelieveld
5
et al., 2001; Reiner et al., 2001; de Reus et al., 2001; Leon et al., 2001; Welton et al., 2002). These pollution layers above the MBL might to a small extent have the potential to cross the ITCZ.
As seen in Fig. 2 the geographical position of the ITCZ varied substantially, between 14◦S to 1◦ N, between the four cross ITCZ transects performed during this study.
Fig-10
ure 3 shows that there were no, or only small, cross ITCZ exchange of fpm aerosols in the MBL since the concentrations of continental fpm aerosol components were not elevated in the samples collected just south of the ITCZ. We conclude that the ITCZ should be looked upon as an effective barrier for transport of MBL fpm aerosols dur-ing the winter monsoon season over the Indian Ocean. Irrespective of the latitudinal
15
position of the ITCZ, the air north of the ITCZ was influenced by anthropogenic and continental sources whereas the air south of the ITCZ showed no such influence.
In the following sections an effort is made to seek causes for the observed variations in the particulate absolute concentration north respective south of the ITCZ. The anal-ysis will be based on the data set that was collected during the Ronald H. Brown 1999
20
cruise, since this cruise contains the largest number of samples.
4. Variations in the Indian Ocean MBL aerosol north of the ITCZ
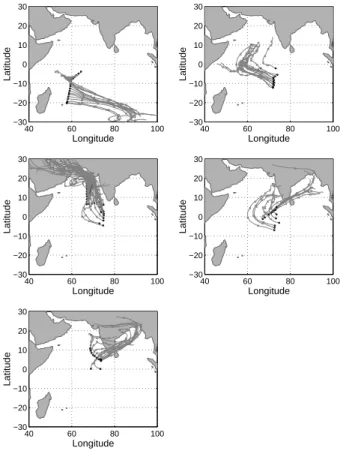
The RB 1999 samples were classified into different groups according to the appearance of the trajectories. This classification was made independent of the position and date of sampling. Five major groups were identified.
25
– Clean air south of the ITCZ (cleanS): Trajectories with origin in the southern Indian
ACPD
2, 2373–2411, 2002 Interhemispheric differences during INDOEX M. Norman et al. Title Page Abstract Introduction Conclusions References Tables Figures J I J I Back Close Full Screen / EscPrint Version Interactive Discussion
© EGU 2002
from the south, Fig. 6a. This data set is described in Sect. 5.
– Clean air north of the ITCZ (cleanN): Trajectories with origin in the northern Indian
Ocean but with no indication of contact with land during the last seven days. The prevailing arrival direction at the ships was from the north, Fig. 6b.
– Arabian sea (Arab): Trajectories from the Arabian Sea and the surrounding land
5
areas but with no Indian subcontinent contact. Fig. 6c.
– Small Indian influence (sInd): Trajectories that originated, or passed over, densely
populated or industrialized places in the Indian subcontinent with more than 5 days of transport time since last contact with India, or trajectories that only passed a short distance over the Indian subcontinent. Fig. 6d.
10
– Large Indian influence (lInd): Trajectories that originated, or passed over, densely
populated or industrialized areas in the Indian subcontinent with less than 5 days of transport time since last contact with India or samples with less than 2 days of transport time since last contact with India. Fig. 6e.
Statistics on absolute concentration for the different trajectory groups are shown in
15
Table 2.
4.1. Anthropogenic components
Samples with trajectories originating over India, (sInd and lInd) showed the highest concentrations of the anthropogenically derived constituents, nss-SO2−4 , NH+4, nss-K+, as well as for the sum of total analyzed fpm mass with nss-SO2−4 and NH+4 as the major
20
components. Overall, the concentrations in the sInd group were about half of those in the lInd group. Our results were consistent with source estimations for biomass burning (Galanter et al., 2000), SO2(Arndt et al., 1997) and NH+4 (Bouwman et al., 1997) which indicate large sources in India.
ACPD
2, 2373–2411, 2002 Interhemispheric differences during INDOEX M. Norman et al. Title Page Abstract Introduction Conclusions References Tables Figures J I J I Back Close Full Screen / EscPrint Version Interactive Discussion
© EGU 2002
Among the samples collected north of the ITCZ, the samples representing the cleanN group showed the lowest concentrations of anthropogenic constituents, as well as the lowest median total sum.
The observed variation in the anthropogenic constituents within the lInd, sInd and cleanN groups was related to the time since last contact with India (TInd) or with any
5
continental area (Tland), cf. Table 2. The highest concentrations were associated with a median TInd = 52 h (lInd) and the lowest with a median Tland > 170 h (cleanN). We attribute the difference to increasing influence of deposition losses with increasing time of transport over the Indian Ocean.
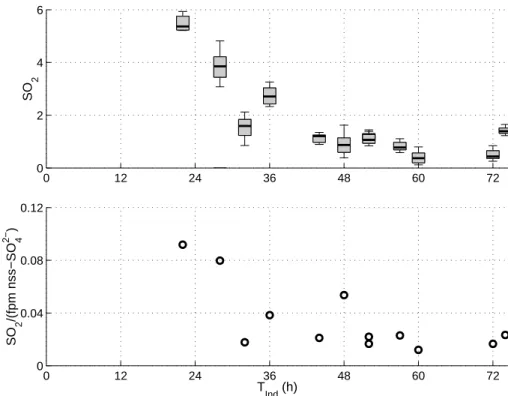
The lack of south to north SO2 gradient (Fig. 5), may seem surprising in view of
10
the strong Indian sources of SO2 (Arndt et al., 1997). However, when sorting the SO2data according to trajectory groups a consistent pattern evolved, Table 2, with the most polluted cases (lInd) showing the highest median SO2concentrations. Figure 7a shows that the SO2 concentration decreased substantially well before TInd equals to 60 h. By comparing the SO2 concentration with the nss-SO2−4 levels, Figure 7b, a
15
more rapid decrease was observed for SO2 than for nss-SO2−4 . The larger loss for SO2 relative to nss-SO2−4 was probably due to its higher dry deposition rate together with gas to particulate phase oxidation (Langner and Rodhe, 1991). Over the Indian Ocean, as shown in Fig. 7b and Table 2, the levels of SO2were at the most 10% of the recorded fpm nss-SO2−4 concentrations. The observed variability in fpm nss-SO2−4 over
20
the Indian Ocean north of the ITCZ could therefore not be explained by the observed levels of SO2.
4.2. Soil dust
The samples with trajectories originating from the Arabian Sea or from the surrounding land areas, Arab, had similar absolute fpm sum as the sInd group. However the former
25
were more enriched by nss-Ca2+. The estimated large source area for dust (Tegen and Fung, 1994) in the land areas around the Arabian sea caused the relatively elevated
ACPD
2, 2373–2411, 2002 Interhemispheric differences during INDOEX M. Norman et al. Title Page Abstract Introduction Conclusions References Tables Figures J I J I Back Close Full Screen / EscPrint Version Interactive Discussion
© EGU 2002
concentrations of nss-Ca2+compared to the other aerosol constituents. The Ca2+/Na+ molar ratio can be used to indicate the influence of continental sources relative to sea salt sources. The observed median Ca2+/Na+molar ratio in the Arab was higher (0.34) than in the sInd (0.26), indicating a larger soil dust influence in the Arab group. On the other hand, the results relative to the lInd group showed opposite values with both
5
nss-Ca2+ levels and Ca2+/Na+ ratio exceeding those of the Arab group. This is likely to be due to the more limited time since last contact with India (median TInd = 52 h) compared to the time since last contact with land around the Arabian sea (median TArab = 120 h) and hence larger influence by deposition in the latter group.
4.3. Sea salt
10
Studies in clean marine areas have observed the logarithm of the sea salt concentra-tions in the atmosphere (both number and mass) to be in linear relation to the local wind speed due to wave action on the sea surface (O’Dowd et al., 1997; Quinn et al., 2000; Nilsson et al., 2001; Leck et al., 2002a). However, a MBL affected by anthropogenic or continental sources has been reported to contain a modified sea salt distribution.
15
Elevated concentrations of Cl− and Na+ have been found in particulate and precipita-tion samples from the Indian continent (Kulshrestha et al., 1995; Norman et al., 2001) indicating other potential sources than the ocean, probably soil dust. This is consistent with this study, showing that the fpm Na+ concentrations were slightly elevated in the samples with short time since last contact with land (Arab and lInd), cf. Table 2. The
20
lack of significant covariation (r2< 0.2) between local wind speed and logarithm of the sea salt concentration in the samples points in the same direction.
The acidity of the particles also affects the sea salt distribution by a loss of Cl− increasing towards low pH. The Cl−/Na+molar ratio of sea salt particles has been ob-served to decrease with increasing particle acidity from the molar ratio of pure seawater
25
sodium chloride (NaCl) of 1.17 (Keene et al., 1998). To investigate the importance of an increased acidity for the Cl− depletion, we used the calculated difference between
ACPD
2, 2373–2411, 2002 Interhemispheric differences during INDOEX M. Norman et al. Title Page Abstract Introduction Conclusions References Tables Figures J I J I Back Close Full Screen / EscPrint Version Interactive Discussion
© EGU 2002
the sum of equivalent concentration of analyzed anions and cations as an indication for level of “acidity” in the samples. As shown in Fig. 8, an increasing “acidity” resulted in more depletion of chloride, with molar ratios below 0.2 for samples with highest “acid-ity”. Also the median ratio for the different trajectory groups varied in this way with Cl−/Na+molar ratios of around 0.6 in the cleanN group and then decreasing to 0.13 in
5
the sInd and to 0.06 in the lInd. This in line with the increasing level of pollution. We conclude the variation in the sea salt components north of the ITCZ to be re-lated mainly to the depletion of Cl−, with some indication of additional contribution from continental sources.
5. Variations in the Indian Ocean MBL aerosol and SO2south of the ITCZ
10
The discussion below is separated according to contribution from the two major sources, biogenic sulfur and sea salt.
5.1. DMS derived components
The observed fpm MSA/nss-SO2−4 molar ratio was on average around 3%. This is in agreement with other measurements performed in unpolluted air over tropical waters
15
(Bates at al., 1992; Bates et al., 2001; Leck et al., 2002b), and also in line with values from model calculations (Ayers et al., 1996) at similar temperatures and latitudes as this study. This suggests that the observed fpm nss-SO2−4 originated from the oxidation of DMS, supporting the conclusion in Sect. 3 that there was no, or only marginal, influence of continental or anthropogenic sulfur sources south of the ITCZ.
20
A major fraction (∼75%) of the total particulate MSA was associated with the cpm (comparison with data from Quinn et al., 2002). As discussed in Sect. 3, the conden-sation of MSA seemed to have favored the largest available aerosol surface. Measure-ments being representative of clean air during INDOEX IFP south of ITCZ by Bates et al. (2002) showed the aerosol surface to be larger in the cpm than in the fpm, which is
ACPD
2, 2373–2411, 2002 Interhemispheric differences during INDOEX M. Norman et al. Title Page Abstract Introduction Conclusions References Tables Figures J I J I Back Close Full Screen / EscPrint Version Interactive Discussion
© EGU 2002
consistent with the enhanced cpm MSA values.
We concluded that the observed variation in SO2, nss-SO2−4 and MSA concentrations was related to variations in the DMS source or to some extent variation in the oxidant concentrations.
Assuming the nss-SO2−4 south of ITCZ to be representative for biogenic SO2−4
5
sources over the Indian Ocean, the contribution north of the ITCZ from biogenic sources of the total fpm nss-SO2−4 could be calculated. This calculation indicated that up to 40% of the nss-SO2−4 in the cleanN group, < 20% in Arab and sInd groups, while only a small fraction (< 10%) in the most polluted cases (lInd group) originated from biogenic sulfur. The same comparison for SO2showed that a major fraction of the SO2
10
over the Indian Ocean north of the ITCZ originated form a biogenic source. The only exception was for samples with TIndless than 60 h.
The observed variation in NH+4 was larger than for nss-SO2−4 causing the observed variation in the NH+4/nss-SO2−4 molar ratio (Table 2). The median fpm NH+4/nss-SO2−4 molar ratio was 0.3 (Table 2) substantially lower than the value around 1 typically
re-15
ported elsewhere (Covert et al., 1988; Leck and Persson, 1996). Measurements by Huebert et al. (1996) showed a decreasing NH+4/nss-SO2−4 molar ratio with increasing particle size. The volume size distribution observed simultaneously with our measure-ments by Bates et al. (2002) showed the submicrometer volume to be shifted towards 1 µm diameter, suggesting a low molar ratio. However, the observed values were still
20
lower than those reported by Huebert et al. indicating either a lack of available NH3(g) or a chemical composition of the preexisting particles that prevented NH3(g) uptake. 5.2. Sea salt
In samples that were not influenced by continental sources the sea salt varied accord-ing the local wind speed.
25
ACPD
2, 2373–2411, 2002 Interhemispheric differences during INDOEX M. Norman et al. Title Page Abstract Introduction Conclusions References Tables Figures J I J I Back Close Full Screen / EscPrint Version Interactive Discussion
© EGU 2002
The local wind speed could explain a major part of the variation in the fpm sea salt (r2 = 0.6). The absence of anthropogenic influence (SO2−4 ) also strongly reduced the particle acidity (as calculated in Sect. 4.1) compared to north of the ITCZ. The median fpm Cl−/Na+ molar ratio was 1.0, showing only small depletion of Cl− and thus concluded not be of significance for the observed variability in Cl−and sea salt.
5
These results indicate that, in contrast to north of the ITCZ, the sea salt concentration south of the ITCZ was dependent on the local wind speed. Some of the fpm variation could also be attributed to the integrated wind speed along the air trajectory one week backward in time.
6. Interannual variation in the Indian Ocean MBL submicrometer aerosol
10
The measurements of fpm during both INDOEX FFP 1998 and IFP 1999 gave us a unique possibility to compare not only the variation between 1998 and 1998 but also two separate efforts during 1999 (spatial and temporal variation).
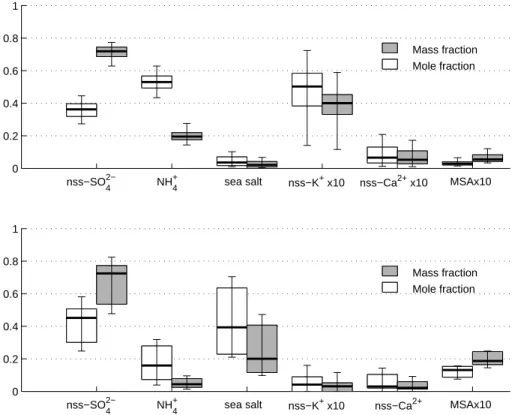
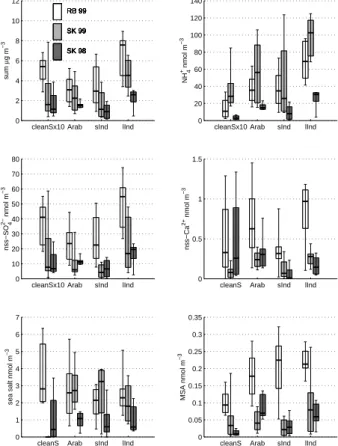
The relative chemical composition collected during RB 1999 north of the ITCZ (Fig. 9a and Table 2) was remarkable constant despite the differences in absolute
con-15
centration, as discussed in Sect. 4. The relative chemical composition was dominated by NH+4 and nss-SO2−4 . The contributions from nss-K+and the sum of the sea salt com-ponents were small with the remaining comcom-ponents negligible. The relative chemical composition during the RB 1999 agreed with that from the Sagar Kanya cruises (1998 and 1999) within 10% for the major components. In general, the relative chemical
20
composition south of the ITCZ showed larger variation than north of the ITCZ during all cruises (shown for RB 1999 in Fig. 9b and Table 2). The relative chemical composition south of the ITCZ was dominated by nss-SO2−4 with the sum of the sea salt components and NH+4 as other major components.
A comparison of absolute concentrations during all three cruises, divided into the
25
trajectory groups cleanS, Arab, sInd and lInd, is shown in Fig. 10. The variation be-tween the trajectory groups for the Sagar Kanya cruises exhibited the same general
ACPD
2, 2373–2411, 2002 Interhemispheric differences during INDOEX M. Norman et al. Title Page Abstract Introduction Conclusions References Tables Figures J I J I Back Close Full Screen / EscPrint Version Interactive Discussion
© EGU 2002
pattern as for the RB 1999 data set. This support that the same processes causing the variation in concentration and chemical composition within the RB 1999 data set, as presented in Sects. 4 and 5, also applied for both the SK 1998 and the SK 1999 data sets.
However, there were several distinct differences in the absolute concentrations
be-5
tween the data sets were observed. In general, higher concentrations of all constituents occurred during RB 1999, in all trajectory groups, than during SK 1998. For some con-stituents (total sum, NH+4 and sea salt) this also applied for SK 1999 in comparison to SK 1998. However, large differences in absolute concentrations were also observed between the RB 1999 and SK 1999 cruises. In order to seek causes for the interannual
10
variation as well as the variation between the two 1999 cruises, we investigated the variation in source and sink strength, the location of the source area and time the air spent over the Indian Ocean since last contact with the Arabian and Indian coast.
The absolute concentrations of the anthropogenic and continental constituents were observed to be substantially higher (2–4 times) in the lInd and sInd groups during the
15
RB 1999 cruise compared to the SK 1998. In the case of lInd, the median time of transport since last contact with India was found to be longer (TInd= 110 h) during the SK 1998 cruise compared to the 1999 cruises (TInd= 50 and 60 h for RB 1999 and SK 1999, respectively). The shorter transport times in 1999 were associated with strong northeasterly flow over the Indian continent in February and March 1999 (Verver et al.,
20
2001; Rasch et al., 2001). The potentially larger deposition losses in 1998 are likely to have contributed to the lower concentrations during the SK 1998 cruise.
For the sInd group there was no such correlation with the TInd. However, by compar-ing the origin of the trajectories, a difference in source region was identified. During the SK 1998 cruise a major part of the trajectories in the sInd group passed Sri Lanka with
25
no contact with the Indian subcontinent during the last 7 days. This was not the case for the 1999 cruises. The sources of the anthropogenic components (Arndt et al. 1997; Bouwman et al., 1997), are estimated to be smaller in Sri Lanka than in India. This vari-ation in source region could possibly explain the lower concentrvari-ations observed also
ACPD
2, 2373–2411, 2002 Interhemispheric differences during INDOEX M. Norman et al. Title Page Abstract Introduction Conclusions References Tables Figures J I J I Back Close Full Screen / EscPrint Version Interactive Discussion
© EGU 2002
in the sInd group during 1998. The difference in concentrations of the anthropogenic constituents between RB 1999 and SK 99 could not be attributed to similar differences in transport and remains to be explained.
The concentration of soil dust (nss-Ca2+) was found to be more than twice as high in the Arab samples during the RB 1999 cruise than during the SK 1999 and SK 1998
5
cruises. The RB 1999 Arab samples were collected during March 1999 and during that month unusually strong outflow from the dry areas around the northern Arabian Sea was observed (Verver et al., 2001). Model studies of the soil dust over the Arabian Sea by Rasch et al. (2001) also showed elevated concentrations during March 1999 in contrast to both February 1999 (mainly the sampling period for Arab during SK 1999)
10
and March 1998 (sampling period for SK 1998). This could thus possibly explain the higher nss-Ca2+ concentrations in the Arab group during RB 1999.
The sea salt concentration was elevated in 1999 compared to 1998. The study by Verver et al. (2001) indicated stronger winds over the Indian Ocean during January– March in 1999 than in 1998, possibly contributing to the higher concentrations. The
15
concentration of fpm constituents with biogenic origin was, on average, 2–8 times higher during RB 1999 than during SK 1998 and SK 1999. We suggest that varia-tions in source strength and source area could explain this variation, but due to limited amount of data this could not be verified.
Although the data showed some differences, both between 1998 and 1999 and
in-20
between the two 1999 cruises, which we were not able to explain, we believe that the conclusions in Sects. 4 and 5 are representative for each data set. We conclude that variations in source strength, source area and time of transport over the Indian Ocean were important causes for variations in concentration. However these factors could not explain all interannual and spatial variations.
ACPD
2, 2373–2411, 2002 Interhemispheric differences during INDOEX M. Norman et al. Title Page Abstract Introduction Conclusions References Tables Figures J I J I Back Close Full Screen / EscPrint Version Interactive Discussion
© EGU 2002
7. Conclusions
The water soluble inorganic part of the sub-micrometer aerosol was measured from two research vessels over the Indian Ocean during the winter monsoon season (February to March) within the frames of the INDOEX project during 1998 and 1999. Additional measurements of the gas phase SO2were performed from one research vessel during
5
the INDOEX IFP 1999.
One of the main goals of this study was to investigate the role of the ITCZ for the transport of MBL aerosol and SO2. We found the ITCZ to be an effective barrier for sub-micrometer particles in the MBL with no indication of transport across the ITCZ. Irrespective of the latitudinal position of the ITCZ all samples collected north of the
10
ITCZ were found to be influenced by anthropogenic and continental sources with 6– 16, 20–80 and > 40 times higher concentrations than south of the ITCZ for nss-SO2−4 , NH+4 and nss-K+, respectively. There was no, or only marginal, influence of continental or anthropogenic nss-SO2−4 south of the ITCZ and the variation in concentration was attributed to variation in the marine biogenic sources. The contribution from marine
15
biogenic sources to the fpm nss-SO2−4 north of the ITCZ was estimated to be up to 40% in clean air but less than 10% in polluted air originating from India.
MSA showed surprisingly a similar variation with higher absolute fpm concentration in the polluted air north of the ITCZ as the anthropogenic constituents. South of the ITCZ ∼75% of the total MSA was associated with the cpm aerosol, while north of the
20
ITCZ the MSA almost completely was found on the fpm particles. The distribution of the aerosol surface area available for the condensation of gaseous MSA into particulate phase was suggested to be the reason for this variation.
The observed concentrations of SO2showed a lack of south to north gradient across the ITCZ. Only samples with time since last contact with India less than 60 h showed a
25
noticeable anthropogenic influence. The SO2concentrations made up for at the most 10% of the observed sub-micrometer nss-SO2−4 north of the ITCZ. We conclude that the observed variation in fpm nss-SO2−4 over the Indian Ocean could not be explained
ACPD
2, 2373–2411, 2002 Interhemispheric differences during INDOEX M. Norman et al. Title Page Abstract Introduction Conclusions References Tables Figures J I J I Back Close Full Screen / EscPrint Version Interactive Discussion
© EGU 2002
by the locally observed levels of SO2.
The sea salt concentration in aerosols south of the ITCZ was found to be somewhat dependent on the local wind speed. However, north of the ITZC the variation was mainly related to the depletion of chloride in correlation with calculated particle acidity, but also with some indication of contribution from continental sources.
5
The variation in total analyzed sub micrometer concentrations north of the ITCZ was interpreted in terms of variations in source region, source strength and time of transport over the Indian Ocean. One of the main reasons for the observed differences in anthro-pogenic constituents, seemed to be the variation in deposition losses due to different time of transport over the Indian Ocean. The highest concentrations were associated
10
with the shortest time since last contact with India.
The soil dust concentration was enriched in samples with trajectories originating over land areas around the Arabian Sea. Highest concentrations were observed in March 1999 during a period with observed unusual strong outflow from land areas north of the Arabian Sea.
15
Acknowledgements. This project was founded by the Swedish Science Research Council
un-der contract No. G 5103-1238/1999. Special thanks to Umesh Kulshrestha for performing the sampling onboard the Sagar Kanya. The help from the NOAA PMEL group is greatly appre-ciated. Scientist from PMEL performed a large fraction of the chemical analysis, provided the coarse particle data and provided extensive technical support on board the Ronald H. Brown.
20
References
Arndt, R. L., Carmichael, G. R., Streets, D. G., and Bhatti, N.: Sulfur dioxide emissions and sectoral contribution to sulfur deposition in Asia, Atmos. Environ., 31, 1553–1572, 1997. Ayers, G. P., Cainey, J. M., Granek, H., and Leck, C.: Dimethylsulfide oxidation and the ratio
of methansulfonate to non sea-salt sulfate in the marine aerosol, J. Atmos. Chem., 25, 307–
25
325, 1996.
ACPD
2, 2373–2411, 2002 Interhemispheric differences during INDOEX M. Norman et al. Title Page Abstract Introduction Conclusions References Tables Figures J I J I Back Close Full Screen / EscPrint Version Interactive Discussion
© EGU 2002 T.: Bulk and size segregated aerosol composition: Impacts of meteorology and continental
emissions observed during INDOEX 1999, J. Geophys. Res., in print, 2002.
Bates, T. B., Calhoun, J. A., and Quinn, P. K.: Variations in the methansulfonate to sulfate molar ratio in submicrometer marine aerosol particles over the south Pacific Ocean, J. Geophys. Res. 9, 9859–9865, 1992.
5
Bates, T. B., Quinn, P. K., Coffman, D. J., Johnson, J. J., Miller, T. L., Covert, D. S., Wieden-sohler, A., Leinert, S., Nowak, A., and Neus ¨uss, C.: Regional physical and chemical proper-ties of the marine boundary layer aerosol across the Atlantic during Aerosols99: An overview, J. Geophys. Res. 106, 20 767–20 782, 2001.
Bates, T. B., Coffman, D. J., Covert D. S., and Quinn, P. K.: Regional marine
bound-10
ary layer aerosol size distribution in the Indian, Atlantic and Pacific Oceans: A compar-ison of INDOEX measurements with ACE-1, ACE-2, and Aerosols99, J. Geophys. Res., doi:10.1029/2001JD001174, 2002.
Bouwman, A. F., Lee, D. S., Asman, W. A. H., Dentener, F. J., Van der Hoek, K. W., and Olivier, J. G. J.: A global high resolution emission inventory for ammonia, Global Biogeochemical
15
Cycles, 11, 561–587, 1997.
Cantrell, W., Shaw, G., Leck, C., Granat, L., and Cachier, H.: Relationships between cloud condensation nuclei spectra and aerosol particles on a south-north transect of the Indian Ocean, J. Geophys. Res., 105, 15 313–15 320, 2000.
Charlson, R. J., Schwartz, S. E., Hales, J. M., Cess, R. D., Coakley, J. A., Hansen, J. E., and
20
Hofmann, D. J.: Climate forcing by anthropogenic aerosols, Science, 255, 423–430, 1992. Covert, D. S.: North Pacific marine background aerosol: average ammonium to sulfate ratio
equals 1, J. Geophys. Res., 93, 8455–8458, 1988.
Draxler, R. R.: Hybrid single-particle lagrangian integrated trajectories (HY-SPLIT): Version 3.0. User’s guide and model description, Tach. Rep. ERL ARL-195, NOAA, Silver Springs, Md.,
25
1992.
Galanter, M., Levy II, H., and Carmichael, G. R.: Impact of biomass burning on tropospheric CO, NOx and O3, J. Geophys. Res., 105, 6633–6653, 2000.
Huebert, B. J., Zhuang, L., Howell, S., Noone, K., and Noone, B.: Sulfate, nitrate, methansul-fonate, chloride, ammonia, and sodium measurement from ship, island, and aircraft during
30
the Atlantic Stratocumulus Transition Experiment/Marine Aerosol Gas Exchange, J. Geo-phys. Res., 101, 4413–4423, 1996.
ACPD
2, 2373–2411, 2002 Interhemispheric differences during INDOEX M. Norman et al. Title Page Abstract Introduction Conclusions References Tables Figures J I J I Back Close Full Screen / EscPrint Version Interactive Discussion
© EGU 2002 Hougthon, J. T., Ding, Y., Griggs, D. J., Noguer, M., van der Linden, P. J., and Xiaosu D.,
Cambridge University Press, Cambridge, UK, 2001.
Keene, W. C., Sanders, R., Pzenny, A. A. P., Vogt, R., Crutzen, P. J., and Galloway, J. N.: Aerosol pH in the marine boundary layer: A review and model evaluation, J. Aerosol Sci., 29, 339–356, 1998.
5
Kerminen V. M. and Leck, C.: Sulfur chemistry over the central Arctic Ocean during the summer: Gas-to-particle transformation, J. Geophys. Res., 106, 32 087–32 099, 2001.
Kulshrestha, U. C., Kumar, N., Saxena, A., Khare, P., Kumari, K. M., and Srivastava, S. S.: Chemical composition of atmospheric aerosol at three representative sites in Agra, Energy Environ. Monitor, 11, 177–181, 1995.
10
Langner, J. and Rodhe, H.: A global three-dimensional model of the tropospheric sulfur cycle, J. Atmos. Chem., 13, 225–263, 1991.
Leck, C. and Persson, C.: Seasonal and short-term variability in dimethyl sulfide, sulfur dioxide and biogenic sulfur and sea salt aerosol particles in the arctic marine boundary layer during summer and autumn, Tellus, 48B, 272–299, 1996.
15
Leck, C., Norman, M., Bigg, E. K., and Hillamo, R.: Chemical composition and
sources of the high arctic aerosol relevant for cloud formation, J. Geophys. Res., doi:10.1029/2001JD001463, 2002a.
Leck, C., Heintzenberg, J., and Engardt, M.: A meridional profile of the chemical composition of submicrometer particles over the East Atlantic Ocean: Regional and hemispheric
variabil-20
ities, Tellus, 54B, 377–394, 2002b.
Leileveld, J., Crutzen, P. J., Ramanathan, V., Andreae, M. O., Brenninkmeijer, C. A. M., Cam-pos, T., Cass, G. R., Dickerson, R. R., Fischer, H., de Gouw, J. A., Hansel, A., Jefferson, A., Kley, D., de Laat, A. T. J., Lal, S., Lawrence, M. G., Lobert, J. M., Mayol-Bracero, O. L., Mitra, A. P., Novakov, T., Oltmans, S. J., Prather, K. A., Reiner, T., Rodhe, H., Scheeren, H.
25
A., Sikka, D., and Williams, J.: The Indian Ocean Experiment: Widespread air pollution from South and Southeast Asia, Science, 291, 1031–1036, 2001.
Leon, J. F., Chazette, P., Dulac, F., Pelon, J., Flamant, C., Bonazzola, M., Foret, G., Alfaro, S. C., Cashier, H., Cautenet, S., Hamonou, E., Gaudichet, A., Gomes, L., Rajot, J.-L., Lavenu, F., Inamdar, S. R., Sarode, P. R., and Kadadevarmath, J. S.: Large-scale advection of
conti-30
nental aerosols during INDOEX, J. Geophys. Res., 106, 28 427–28 439, 2001.
McGrath, R.: Trajectory models and their use in the Irish meteorological service, Memorandum No. 112/89, Irish Meteorological Service, Dublin, 1989.
ACPD
2, 2373–2411, 2002 Interhemispheric differences during INDOEX M. Norman et al. Title Page Abstract Introduction Conclusions References Tables Figures J I J I Back Close Full Screen / EscPrint Version Interactive Discussion
© EGU 2002 Mitra, A. P.: INDOEX (India): Introductory note, Current Science, 76, 886–889, 1999.
Neus ¨uss, C. T., Plewka, G. A., Hermann, H., and Quinn, P. K.: Carbonaceous aerosol over the Indian Ocean: OC/EC fraction and speciation from samples taken on board the R/V Ronald H. Brown, J. Geophys. Res., doi:10.1029/2001JD000327, 2002.
Nilsson, E. D., Rannik, ¨U., Swietlicki, E., Leck, C., Aalto, P. P., Zhou, J., and Norman, M.:
5
Turbulent aerosol fluxes over the Arctic Ocean, part II: Wind driven sources from the sea, J. Geophys. Res., 106, 32 139–32 154, 2001.
Norman, M., Das, S. N., Pillai, A. G., Granat, L., and Rodhe, H.: Influence of air mass trajecto-ries on the chemical composition of precipitation in India, Atmos. Environ., 35, 4223–4235, 2001.
10
O’Dowd, C. D., Smith, M. H., Consterdine, I. E., and Lowe, J. A.: Marine aerosol, sea-salt, and the marine sulphur cycle: A short review, Atmos. Environ., 31, 73–80, 1997.
Quinn, P. K. and Bates, T. S.: Collection efficiencies of a tandem sampling system for atmo-spheric aerosol particles and gaseous ammonia and sulfur dioxide, Environ. Sci. Technol., 23, 736–739, 1989.
15
Quinn, P. K., Asher, W. E., and Charlson, R. J.: Equilibrium of the marine multiphase ammonia system, J. Atmos. Chem., 14, 11–30, 1992.
Quinn, P. K. and Coffman, D. J.: Local closure during ACE 1: Aerosol mass concentration and scattering and backscattering coefficients, J. Geophys. Res., 103, 16 575–16 596, 1998. Quinn, P. K., Bates, T. S., Miller, T. L., Coffman, D. J., Johnson, J. E., Harris, J. M., Ogren, J.
20
A., Forbes, G., Anderson, T. L., Covert, D. S., and Rood, M. J.: Surface submicron aerosol chemical composition: What fraction is not sulfate?, J. Geophys. Res., 105, 6785–6805, 2000.
Quinn, P. K., Coffman, D. J., Bates, T. S., Miller, T. L., Johnson., J. E., Voss, K., Welton, E. J., and Neus ¨uss, C.: Dominant aerosol chemical components and their contribution to extinction
25
during the Aerosols99 cruise across the Atlantic, J. Geophys. Res., 106, 20 783–20 809, 2001.
Quinn, P. K., Coffman, D. J., Bates, T. S., Miller, T. L., Johnson, J. E., Welton, E. J., Miller, M., and Sheridan, P. J.: Aerosol optical properties during INDOEX 1999: Means, variability, and controlling factors, J. Geophys. Res., doi:10.1029/2000JD000037, 2002.
30
Ramanathan, V., Coakley, J. A., Clarke, A., Collins, W. D., Crutzen, P. J., Dickerson, R., Fahey, D., Gandrud, B., Heymsfield, A., Kiehl, J. T., Krishnamurti, T., Kuettner, J., Lubin, D., Maring, H., Ogren, J., Prospero, J., Rasch, P. J., Savoie, D., Shaw, G., Tuck, A., Valero, F. P. J.,
ACPD
2, 2373–2411, 2002 Interhemispheric differences during INDOEX M. Norman et al. Title Page Abstract Introduction Conclusions References Tables Figures J I J I Back Close Full Screen / EscPrint Version Interactive Discussion
© EGU 2002 Woodbridge, E. L., and Zhang, G.: Indian Ocean Experiment (INDOEX), A multi-agency
proposal for field experiments in the Indian Ocean, Publ. 162, Scripps Inst. of Oceanogr., La Jolla, Calif., 1996.
Ramanathan, V., Crutzen, P. J., Leileveld, J., Mitra, A. P., Althausen, D., Anderson, J., Andreae, M. O., Cantrell, W., Grass, G. R., Chung, C. E., Clarke, A. D., Coakley, J. A., Collins, W. D.,
5
Conant, W. C., Dulac, F., Heintzenberg, J., Heymsfield, A. J., Holben, B., Howell, S., Hudson, J., Jayaraman, A., Kiehl, J. T., Krishnamurti, T. N., Lubin, D., McFarquhar, G., Novakov, T., Ogren, J. O., Podgorny, I. A., Prather, K., Priestley, K., Prospero, J. M., Quinn, P. K., Rajeev, K., Rasch, P., Rupert, S., Sadourny, R., Satheesh, S. K., Shaw, G. E., Sheridan, P., and Valero, F. P. J.: Indian Ocean Experiment: An integrated analysis of the climate forcing and
10
effect of the great Indo-Asian haze, J. Geophys. Res., 106, 28 371–28 398, 2001.
Rasch P. J., Collins, W. D., and Eaton, B. E.: Understanding the Indian Ocean Experiment (INDOEX) aerosol distribution with an aerosol assimilation, J. Geophys. Res., 106, 7337– 7355, 2001.
Reiner, T., Sprung, D., Jost, C., Gabriel, R., Mayol-Bracero, O. L., Andreae, M. O., Campos, T.
15
L., and Shetter, R. E.: Chemical characterization of pollution layers over the tropical Indian Ocean: Signatures of emissions from biomass and fossil fuel burning, J. Geophys. Res., 106, 28 497–28 510, 2001
de Reus, M., Krejci, R., Williams, J., Fisher, H., Schelle, R., and Str ¨om, J.: Vertical and horizon-tal distribution of the aerosol number concentration and the size distribution over the northern
20
Indian Ocean, J. Geophys. Res., 106, 28 629–28 641, 2001
Saltzman, E. S., Savoie, D. L., Zika, R. G., and Prospero, J. M.: Methane Sulfonic Acid in the Marine Atmosphere, J. Geophys. Res., 88, 10 897–10 902, 1983.
Saltzman, E. S., Yvon, S. A., and Matrai, P. A.: Low-level atmospheric sulfur dioxide measure-ment using HPLC/Fluorescence detection, J. Atmos. Chem., 17, 73–90, 1993.
25
Saxena, V. K.: Evidence of biogenic nuclei involvement in Antarctic coastal clouds. J. Phys, Chem., 87, 4130–4134, 1983
Sprung, D., Jost, C., Reiner, T., Hansel, A., and Wisthaler, A.: Acetone and acetonitril in the tropical Indian Ocean boundary layer and free troposphere: Aircraft based intercomparison of AP-CIMS and PTR-MS measurements, J. Geophys. Res., 106, 28 511–28 527, 2001
30
Stehr, J. W., Ball, W. P., Dickerson, R. R., Doddridge, B. G., Piety, C. A., and John-son, J. E.: Latitudinal gradients in O3 and CO during INDOEX 1999, J. Geophys. Res.,
ACPD
2, 2373–2411, 2002 Interhemispheric differences during INDOEX M. Norman et al. Title Page Abstract Introduction Conclusions References Tables Figures J I J I Back Close Full Screen / EscPrint Version Interactive Discussion
© EGU 2002 Tegen, I. and Fung, I.: Modeling of mineral dust in the atmosphere: Sources, transport, and
optical thickness, J. Geophys. Res., 99, 22 897–22 914, 1994.
Twomey, S. A.: Pollution and the planetary albedo, Atmos. Environ., 8, 1251–1256, 1974. Verver, G. H. L., Sikka, D. R., Lobert, J. M., Strossmeister, G., and Zachariasse, M.: Overview
of the meteorological conditions and atmospheric transport processes during INDOEX 1999,
5
J. Geophys. Res., 106, 28 399–28 413, 2001.
Wagner, V., Schiller, C., and Fisher, H.: Formaldehyde measurements in the marine boundary layer of the Indian Ocean during the 1999 INDOEX cruise of the R/V Ronald H. Brown, J. Geophys. Res., 106, 28 529–28 538, 2001
Welton, E. J., Voss, K. J., Quinn, P. K., Flatau, P. J., Markowicz, K., Campbell, J. R.,
Spin-10
hirne, J. D., Gordon, H. R., and Johnson, J. E.: Measurements of aerosol vertical pro-files and optical properties during INDOEX 1999 using micro-pulse lidars, J. Geophys. Res., doi:10.1029/2000JD000038, 2002.
Wilson, T. R. S., Salinity and major elements of seawater, In: J.P. Riley and G. Skirrow (Editors), Chemical Oceanography, 2nd ed. Academic Press, Orlando, FL, 365-413, 1975.
15
Wisthaler, A., Hansel, A., Dickerson, R. R., and Crutzen, P. J.: Organic trace gas measurements by PTR-MS during INDOEX 1999, J. Geophys. Res., doi:10.1029/2001JD000576, 2002. Yin, F., Grosjean, D., and Seinfeld, J. H.: Photooxidation of dimethyl sulfide and dimethyl
disul-fide. I: Mechanism development, J. Atmos. Chem., 11, 309–364, 1990.
ACPD
2, 2373–2411, 2002 Interhemispheric differences during INDOEX M. Norman et al. Title Page Abstract Introduction Conclusions References Tables Figures J I J I Back Close Full Screen / EscPrint Version Interactive Discussion
© EGU 2002
Table 1. Sampling periods and start and stop positions for the three cruises included in this
study. Coordinates are Male, Maldives, 4.1◦N, 73.3◦E; Port Louise, Mauritius, 20.2◦S, 57.5◦E; Panjim, India, 15.7◦N, 73.9◦E; Goa, India, 18.2◦N, 73.4◦
Start date Start position stop date stop position
Sagar Kanya 1998 Leg 1 1 Mar., DOY 60 Male 12 Mar., DOY 71 Port Louise
(SK 1998) Leg 2 15 Mar., DOY 74 Port Louise 30 Mar., DOY 89 Goa
Sagar Kanya 1999 Leg 1 21 Jan., DOY 21 Panjim 10 Feb., DOY 41 Port Louise
(SK 1999) Leg 2 18 Feb., DOY 49 Port Louise 10 Mar., DOY 69 Panjim
Ronald H Brown 1999 Leg 1 22 Feb., DOY 53 Port Louise 28 Feb., DOY 59 Male
(RB 1999) Leg 2 4 Mar., DOY 63 Male 23 Mar., DOY 82 Male
ACPD
2, 2373–2411, 2002 Interhemispheric differences during INDOEX M. Norman et al. Title Page Abstract Introduction Conclusions References Tables Figures J I J I Back Close Full Screen / EscPrint Version Interactive Discussion
© EGU 2002
Table 2. The fpm 25, 50 and 75 percentile concentrations and molar ratios for the different
trajectory groups from the Ronald H. Brown cruise in 1999. The time since last contact with land refers to any land (Tl and) for cleanN, cleanS and North ITCZ, to India (TInd) for sInd and
lInd and to other land than India (TArab) for Arab. Sea salt was calculated as the sum of Na+,
Cl−, sea salt Mg2+, sea salt K+, sea salt SO2−4 and sea salt Ca2+
MSA CI− NO−3 NA+ NH+4 Mg2+ nss-SO2−4 nss-Ca2+ nss-K+
nmol nmol nmol nmol nmol nmol nmol nmol nmol
m−3 m−3 m−3 m−3 m−3 m−3 m−3 m−3 m−3 cleanS 25 prc 0.07 0.68 <DL 1.2 0.4 0.05 2.3 0.15 <DL 50 prc 0.09 1.2 <DL 1.3 1.1 0.17 4.1 0.33 0.04 75 prc 0.12 2.5 0.08 2.5 2.3 0.43 4.8 0.87 0.08 North 25 prc 0.14 <DL 0.07 0.9 22.6 0.10 12.9 0.19 1.4 ITCZ 50 prc 0.21 0.25 0.27 1.6 35.6 0.26 23.6 0.50 3.7 75 prc 0.26 0.52 0.47 2.3 53.0 0.37 39.5 0.88 6.5 cleanN 25 prc 0.14 0.24 <DL 0.5 6.8 0.07 6.1 0.08 0.48 50 prc 0.21 0.60 0.09 1.1 22.6 0.10 11.5 0.15 1.4 75 prc 0.26 1.1 0.19 1.7 32.7 0.19 16.5 0.20 3.1 Arab 25 prc 0.13 <DL 0.19 1.1 23.5 0.17 13.1 0.39 1.2 50 prc 0.18 0.3 0.41 1.8 35.5 0.35 23.6 0.63 3.2 75 prc 0.23 0.5 0.61 2.6 48.2 0.44 30.9 1.0 4.3 sInd 25 prc 0.14 0.01 <DL 0.8 20.0 <DL 13.6 0.25 2.0 50 prc 0.22 0.18 0.10 1.6 34.7 0.18 22.6 0.32 4.3 75 prc 0.27 0.41 0.30 2.0 52.6 0.27 40.9 0.40 6.5 lInd 25 prc 0.20 <DL 0.14 1.4 49.6 0.22 34.4 0.63 4.8 50 prc 0.21 0.13 0.37 1.9 69.1 0.29 54.9 0.97 8.3 75 prc 0.25 0.55 0.48 2.2 92.6 0.30 60.8 1.1 9.3
ACPD
2, 2373–2411, 2002 Interhemispheric differences during INDOEX M. Norman et al. Title Page Abstract Introduction Conclusions References Tables Figures J I J I Back Close Full Screen / EscPrint Version Interactive Discussion
© EGU 2002
Table 2. continued
Sea Sum CI−/ MSA/ NH+4/ Ca2+/ SO2/ SO2 Number Time since
salt µg m−3 Na+ nss-SO−24 nss-SO−24 Na+ SO2−4 nmol of last contact
µg m−3 molar molar molar molar molar m−3 samples with land
ratio ratio ratio ratio ratio (h)
cleanS 0.060 0.4 0.67 0.023 0.2 0.11 0.36 1.3 14 >170 0.081 0.5 0.97 0.029 0.3 0.12 0.44 1.6 >170 0.162 0.6 1.03 0.034 0.5 0.59 0.56 2.1 >170 North 0.036 1.7 0.00 0.006 1.3 0.22 0.02 0.7 92 76 ITCZ 0.059 3.2 0.13 0.008 1.4 0.34 0.05 1.1 120 0.085 5.0 0.33 0.012 1.7 0.51 0.08 1.5 >170 cleanN 0.030 1.0 0.40 0.012 1.1 0.08 0.05 0.7 18 >170 0.054 1.6 0.58 0.019 1.5 0.16 0.10 0.9 >170 0.094 2.3 0.77 0.028 2.0 0.25 0.33 1.5 >170 Arab 0.033 1.9 <DL 0.006 1.4 0.27 0.02 0.7 43 87 0.065 3.1 0.13 0.008 1.5 0.34 0.05 1.1 120 0.095 4.1 0.23 0.009 2.3 0.53 0.08 1.4 >170 sInd 0.035 1.8 0.04 0.006 1.1 0.20 0.03 0.5 18 72 0.053 3.0 0.13 0.008 1.3 0.26 0.04 0.6 165 0.069 5.4 0.35 0.012 1.5 0.42 0.08 1.0 >170 lInd 0.049 4.5 <DL 0.003 1.1 0.37 0.02 1.1 13 35 0.056 7.6 0.06 0.004 1.5 0.49 0.02 1.5 52 0.067 8.0 0.14 0.007 1.6 0.58 0.05 2.2 92
ACPD
2, 2373–2411, 2002 Interhemispheric differences during INDOEX M. Norman et al. Title Page Abstract Introduction Conclusions References Tables Figures J I J I Back Close Full Screen / EscPrint Version Interactive Discussion © EGU 2002 40 45 50 55 60 65 70 75 80 85 90 95 −25 −20 −15 −10 −5 0 5 10 15 20 25 30 Male Latitude Longitude Ron Brown 1999 Sagar Kanya 1998 Sagar Kanya 1999 40 45 50 55 60 65 70 75 80 85 90 95 −25 −20 −15 −10 −5 0 5 10 15 20 25 30 Male Latitude Longitude Ron Brown 1999 Sagar Kanya 1998 Sagar Kanya 1999 SK 1999, leg1 SK 1999, leg 2 SK 1998, leg 1 SK 1998, leg 2 RB 1999, leg 1 RB 1999 leg 3 RB 1999, leg 2 DOY 63− 74 RB 1999, leg 2 DOY 74−82 Panjim Port Louise
Fig. 1. Cruise tracks for the Ronald H. Brown 1999 cruise and the Sagar Kanya 1998 and 1999
ACPD
2, 2373–2411, 2002 Interhemispheric differences during INDOEX M. Norman et al. Title Page Abstract Introduction Conclusions References Tables Figures J I J I Back Close Full Screen / EscPrint Version Interactive Discussion © EGU 2002 40 50 60 70 80 90 −30 −20 −10 0 10 20 Longitude Latitude 40 50 60 70 80 90 −30 −20 −10 0 10 20 Longitude Latitude 40 50 60 70 80 90 −30 −20 −10 0 10 20 Longitude Latitude 40 50 60 70 80 90 −30 −20 −10 0 10 20 Longitude Latitude
Fig. 2. Cruise tracks and trajectories during the four ITCZ passages. (a) Sagar Kanya 1998
southwards during Leg 1 (SK 1998 south), (b) Sagar Kanya 1998 northwards during Leg 2
(SK 1998 north),(c) Sagar Kanya 1999 northwards during Leg 2 (SK 1999 north), (d) Ronald
H. Brown 1999 northwards during Leg 1 (RB 1999 north). The ITCZ was identified both by trajectories and meteorological observations on board the ships and the ITCZ is marked with double solid lines in each figure.
ACPD
2, 2373–2411, 2002 Interhemispheric differences during INDOEX M. Norman et al. Title Page Abstract Introduction Conclusions References Tables Figures J I J I Back Close Full Screen / EscPrint Version Interactive Discussion © EGU 2002 0 1 2 3 nss−SO 4 2 − 0 1 2 3 NH 4 + 0 1 2 3 4 5 nss − Ca 2+ 0 1 2 3 nss − K + −200 −15 −10 −5 0 5 10 15 20 1 2 3 4 5
Latitude relative the ITCZ
Sea salt 0 1 2 3 fpm, Sum ITCZ SK 1998 south SK 1998 north SK 1999 north RB 1999 north
Fig. 3. The concentration of the fpm aerosol during the cross ITCZ passages as a function of
latitude relative to the ITCZ. The concentrations are normalized to the median concentration north of the ITCZ for each passage. SK= Sagar Kanya and RB = Ronald H. Brown.
ACPD
2, 2373–2411, 2002 Interhemispheric differences during INDOEX M. Norman et al. Title Page Abstract Introduction Conclusions References Tables Figures J I J I Back Close Full Screen / EscPrint Version Interactive Discussion © EGU 2002 0 1 2 3 fpm, MSA SK 1998 south SK 1998 north SK 1999 north RB 1999 north 0 0.1 0.2 0.3 0.4 cpm, MSA −200 −15 −10 −5 0 5 10 15 20 0.2 0.4 0.6 0.8
Latitude relative the ITCZ
tot, MSA
ITCZ
Fig. 4. (a) The concentration of MSA during the four cross ITCZ passage. The concentrations
are normalized to the median concentration north of the ITCZ.(b) cpm MSA during the cross
ITCZ passage from Ronald. H. Brown in 1999 in nmol m−3. (c) Total MSA (fpm+ cpm) during
the cross ITCZ passage from Ronald. H. Brown in 1999 in nmol m−3. The latitude is given as a function of latitude relative to the ITCZ.