Designing New Lithium-Excess Cathode Materials from
Percolation Theory: Nanohighways in Li[subscript
x]N[subscript 2–4x/3]Sb[subscript x/3O[subscript 2]
The MIT Faculty has made this article openly available.
Please share
how this access benefits you. Your story matters.
Citation
Twu, Nancy, Xin Li, Alexander Urban, Mahalingam
Balasubramanian, Jinhyuk Lee, Lei Liu, and Gerbrand Ceder.
“ Designing New Lithium-Excess Cathode Materials from
Percolation Theory: Nanohighways in Li[subscript x]N[subscript 2–
4x/3]Sb[subscript x/3O[subscript 2].” Nano Lett. 15, no. 1 (January
14, 2015): 596–602. © 2014 American Chemical Society
As Published
http://dx.doi.org/10.1021/nl5040754
Publisher
American Chemical Society (ACS)
Version
Final published version
Citable link
http://hdl.handle.net/1721.1/101781
Terms of Use
Article is made available in accordance with the publisher's
policy and may be subject to US copyright law. Please refer to the
publisher's site for terms of use.
Designing New Lithium-Excess Cathode Materials from Percolation
Theory: Nanohighways in Li
x
Ni
2
−4x/3
Sb
x/3
O
2
Nancy Twu,
†Xin Li,
†Alexander Urban,
†Mahalingam Balasubramanian,
‡Jinhyuk Lee,
†Lei Liu,
†and Gerbrand Ceder*
,††Department of Materials Science and Engineering, Massachusetts Institute of Technology, Cambridge, Massachusetts 02139, United
States
‡X-ray Science Division, Advanced Photon Source, Argonne National Laboratory, Argonne, Illinois 60439, United States
*
S Supporting InformationABSTRACT: Increasing lithium content is shown to be a successful strategy for designing new cathode materials. In layered LixNi2−4x/3Sbx/3O2 (x = 1.00−1.15), lithium excess
improves both discharge capacity and capacity retention at 1C. Structural studies reveal a complex nanostructure pattern of Li−Sb and Ni−Sb ordering where the interface between these domains forms the correct local configuration for good lithium mobility. The <1 nm Li−Sb stripe domains and their interfaces thereby effectively act as nanohighways for lithium diffusion.
KEYWORDS: Cathode, lithium-excess, percolation, nano
T
he layered transition metal oxides (LiMO2) are well established cathode materials for lithium ion batteries,1−3 achieving high reversible capacities through extraction of lithium from the lithium layer.4 Historically, the chemical design space of these cathodes has been limited to transition metal cations resistant to migration into the lithium layer. Antisite disorder between transition metal and lithium cations, the result of transition metal migration, degrades lithium mobility due to reduced oxygen spacing around the lithium layer.5 This layer spacing, also known as the lithium slab spacing, has been shown to be the most controlling factor on lithium diffusivity and hence on practical lithium extraction capacity.4−7Antisite disorder can be present in the synthesized material or created upon severe delithiation.8−11 Thus, significant efforts have been made to design well-layered materials resistant to structural instability.12−17Several recent observations have cast doubt upon this ordering paradigm by displaying very high lithium cycling capacity, notwithstanding being almost fully cation disor-dered.18−21 Insight into the remarkable performance of materials with high disorder was given by Lee et al.18 and Urban et al.,22 who demonstrated that high capacity can be achieved even in disordered rocksalt materials if they have high enough lithium content to form percolating 0-transition metal (0-TM) diffusion channels. The diffusion channel in close-packed oxides connects one octahedral site to another octahedral site through a tetrahedral activated state.4 The 0-TM channels have no transition metals around the activated state, making them considerably less sensitive to the lithium slab spacing distance, and as a result, largely insensitive to cation disorder. Thisfinding enlarges the chemical design space
for cathodes by including transition metal ions which, due to their size or electronic structure,23are prone to migration upon lithium cycling. Consequently, new opportunities emerge to discover lithium ion battery materials with very high capacity.
To validate our understanding of compounds with 0-TM diffusion channels, we revisit a material prone to cation mixing to see if increasing lithium content improves electrochemical performance. Layered LiNi0.67Sb0.33O2 has a high discharge
voltage of 3.9 V and a theoretical capacity of 226 mAh/g but reaches only 90 mAh/g on itsfirst discharge and shows rapid capacity fade on subsequent cycles.24Ex situ X-ray diffraction suggests 10% Li/Ni mixing to occur over 10 cycles, which reduces the lithium slab spacing and explains the poor performance of the material. Both the high theoretical energy density of LiNi0.67Sb0.33O2 and its cation mixing tendencies
make LiNi0.67Sb0.33O2an ideal candidate material to explore the
effect of lithium excess and the formation of 0-TM diffusion channels.
To assess the impact of increasing lithium excess on observed capacity, we synthesized four layered LixNi2−4x/3Sbx/3O2
(LNSO) compounds containing 0−15% lithium excess (x = 1.00, 1.05, 1.10, and 1.15). In each compound, lithium excess is accommodated by adjusting the Sb/Ni ratio to keep the ions as 5+ and 2+, respectively. Hereafter, we abbreviate each
compound by the amount of excess lithium, for example, LNSO-0 is LiNi0.67Sb0.33O2and LNSO-15 is Li1.15Ni0.47Sb0.38O2.
We find that all lithium-excess LNSO compounds access a
Received: October 23, 2014 Revised: November 28, 2014 Published: December 17, 2014
Letter pubs.acs.org/NanoLett
higher fraction of theoretical capacity on discharge than their stoichiometric counterpart, consistent with our prediction from theory. We also find that increasing lithium content reduces capacity fade. Detailed structure characterization on the lithium-excess LNSO compounds reveals the existence of nanoscale 0-TM diffusion channels in the transition metal layer. We discuss how this uniquely patterned microstructure, the nanohighway, improves the electrochemical performance of the LNSO compounds and is in agreement with our understanding of 0-TM diffusion channels and percolation theory.
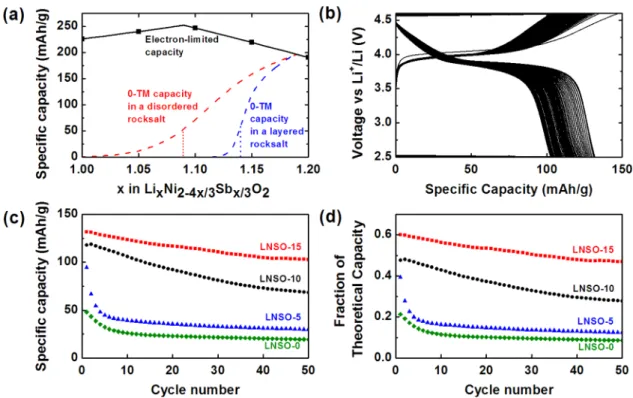
The theoretical capacity of the LNSO compounds is calculated based on the Ni2+/4+ redox couple and varies as a function of lithium excess. The solid black line in Figure 1a represents the theoretical electron-limited specific capacity of LNSO compounds, and the black squares denote the LNSO compounds studied in this work. With increasing lithium content, the fraction of high valence Sb5+ increases, and the amount of Ni2+ decreases. Although nickel is the only redox-active transition metal, its two redox couples, Ni2+/3+ and Ni3+/4+, allow for two Li+ to be extracted per nickel ion. Therefore, despite decreasing nickel content, the LNSO chemistries can incorporate excess lithium at a smaller expense
to theoretical capacity. The theoretical capacity of the LNSO compounds initially increases between 0 and 9% lithium excess as a larger amount of lithium becomes available to extract and oxidize all Ni2+to Ni4+. Above 9% lithium excess, where the Li/ Ni ratio equals 2, the theoretical capacity decreases as there is insufficient Ni redox to extract all lithium by transition metal oxidation.
The dashed lines in Figure 1a denote the calculated 0-TM theoretical capacities in an ideal disordered rocksalt structure (red line) and in an ideal layered rocksalt structure (blue line). We define 0-TM capacity as the lithium that are part of a percolating network of 0-TM diffusion channels, which should be easy to extract. 0-TM capacity increases as a function of lithium excess as an increasing number of 0-TM diffusion channels are formed. The slope of the 0-TM capacity is determined by the topology of the reference crystal structure (disordered or layered).22
The 0-TM percolation thresholds of the disordered rocksalt structure and the layered rocksalt structure are at 9 and 14% lithium excess, respectively, assuming excess lithium is distributed randomly throughout the transition metal layer. For lithium contents below these values, the corresponding
0-Figure 1.(a) Maximal capacity based on various assumptions: The electron-limited capacities of the LNSO compounds are calculated from the Ni2+/4+redox couple and peak at 9% lithium excess. The 0-TM capacities in the disordered rocksalt and layered rocksalt structures are calculated as the amount of Li in the 0-TM percolating pathway. The dotted vertical lines mark the 0-TM percolation thresholds in these two structures, which are at x = 1.09 and 1.14, respectively. The LNSO compounds studied in this work are marked by black squares. (b) Galvanostatic cycling of LNSO-15 at 1C between 2.5−4.6 V. (c) Discharge capacity of the LNSO compounds over 50 cycles at 1C between 2.5−4.6 V. (d) Fraction of theoretical capacity achieved on discharge for the LNSO compounds over 50 cycles at 1C between 2.5−4.6 V. LNSO-15 not only shows the highest discharge capacities but also accesses the highest fraction of its theoretical capacity.
Table 1. Lattice Parameters, Lithium Slab Spacing, and Cation Mixing Levels of Pristine LixNi2−4x/3Sbx/3O2Compounds
Determined by Rietveld Refinement
x composition a (Å) c (Å) oxygen z Li slab (Å) NiLi(occ) Rwp
1.00 Li1.00Ni0.67Sb0.33O2 2.984 14.549 0.2522 2.492 0.030 14.74
1.05 Li1.05Ni0.60Sb0.35O2 2.981 14.552 0.2540 2.543 0.048 12.48 1.10 Li1.10Ni0.53Sb0.37O2 2.981 14.564 0.2575 2.646 0.054 8.35
1.15 Li1.15Ni0.47Sb0.38O2 2.983 14.568 0.2575 2.646 0.060 9.69
Nano Letters Letter
DOI: 10.1021/nl5040754 Nano Lett. 2015, 15, 596−602
TM capacity is exactly zero in a macroscopic structure. Because of finite-size effects in the numerical percolation simulations, the onset of the 0-TM curves is slightly smoothed out and begins before the percolation threshold.25Rietveld refinement shows that all LNSO compounds are synthesized in the layered rocksalt structure with slight cation mixing (Table 1). Accordingly, we expect the 0-TM percolation threshold for the LNSO compounds to be close to 14%, the threshold for a perfectly layered rocksalt, and only the LNSO-15 sample to contain percolating 0-TM channels.
To compare intrinsic electrochemical performance of all compounds as much as possible, all LNSO samples were synthesized by solid state reaction and ball milled to achieve similarfinal particle sizes of 50−100 nm, as confirmed by SEM (Supporting Information Figure S1). Full details on the synthesis and processing methods are provided in the
Supporting Information. All cells were galvanostatically cycled at the 1C currents corresponding to their respective Ni-based theoretical capacities. The charge−discharge curves for LNSO-15 are shown in Figure 1b; all other samples show similar charge plateaus at 4 V and discharge plateaus at 3.9 V. The slight change in voltage profile between the first charge and all subsequent charges may be caused by some minor structural rearrangements. Of the four LNSO compounds, LNSO-15 exhibits the best performance, achieving 131 mAh/g on first discharge and retaining 78% of its capacity over 50 cycles with negligible voltage fade.
To quantitatively compare the cyclability between the four LNSO compounds, we plot discharge capacity versus cycle number in two ways. The discharge capacities are shown as specific capacities in Figure 1c, and as fractions of theoretical capacity in Figure 1d, which is the discharge capacity
Figure 2.HRTEM of pristine LNSO-15 showing the coexistence of√3 × √3 Ni−Sb and √3 × 1 Li−Sb domains within the transition metal ab layer. In (b−d), the black crosshatch arrows label the 1/3d110streaks corresponding to the√3 × √3 ordering, while the red striped arrows label the set of 1/2d110spots. (a) HRTEM along the [1−10] zone axis. The inset shows the intensity line profile along the direction of the white arrow for one projected ab layer. The HRTEM image is enlarged in the bottom of the inset, where 3d and 2d label the tripling or doubling of the d110spacing. (b) Fourier transform of the region inside the dashed square in (a). (c) Fourier transform of the region inside the solid square in (a). (d) Electron diffraction pattern of the particle. (e) Enlarged view of √3 × √3 ordered regions showing random interlayer stacking.
normalized by each LNSO compound’s theoretical capacity. Figure 1c and Figure 1d clearly show that with increasing lithium content, we achieve both higher specific capacities and higher fractions of theoretical capacity on discharge. The greatly improved performance of LNSO-15 is expected, as 15% lithium excess exceeds the calculated 0-TM percolation threshold of 14%. Surprisingly, however, LNSO-10 also shows significant improvement over LNSO-0 although its lithium excess level is below the calculated 0-TM percolation threshold. These unexpected results suggest that further understanding of 0-TM percolation is necessary. To elucidate the origins of the enhanced electrochemical performance of the lithium-excess LNSO compounds, detailed structure characterization was completed using transmission electron microscopy (TEM), X-ray diffraction (XRD), density functional theory (DFT), and extended X-ray absorption fine structure (EXAFS). We focus the structural discussion in this work on LNSO-15, as it shows the best electrochemical performance among the LNSO compounds.
Figure 2a shows the high-resolution transmission electron microscopy (HRTEM) image of pristine LNSO-15 along the [1−10] zone axis. Within a single particle, two domains with different superstructures are present. To distinguish the two domains, we look at the Fourier transform (FT) of two different regions marked by the dashed square and solid square in Figure 2a. The FT of regions inside the dashed square is shown in Figure 2b. The black crosshatch arrows identify the 1/3d110streaks corresponding to a single domain of√3 × √3
ordering. The streaks are due to different types of stacking between transition metal layers within the domain, as shown in Figure 2e, an enlargement of the HRTEM image. The√3 × √3 ordering, also known as honeycomb ordering, occurs in LNSO-0 as well as other mixed-transition metal com-pounds.24,26−29 The local charge is naturally balanced in LNSO-0 by filling two of the sublattices in the √3 × √3 superstructure with Ni2+and one with Sb5+.
Having identified 0 to be one domain within a LNSO-15 particle, we consider the ordering and composition of the second domain. The simplest way for the remaining Li+ and
Sb5+cations to balance the local charge is to order in a√3 × 1 Li−Sb stripe. Schematics of the two types of ordering are shown in Figure 3a and b. The superposition of the√3 × √3 and√3 × 1 orderings is present only in some regions of the LNSO-15 particle, such as inside the solid square in Figure 2a. The FT of regions inside the solid square is shown in Figure 2c. Again, black crosshatch arrows point to 1/3d110 streaks
corresponding to √3 × √3 Ni−Sb ordering. Additionally, red striped arrows mark 1/2d110 spots, spaced ∼3 Å apart, corresponding to √3 × 1 Li−Sb ordering. The electron diffraction pattern of the whole particle (Figure 2d) also shows the coexistance of the two domains.
The√3 × 1 Li−Sb stripe ordering previously has not been observed as a bulk phase, though it is equivalent to the Li-vacancy pattern in Li0.5CoO2.
29,30
In LNSO-15, the √3 × 1 Li−Sb stripe is observed to be mostly one or two periods wide, corresponding to widths of approximately 3 and 6 Å, respectively. The widest observed stripe is three periods wide, forming a < 1 nm interface. The insert in Figure 2a contains the intensity line scan taken along the white arrow in Figure 2a and shows the√3 × 1 ordering (marked as 2d) embedded in a region with√3 × √3 ordering (marked as 3d). Note that close to the boundary between the two types of orderings, some lattice spacings are neither 3d nor 2d (unlabeled spacing in the
inset), which may be a buffer zone needed to connect the two ordered domains.
Superstructure peaks in synchrotron XRD further confirms the presence of both domains in the high lithium-excess LNSO compounds. The strong XRD peaks in all four pristine LNSO compounds can be indexed to the layered structure with R3̅m symmetry (Supporting Information Figure S2). The weak superstructure peaks between 19 and 34° 2θ (Supporting Information Figure S2 inserts) derive from ordering in the transition metal layer. In LNSO-0, the five strong super-structure peaks between 19 and 34° 2θ all arise from √3 × √3 ordering, which is the only ordering present in LNSO-0.31In LNSO-5, these five peaks are also all present but are much weaker in intensity. For LNSO-10 and LNSO-15, in addition to thefive weak √3 × √3 peaks, there are two additional peaks at 21.3 and 30.4° 2θ that are marked by black arrows in the insets of Supporting Information Figure S2c,d. These peaks have d-spacings of 4.2 and 2.94 Å, respectively, which correspond to doubled spacings of the (104) and (−108) planes in the √3 × 1 domain. The hkl planes are defined based on a conventional R3̅m unit cell. The peak at 30.4° 2θ corresponding to a d-spacing of 2.94 Å agrees with TEM observations of∼3 Å d110 spacing in the√3 × 1 stripe domain.
The observed structure with √3 × √3 domains separated by√3 × 1 stripes is further supported by DFT calculations. Without input from XRD and TEM, we computed the energies of 108 different orderings for four lithium-excess LNSO compositions. The lithium excess levels of 9, 12.5, 20, and 28.6% were selected to minimize the size of the unit cell used in
Figure 3.Two types of orderings coexist in the transition metal layer of lithium-excess LNSO compounds,√3 × √3 and √3 × 1. (a) √3 × √3 honeycomb ordering between Ni2+and Sb5+. (b)√3 × 1 stripe ordering between Li+ and Sb5+. (c) Schematic illustration showing coexistance of the two types of ordering and 0-TM diffusion channels at the domain interfaces. For clarity, the projected position of LiLiis only shown in the interface of regions of both domains.
Nano Letters Letter
DOI: 10.1021/nl5040754 Nano Lett. 2015, 15, 596−602
the calculations. All symmetrically distinct orderings with up to 11 formula units (44 atoms) were considered.
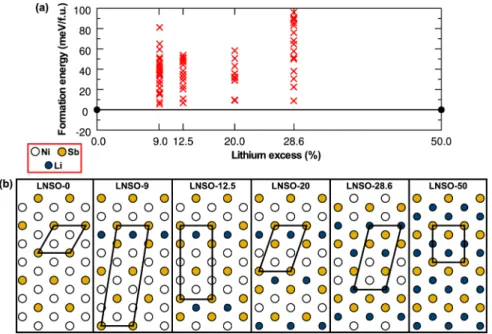
Figure 4a shows the convex hull of formation energies on the composition line between LiNi2/3Sb1/3O2 (LNSO-0) and Li(Li1/2Sb1/2)O2 (LNSO-50). Each computed ordering is
represented by a red cross. Although the 0-K formation energy of all intermediate compositions is positive, the lowest energy orderings are just 3−10 meV per formula unit above the convex hull. Hence, the driving force for phase separation is small, and several factors that favor intermediate ordering, such as entropy and lattice parameter constraints from a common matrix, are likely to stabilize the intermediate orderings.
Figure 4b shows the cation ordering within the transition metal layer for each of the lowest energy computed structures with the unit cell for each composition outlined in black. Cations are denoted by blue (Li+), white (Ni2+), and orange (Sb5+) circles. LNSO-9, LNSO-12.5, and LNSO-20 contain
domains of √3 × √3 Ni−Sb honeycomb ordering separated by a single period of √3 × 1 Li−Sb stripe ordering. With increasing lithium content, the Li−Sb stripe occurs more frequently. At the highest computed lithium-excess composi-tion of LNSO-28.6, the ordering becomes inverted, for example, Li−Sb orders in the √3 × √3 honeycomb pattern and Ni−Sb orders in the √3 × 1 stripe pattern.
Of the computed structures, LNSO-12.5 is closest in composition to LNSO-15. The computed structure confirms the structure model observed by TEM: regions of √3 × √3 ordering of Ni−Sb are separated by stripes of Li−Sb. Furthermore, DFT supports the TEM observations of narrow <1 nm Li−Sb stripes. For the LNSO-20 composition, we calculated energies of three unit cells assuming different widths of the √3 × 1 Li−Sb stripe. As shown in Supporting Information Figure S3, increasing the width of the Li−Sb stripe from one period to two or three periods was found to increase to the energy of the structure by 20 and 26 meV per formula unit, respectively. The increase in energy with increasing stripe
width implies that narrower stripe domains of Li−Sb are preferred and may be stabilized by interfacial energy.
As discussed up to this point, TEM, XRD, and DFT results all support our proposed structure model for the lithium-excess LNSO compounds. For further validation, Sb and Ni K-edge EXAFS data were collected for LNSO-15, specifically to look for evidence of the Li−Sb √3 × 1 stripe domain. In contrast to the√3 × √3 domain, a key local feature of this stripe domain is the presence of a short-ranged Sb−Sb correlation. TEM and XRD studies suggest that such a correlation might be present around ∼3 Å. Initial fits of EXAFS data to identify a Sb−Sb correlation at∼3 Å were unsuccessful. However, inspection of the structure of the √3 × 1 stripe generated from the DFT computation suggested a distribution of distances with a larger, averaged Sb−Sb distance closer to ∼3.1 Å (Supporting Information Figure S4). Using this DFT-computed structure as input and explicitly including a Sb−Sb correlation at the larger∼3.1 Å provided much improved fits. In particular, there is a clear improvement in the visual quality of thefits, as well as improvements in the R-factor by a factor of ∼2 and in the reduced-chi-square (χγ2) by∼30%.32Structural parameters are reported in Supporting Information Table S1, raw EXAFS data showing excellent signal quality is shown in Supporting Information Figure S5, and the fits are plotted in Supporting Information Figure S6.
Allowing for the presence of local distortions, the EXAFS results are consistent with the coexistance of two ordered domains in the lithium-excess LNSO compounds. TEM, XRD, and DFT all show a∼3 Å interplanar spacing for the √3 × 1 domain. The ∼3.1 Å interatomic distance between Sb ions, deduced from EXAFS data, can be accommodated well if the Sb ions are offset from the ideal site positions inside two neighboring Sb stripes with ∼3 Å interplanar spacing. The site offsets may be due to the nanointerface nature of the √3 × 1 domain.
Having built a structure model for the lithium-excess LNSO compounds, we now describe how 0-TM diffusion channels
Figure 4.(a) Convex hull of formation energies for LNSO compositions with different lithium excess contents. The stable end points LiNi2/3Sb1/3O2 (LNSO-0) and Li(Li1/2Sb1/2)O2(LNSO-50) are indicated withfilled black circles. Red crosses mark metastable and unstable configurations. (b) Sketch of the lowest-energy cation orderings in the LNSO transition metal plane for the four intermediate compostions with unit cells outlined in black.
percolate in these materials. As mentioned above, two coexisting nanoscale domains were observed in the 10 and 15% lithium-excess LNSO compounds. The significance of this two-domain microstructure is many-fold. The 0-TM diffusion channels form at the interface of these two domains on the nanoscale and provide low diffusion barrier pathways for the lithium, effectively serving as nanohighways for lithium diffusion. Lithium now only needs to diffuse from inside the √3 × √3 domains to the interface with the √3 × 1 domain, where it can join the percolating 0-TM path.
The segregated microstructure also lowers the threshold for 0-TM percolation. The two-domain microstructure allows for percolation to be achieved through interconnected nanohigh-ways rather than homogeneous percolation through the bulk. Figure 3c shows a schematic of the interface between the√3 × √3 domain and the √3 × 1 domain. Because TEM and DFT suggest that the Li−Sb stripe domain only forms as <1 nm stripes, increasing lithium is not incorporated as wider√3 × 1 Li−Sb domains, but as a larger number of <1 nm stripes. Beyond a certain lithium excess level, these stripes form a percolating network of 0-TM diffusion channels. In general, percolation is achieved at lower volume fractions when the aspect ratio of the percolating object becomes larger.33,34 Hence, such nanohighway microstructuring is an effective way to achieve percolation of 0-TM diffusion channels, even at low lithium excess concentrations.
In conclusion, a new family of cathode materials, the lithium-excess LixNi2−4x/3Sbx/3O2 compounds, were designed from
percolation theory, synthesized, and tested for electrochemical activity for thefirst time. We hypothesized that excess lithium would improve electrochemical performance through increased percolation of 0-TM diffusion channels. In agreement with theory, we found increasing lithium content to improve both capacity and cyclability with the best performing compound, LNSO-15, achieving 132 mAh/g at 1C at a discharge voltage of 3.9 V. While further work is needed to understand phenomena that limit capacity and further engineer these materials, the improvement of electrochemical performance with increasing lithium content validates our materials design strategy.
Through a combination of TEM, XRD, DFT, and EXAFS, we solved the structure of the new lithium excess LNSO compounds. Additional lithium is incorporated in lithium excess LNSO compounds as <1 nm √3 × 1 Li−Sb stripes subdividing √3 × √3 Ni−Sb domains. The 0-TM diffusion channels form at the interface of the two domains, acting as nanohighways for lithium diffusion. The lithium excess LNSO compounds show that 0-TM percolation is possible at lower lithium excess levels through patterned, low-dimensional, lithium-rich domains. Additionally, because 0-TM percolation is achieved without disordering materials, we maintain the advantage of high and fairly flat voltage in layered materials. This work extends upon our previous understanding of 0-TM diffusion channels in disordered materials, demonstrating that 0-TM percolation can be achieved in ordered materials, and laying the foundation for future cathode materials design.
■
ASSOCIATED CONTENT*
S Supporting InformationExperimental procedures and characterization methods, SEM, synchrotron XRD, Li−Sb domain width energies, computed Sb−Sb nearest neighbor distances, raw EXAFS, EXAFS structural parameters, and EXAFSfits. This material is available free of charge via the Internet at http://pubs.acs.org.
■
AUTHOR INFORMATIONCorresponding Author
*E-mail: [email protected].
Author Contributions
N.T. and X.L. contributed equally to this work.
Notes
The authors declare no competingfinancial interest.
■
ACKNOWLEDGMENTSThis work was supported by Robert Bosch Corporation and Umicore. This work made use of MRSEC Shared Experimental Facilities at MIT, supported by the National Science Foundation under award# DMR-08-19762. Research at sector 20-BM at the Advanced Photon Source was supported by U.S. DOE under Contract No. DE-AC02-06CH11357. Computa-tional resources from the NaComputa-tional Energy Research Scientific Computing Center (NERSC) and from the Extreme Science and Engineering Discovery Environment (XSEDE) are grate-fully acknowledged.
■
REFERENCES(1) Whittingham, M. S. Chem. Rev. 2004, 104, 4271−4301. (2) Goodenough, J. B. J. Power Sources 2007, 174, 996−1000. (3) Mizushima, K.; Jones, P. C.; Wiseman, P. J.; Goodenough, J. B. Mater. Res. Bull. 1980, 15, 783−789.
(4) Van der Ven, A.; Ceder, G. J. Power Sources 2001, 97−98, 529− 531.
(5) Kang, K.; Ceder, G. Phys. Rev. B 2006, 74, 094105.
(6) Van der Ven, A.; Bhattacharya, J.; Belak, A. A. Acc. Chem. Res. 2013, 46, 1216−1225.
(7) Peres, J. P.; Delmas, C.; Rougier, A.; Broussely, M.; Perton, F.; Biensan, P.; Willmann, P. J. Phys. Chem. Solids 1996, 57, 1057−1060. (8) Yu, H.; Qian, Y.; Otani, M.; Tang, D.; Guo, S.; Zhu, Y.; Zhou, H. Energy Environ. Sci. 2014, 7, 1068−1078.
(9) Breger, J.; Meng, Y. S.; Hinuma, Y.; Kumar, S.; Kang, K.; Shao-horn, Y.; Ceder, G.; Grey, C. P. Chem. Mater. 2006, 18, 4768−4781. (10) Rougier, A.; Gravereau, P.; Delmas, C. J. Electrochem. Soc. 1996, 143, 1168−1175.
(11) Fell, C. R.; Carroll, K. J.; Chi, M.; Meng, Y. S. J. Electrochem. Soc. 2010, 157, A1202−A1211.
(12) Ohzuku, T.; Makimura, Y. Chem. Lett. 2001, 744−745. (13) Kang, K.; Meng, Y. S.; Breger, J.; Grey, C. P.; Ceder, G. Science 2006, 311, 977−980.
(14) Zhang, X.; Jiang, W.; Mauger, A.; Qilu; Gendron, F.; Julien, C. J. Power Sources 2010, 195, 1292−1301.
(15) Xiao, J.; Chernova, N. A.; Whittingham, M. S. Chem. Mater. 2008, 20, 7454−7464.
(16) Shizuka, K.; Kobayashi, T.; Okahara, K.; Okamoto, K.; Kanzaki, S.; Kanno, R. J. Power Sources 2005, 146, 589−593.
(17) Ohzuku, T.; Makimura, Y. Chem. Lett. 2001, 642−643. (18) Lee, J.; Urban, A.; Li, X.; Su, D.; Hautier, G.; Ceder, G. Science 2014, 343, 519−22.
(19) Yabuuchi, N.; Takeuchi, M.; Endo, D.; Ozaki, T.; Inamasu, T.; Son, J.-Y.; Cui, Y.-T.; Oji, H.; Komaba, S. Meet. Abstr. 2013, MA2013− 02, 874.
(20) Pralong, V.; Gopal, V.; Caignaert, V.; Duffort, V.; Raveau, B. Chem. Mater. 2012, 24, 12−14.
(21) Pralong, V.; Venkatesh, G.; Malo, S.; Caignaert, V.; Baies, R.; Raveau, B. Inorg. Chem. 2014, 53, 522−527.
(22) Urban, A.; Lee, J.; Ceder, G. Adv. Energy Mater. 2014, 1400478. (23) Reed, J.; Ceder, G. Chem. Rev. 2004, 104, 4513−34.
(24) Ma, X.; Kang, K.; Ceder, G.; Meng, Y. S. J. Power Sources 2007, 173, 550−555.
(25) Binder, K.; Heermann, D. Monte Carlo Simulation in Statistical Physics: An Introduction; Graduate Texts in Physics; Springer-Verlag: Berlin, 2010.
Nano Letters Letter
DOI: 10.1021/nl5040754 Nano Lett. 2015, 15, 596−602
(26) Bréger, J.; Dupré, N.; Chupas, P. J.; Lee, P. L.; Proffen, T.; Parise, J. B.; Grey, C. P. J. Am. Chem. Soc. 2005, 127, 7529−7537.
(27) Yuan, D.; Liang, X.; Wu, L.; Cao, Y.; Ai, X.; Feng, J.; Yang, H. Adv. Mater. 2014, 26, 6301−6306.
(28) Boulineau, A.; Croguennec, L.; Delmas, C.; Weill, F. Chem. Mater. 2009, 21, 4216−4222.
(29) Ceder, G.; Van der Ven, A. Electrochim. Acta 1999, 45, 131− 150.
(30) Reimers, J. N.; Dahn, J. R. J. Electrochem. Soc. 1992, 139, 2091− 2097.
(31) Zvereva, E. A.; Evstigneeva, M. A.; Nalbandyan, V. B.; Savelieva, O. A.; Ibragimov, S. A.; Volkova, O. S.; Medvedeva, L. I.; Vasiliev, A. N.; Klingeler, R.; Buechner, B. Dalton Trans. 2012, 41, 572−80.
(32) Stern, E. A.; Newville, M.; Ravel, B.; Yacoby, Y.; Haskel, D. Phys. B 1995, 208&209, 117−120.
(33) Garboczi, E. J.; Snyder, K. A.; Douglas, J. F. Phys. Rev. E 1995, 52, 819−828.
(34) Li, J.; Ma, P. C.; Chow, W. S.; To, C. K.; Tang, B. Z.; Kim, J.-K. Adv. Funct. Mater. 2007, 17, 3207−3215.