Publisher’s version / Version de l'éditeur:
Vous avez des questions? Nous pouvons vous aider. Pour communiquer directement avec un auteur, consultez la Questions? Contact the NRC Publications Archive team at
[email protected]. If you wish to email the authors directly, please see the first page of the publication for their contact information.
https://publications-cnrc.canada.ca/fra/droits
L’accès à ce site Web et l’utilisation de son contenu sont assujettis aux conditions présentées dans le site LISEZ CES CONDITIONS ATTENTIVEMENT AVANT D’UTILISER CE SITE WEB.
Progress in Quantitative Nondestructive Evaluation 29 [Proceedings], 2009-11-08
READ THESE TERMS AND CONDITIONS CAREFULLY BEFORE USING THIS WEBSITE. https://nrc-publications.canada.ca/eng/copyright
NRC Publications Archive Record / Notice des Archives des publications du CNRC :
https://nrc-publications.canada.ca/eng/view/object/?id=255a0dab-cf63-4d61-8401-12ad64f5d6b9 https://publications-cnrc.canada.ca/fra/voir/objet/?id=255a0dab-cf63-4d61-8401-12ad64f5d6b9
NRC Publications Archive
Archives des publications du CNRC
This publication could be one of several versions: author’s original, accepted manuscript or the publisher’s version. / La version de cette publication peut être l’une des suivantes : la version prépublication de l’auteur, la version acceptée du manuscrit ou la version de l’éditeur.
Access and use of this website and the material on it are subject to the Terms and Conditions set forth at
Laser induced shock waves for composites adhesive bond testing
Perton, Mathieu; Gu, Zhuowei; Krüger, Silvio; Blouin, Alain; Lévesque,
Daniel; Monchalin, Jean-Pierre; Johnston, Andrew; Boustie, Michel; Berthe,
Laurent; Arrigoni, Michel
LASER INDUCED SHOCK WAVES FOR COMPOSITES ADHESIVE
BOND TESTING
Z. Gu1, M. Perton1, S.E. Kruger1, A. Blouin1, D. Lévesque1, J.-P. Monchalin1, A. Johnston2, M. Boustie3, L. Berthe4, and M. Arrigoni5
1
Industrial Materials Institute, National Research Council of Canada, Boucherville, QC, Canada
2Institute for Aerospace Research, National Research Council of Canada, Ottawa, ON, Canada
3Laboratoire de Combustion et de Détonique, CNRS, ENSMA, 86961 Chasseneuil Cedex, France
4Laboratoire d'Application des Lasers de Puissance, 94114 Arcueil Cedex, France 5ENSIETA LBMS, 29806 Brest Cedex 9, France
ABSTRACT. A method based on shock waves produced by a pulsed laser is applied to the evaluation of bond strength of composite plates joined by an adhesive layer. A laser shock wave can cause a delamination when it propagates through the adhesive/plate interface. Different laser pulse energies can be used to evaluate this adhesion strength. A good bond will be unaffected by a certain level of shock wave stress whereas a weaker one will be damaged. The method is made quantitative and in-situ by optically measuring the sample surface velocity with an interferometer. The signals give a signature of well-bonded and disbonded interfaces, and are used to obtain an estimate of the bond strength. Results show that the proposed test is able to differentiate bond quality. Also, laser-ultrasonic measurements made on shocked samples confirmed that weak bonds are revealed by the laser shock wave method.
Keywords: Laser ultrasonics, Shock waves, Adhesion testing, Carbon fiber composites
PACS: 62.50.Ef, 68.35.Np, 43.25.Cb, 81.70.Cv
INTRODUCTION
Adhesive bonding of structural components presents many practical advantages when compared to other joining methods. It allows making lighter structures, for example, by bonding several small parts in a large structure, which is economically advantageous compared to co-curing. A benefit of particular interest for composite parts used in primary structures is the elimination of fasteners and the associated drilled holes. However, its application for such critical components is still limited by the absence of reliable nondestructive methods that can ensure the integrity of the joint.
Laser shock generation and spallation have been studied for the measurement of the bond strength between a thin planar coating on a substrate [1-6], between carbon fibers and their matrix [7], and more recently between cells and bio-materials [8]. For these
measurements, a high energy pulsed laser is used to generate a high magnitude compression pulse which propagates through the sample. Upon reaching the free back surface, this pulse is reflected as a tensile pulse that can pry off the coating or fibres. Recent work addresses the problem of adhesive bonding of thicker structures made of carbon-epoxy composite [9]. In contrast with thin coating, laser shock waves do not induce spallation, but only delaminations. One advantage of the laser shock wave technique is to provide a local measurement without mechanical contact. Another advantage over destructive methods is insensitivity to specimen geometry, small surface roughness, the shear stress ratio, and even the process involved in the crack growth. The laser shock method can be seen as a proof test since the evaluation is non-intrusive and nondestructive if the bond is good. This raises the possibility of very fast, in-line testing.
In this paper, the laser shock wave technique is adapted to the evaluation of bond strength of composite plates joined by an adhesive layer. Induced disbonds are not necessarily visible but can be easily detected by conventional ultrasonics or laser-ultrasonic inspection. Adhesion strength is probed by increasing the laser pulse energy step by step. A “good” joint would be unaffected under a given stress level whereas a weaker one, e.g. a kissing bond, would be damaged. In the following, the principles of bond strength evaluation will be detailed with the application to a bonded joint comprising composite plates made of carbon fibers embedded in epoxy and joined by an adhesive layer. The method is made quantitative and in-situ by optically measuring the sample surface velocity with an interferometer. The interferometer signals give signatures of well-bonded and diswell-bonded interfaces and are used to obtain an estimate of the bond strength. Results show that the proposed test is able to differentiate bond quality. Also, laser-ultrasonic measurements made prior to and after laser shocks confirmed that weak bonds are revealed by the laser shock wave method.
PRINCIPLE AND EXPERIMENTAL APPROACH
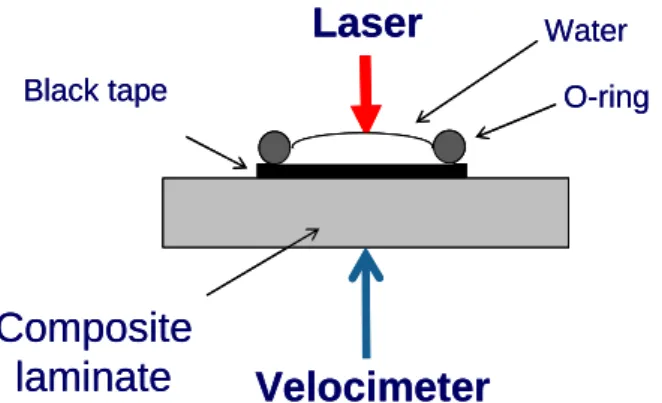
A powerful Q-Switched Nd:YAG laser which delivers optical pulses of about 8 ns and a maximum energy of about 2 J at 1064 nm wavelength is used to induce shock waves in the composite plates. The laser beam is focused to a spot diameter of about 3 mm. To avoid surface damage and to increase the efficiency of optical-to-mechanical transduction [5, 10], the surface of the material is first covered with an absorbing tape and then with a constraining medium, transparent to the laser wavelength, as illustrated in Figure 1. For optical absorption, black electrical tape has shown to be an efficient option and is widely available. For the constraining medium, a water layer was used. The waves generated under confinement produce high-amplitude particle displacement compared to direct ablation.
Using high laser energy, it is possible to reach the regime of strong shock propagation, or at least elastic-plastic wave propagation. However with our laser, the pressure level was found to be below the Hugoniot Elastic Limit, so that wave propagation is in a weak or elastic shock regime in which the waves still travel at the regular sound velocity [11]. The shock wave source size (roughly the laser spot size) is a few times larger than the sample thickness, with the result that the waves propagating through the material are mostly compressive, and are reflected by the back surface of the plate, or at the interfaces, as release waves turning into tensile waves when crossing other rarefaction waves. Only the tensile loading produced by the tensile waves is used here to induce failure at the adhesive bonded interfaces.
Laser
Black tapeComposite
laminate
Water O-ringVelocimeter
Laser
Black tapeComposite
laminate
Water O-ringVelocimeter
Figure 1. Setup for highly efficient shock generation and no damage to the surface: black tape and water.
Figure 2 shows a diagram of the evolution of a shock wave generated at the top surface with a time duration T, propagating through the thickness of a homogeneous plate and finally reflected by the free back surface. Since total reflection occurs at the back surface, the pressure due to the incoming compression wave is balanced by the reflected tensile wave when superimposed. If attenuation mechanisms are neglected, for a typical shock pulse shape the maximum tensile stress begins at a distance from the back surface given by C0T/2, where C0 is the shock wave propagation velocity, and this tensile wave
propagates unchanged until the next reflection. Ideally for testing adhesion strength, the maximum tensile stress should occur at the bonded interface.
To help understanding and quantitatively evaluate the stresses inside a sample, an optical velocimeter based on a Fabry-Perot interferometer was developed and used to monitor the backwall surface velocity u (see Figure 1). A detailed description of the interferometer can be found in reference [12]. Under the assumptions of 1D propagation, in a homogeneous material, no attenuation and an adiabatic process, the relationship at any instant t between the particle velocity signal and the stress or pressure P(z,t) at a depth z inside the plate is approximate by [13]:
( )
, 1 0(
(
/ 0) (
/ 0)
)
2P z t = ρC u t−z C −u t+z C (1)
where ρ is the material density.
Figure 2. Time-space diagram of the propagation of a shock wave pulse with duration T. Red and blue areas represent respectively the compression wave (pressure superior to the average pressure) and the tensile wave (pressure inferior to the average pressure). Dash and full lines are used for decrease and increase of pressure, respectively.
sample thickness z ti m e maximum tensile wave amplitude T
RESULTS FOR ADHESIVELY BONDED CARBON FIBER COMPOSITES
The purpose of this study is to measure the bond strength between two plates of carbon fiber composite materials joined by an adhesive layer. The plates are obtained after curing a stack of 4 or 8 carbon fiber plies pre-impregnated with a thermoset polymer (epoxy). The thicknesses of the 4- and 8-ply are 0.72 mm and 1.35 mm respectively and the sample in-plane dimensions are 50 mm x 50 mm. The orientation of the plies is [0/90]S and [0/45/90/-45]S for the 4- and 8-ply plates, respectively. Two different adhesives were used to bond the composite plates: the adhesive film: Cytec FM73 which ensures a controlled and uniform bonding, and the adhesive paste Hysol® EA9394 which was intended to create a weaker non-uniform bond. Since the epoxy and adhesive are brittle at high strain rate, the interfaces are the locations where the damage threshold is lower. In what follows, we consider that a good bond between the plates is as strong as the bond between the plies. For this reason, the measurement of the strength between the carbon fiber plies is first presented, and then followed by the measurement of the bond strength for joined composite plates.
Composite plate only
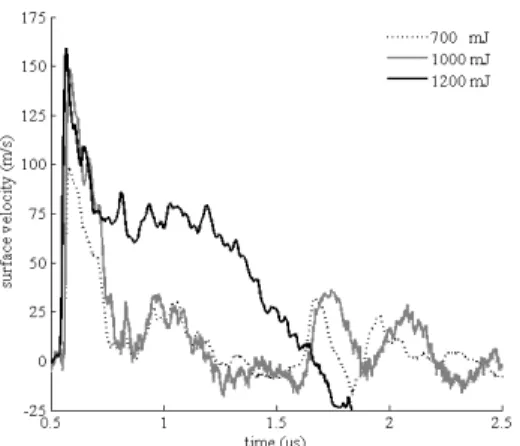
The first set of tests was performed in a single composite plate to determine the inter-ply damage threshold and to develop a better understanding of weak shock wave propagation and damage mechanisms within composite materials. The energy of the laser pulse was increased from a value well below the damage threshold to values much above. Single shot measurements were made at different locations on the sample. Figure 3 shows the back surface velocity signal as a function of time for different laser pulse energies. The sharp peak at about 0.58 µs corresponds to the arrival of the first compression wave followed by a reduction of the velocity due to rarefaction. The shape of the velocity signals obtained with laser energies of 700 and 1000 mJ are almost identical when normalized in amplitude with the maximum. This indicates that the shock regime is weak or elastic and that compression waves do not modify the material properties. As expected also under a weak shock regime, the shock velocity C0 is equal to the elastic velocity. Generation and propagation of the high amplitude waves is in fact non invasive since the elastic limit for the carbon fiber is well above the rupture threshold of the epoxy and that the epoxy rupture itself is brittle at high strain rate, without any prior plastic deformation. The signal obtained at 1200 mJ has a distinct signature because the tensile shockwave is above the damage threshold. The threshold was reached at a laser power density of 1.42 GW/cm2.
Figure 3. Back surface velocity signals measured for different laser shock pulse energies in the composite plate.
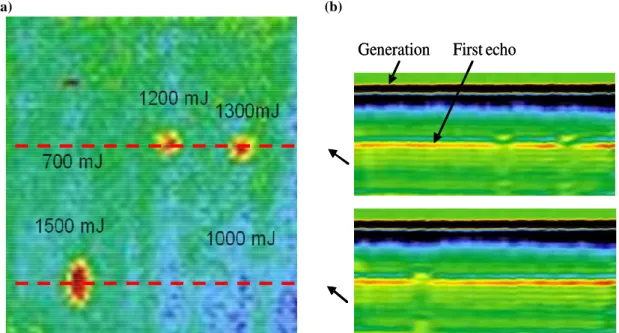
Figure 4 shows the laser-ultrasonic C- and B-scans image obtained on a single 8-ply composite plate after laser shock. The identified damage consists of delamination of the last ply next to the back surface of the sample, as shown in the B-scans of Figure 4b. This is confirmed by the microfocus X-ray computer tomography image shown in Figure 5. From Figure 3, it is seen that the instant t0at which the delamination signature appears on
the velocity signal is not the instant at which delaminations occur; there is in fact a delay equal to the travel time z/C0 of the wave reflected by the delamination from that
delamination to the back surface. The delaminated ply actually has moved for 0.5 µs at a velocity of 75 m/s for the case of 1200 mJ. The velocity then decreases since the ply is not entirely detached from the plate, the delaminated area being restrained by its edges. The small oscillations seen between 0.75 µs and 1.5 µs correspond to reverberations of the elastic waves inside the free delaminated ply. In the absence of delamination, a second clear arrival is observed at 1.75 µs corresponding to the back and forth propagation of the longitudinal wave inside the entire plate. The amplitude of this echo is smaller than the first, mainly due to viscoelastic attenuation. Also in Figure 3, the full width at half maximum (FWHM) of the first peak is about 160 ns, which is a little bit larger than the back and forth travel time inside one ply, so that the maximum amplitude of tensile stress is located close to the first interface and decreases slowly with depth. The time duration of the first peak observed at the back surface is not equal to the initial load duration because of reflections between plies and attenuation of high frequencies during propagation.
(a) (b)
Generation First echo Generation First echo
Figure 4. Laser-ultrasonic inspection of the plate after laser shock for different laser pulse energies. (a) C-scan image and (b) two B-scans from selected regions indicated by the red dashed lines in the C-scan.
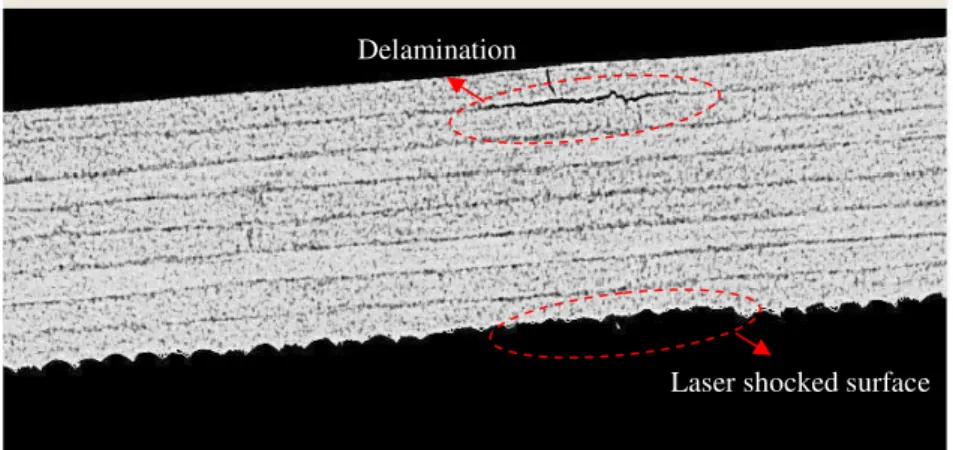
Figure 5. Micro-focus X-ray computer tomography image of the damaged section of the composite plate. The velocity signals in Figure 3 can also be used to evaluate the damage threshold of the material. The depth where disbonds occur is measured to be about 190 µm, which corresponds to the sum of 170 µm for the carbon-epoxy ply and 20 µm for a thin epoxy layer on the free surface. The wave propagation velocities are about 2680 m/s and 2200 m/s respectively for the carbon-epoxy layer and the epoxy layer, and the mass densities are 1.60 g/cm3 and 1.26 g/cm3. Equation (1) is used with an effective propagation velocity and the quantity z/C0 is approximated to be about 72 ns. Using the particle velocity variation of
u(t0 - 2z/C0 ) -u(t0) = 140 m/s leads to a damage threshold of about 350 MPa, which is
much higher than that measured in static conditions for this material, as expected [14]. It should be noted, however, that multiple reflections and attenuation are neglected in this simple model.
Well-bonded composite plates
The same experimental procedure as above was applied to a stack of two composite plates, consisting of a 4-ply plate on top of an 8-ply plate, bonded with the adhesive film Cytec FM73. The recorded velocity signals show that the high frequencies of the incoming wave are attenuated, primarily in the adhesive film. The shape of the acoustic pulse is smoother with a FWHM of about 200 ns. Consequently, there is almost no tensile stress in the last ply and the maximum tensile stress occurs about halfway through the second ply from the bottom. Figure 6 shows the laser-ultrasonic inspection results for this sample after laser shocks of different energies. As indicated on the B-scan in Figure 6b, all the delaminations observed on the C-scan are found to take place at the second interface, i.e. between the second and third plies from the back surface. For energy lower than 1J, no disbond was observed, either between plies or at the interface between the plates. Although attenuation and diffraction for such a stack of plies may play an important role, it is evident that the bond between the two plates is roughly as good as the bond between plies (or possibly better), which is considered a good bond.
Laser shocked surface Delamination
(a) (b) 0 ,2 4 s 1 ,5 4 s bond line Delaminations 0 ,2 4 s 1 ,5 4 s bond line Delaminations
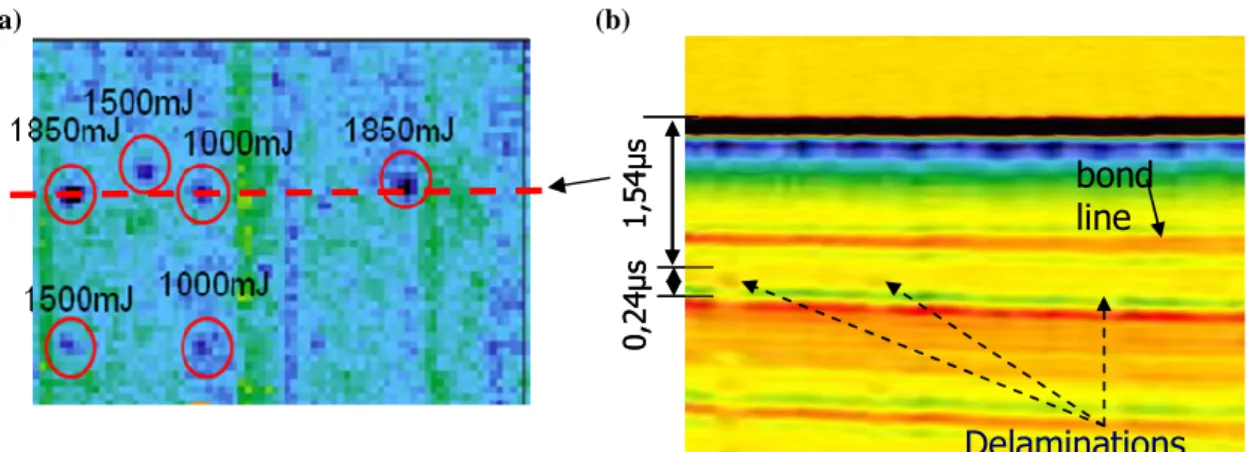
Figure 6. Laser-ultrasonic inspection of the originally well bonded sample after laser shock of different energies: (a) C-scan and (b) B-scan along the red-dashed line in (a).
Weakly bonded composite plates
Finally, a composite sample with a weak bond between two 8-ply plates was tested. The weak bond was obtained using the adhesive paste Hysol® EA9394 without taking special care for surface preparation, other than ethanol cleaning. The average thickness of the applied adhesive was about 200 µm. Figure 7 shows the laser-ultrasonic results before and after laser shock pulses of different energies. The C-scan in Figure 7a obtained before laser shock shows the presence of unbound areas in yellow and red colors. The circles indicate the positions where shocks took place. After laser shock, the C-scan in Figure 7b reveals disbonds between the two plates as indicated in the B-scan in Figure 7c. The particle velocity variation is given by u(t0 - 2z/C0 ) -u(t0) = 79 m/s, where z = 1.35 µm and
C0 = 2630 m/s. According to equation (1) the bond strength is evaluated as about 170
MPa, approximately half of the bond strength between plies.
(a) (b) (c) 1000mJ 1200 mJ 900 mJ 900 mJ 1000mJ 1200 mJ 900 mJ 900 mJ 1000mJ 1200 mJ 900 mJ 900 mJ
Figure 7. Laser-ultrasonic inspection of the weakly bonded sample: (a) scan before laser shock, (b) C-scan after laser shock, and (c) corresponding B-C-scan along the red-dashed line in (b).
CONCLUSIONS
A method based on high-intensity laser shock waves combined with laser-ultrasonic inspection has been used to test the bond strengths between carbon fibre composite samples. The bond strength between carbon-epoxy plies was taken as the reference and all bonds which have a strength equal or greater than this reference were identified as “good”. First, two well-bonded composite plates were tested with the technique and the bond was found to be equal or stronger than the one between the plies. Samples of two weakly bonded composite plates were tested and the technique was able to evaluate the bond strength between the plates. The encouraging results of this testing approach may support broader adoption of adhesive bonding throughout the aerospace industry including use for joining primary aircraft structures.
ACKNOWLEDGEMENTS
The authors would like to thank Martin Lord for his assistance in instrumentation for all aspects of this project. This work has been realized with the support of CNRS (France) and CNRC (Canada) through the Joint Research Program SATAC.
REFERENCES
1. J. L. Vossen, ASTMM Spec. Tech. Publ., 640, pp. 122-131 (1978).
2. V. Gupta , A.S. Argon, J.A. Cornie, and D.M. Parks, Mater. Sci. Eng A126, pp. 105– 117 (1990).
3. J. Yuan, V. Gupta, J. Appl. Phys. 74, pp. 2388-2397 (1993). 4. V. Gupta, J. Yuan, J. Appl. Phys. 74, pp. 2397-2404 (1993).
5. J. Yuan, V. Gupta, A. Porin, J. Appl. Phys. 74, pp. 2405-2410 (1993).
6. L. Davison, D. E. Grady, M. Shahinpoor, High-Pressure Shock Compression of Solids II, Springer-Verlag, New York (1996).
7. A. Yu, V. Gupta, Comp. Sci. and Tech., 58, pp. 1827-1837 (1998).
8. J. Shim, E. Hagerman, B. Wu and V. Gupta, Acta Biomaterialia, 4, pp. 1657-1668 (2008).
9. R. Bossi, K. Housen, C. T. Walters and D. Sokol, Materials Evaluation, 67, pp. 819-827 (2009).
10.R. Fabbro, J. Fournier P. Ballard, D. Devaux and J. Virmont, J. Appl. Phys. 68, pp. 775–781 (1990).
11.J.R. Asay, M. Shahinpoor, High-Pressure Shock Compression of Solids, Springer-Verlag, New York 1993.
12.M. Arrigoni, J.-P. Monchalin, A. Blouin, S. E. Kruger and M. Lord, Meas. Sci. Technol. 20, 015302 (7pp) (2009).
13.S.A. Novikov, I.I. Divnov and A.G. Ivanov, Phys. Metals Metallogr. (USSR) 21, pp. 608-615 (1966).