HAL Id: hal-00593691
https://hal.archives-ouvertes.fr/hal-00593691
Submitted on 16 Jun 2017
HAL is a multi-disciplinary open access
archive for the deposit and dissemination of
sci-entific research documents, whether they are
pub-lished or not. The documents may come from
teaching and research institutions in France or
abroad, or from public or private research centers.
L’archive ouverte pluridisciplinaire HAL, est
destinée au dépôt et à la diffusion de documents
scientifiques de niveau recherche, publiés ou non,
émanant des établissements d’enseignement et de
recherche français ou étrangers, des laboratoires
publics ou privés.
tropical upper troposphere: the role of clouds and the
nucleation mechanism
R. Weigel, S. Borrmann, J. Kazil, A. Minikin, A. Stohl, J. C. Wilson, J. M.
Reeves, D. Kunkel, M. de Reus, W. Frey, et al.
To cite this version:
R. Weigel, S. Borrmann, J. Kazil, A. Minikin, A. Stohl, et al.. In situ observations of new
parti-cle formation in the tropical upper troposphere: the role of clouds and the nuparti-cleation mechanism.
Atmospheric Chemistry and Physics, European Geosciences Union, 2011, 11 (18), pp.9983-10010.
�10.5194/acp-11-9983-2011�. �hal-00593691�
www.atmos-chem-phys.net/11/9983/2011/ doi:10.5194/acp-11-9983-2011
© Author(s) 2011. CC Attribution 3.0 License.
Chemistry
and Physics
In situ observations of new particle formation in the tropical upper
troposphere: the role of clouds and the nucleation mechanism
R. Weigel1, S. Borrmann1,2, J. Kazil3,4, A. Minikin5, A. Stohl6, J. C. Wilson7, J. M. Reeves7, D. Kunkel2, M. de Reus1, W. Frey2, E. R. Lovejoy3, C. M. Volk8, S. Viciani9, F. D’Amato9, C. Schiller10, T. Peter11, H. Schlager5, F. Cairo12, K. S. Law13, G. N. Shur14, G. V. Belyaev15, and J. Curtius1,*
1Institut f¨ur Physik der Atmosph¨are, Johannes Gutenberg-Universit¨at, Mainz, Germany 2Abteilung Partikelchemie, Max-Planck-Institut f¨ur Chemie, Mainz, Germany
3Cooperative Institute for Research in Environmental Sciences (CIRES), University of Colorado, Boulder, Colorado, USA 4NOAA Earth System Research Laboratory, Boulder, Colorado, USA
5Institut f¨ur Physik der Atmosph¨are, Deutsches Zentrum f¨ur Luft- und Raumfahrt (DLR), Oberpfaffenhofen, Germany 6Norwegian Institute for Air Research (NILU), Kjeller, Norway
7Department of Engineering, University of Denver, Denver, Colorado, USA 8Institut f¨ur Atmosph¨arenphysik, Bergische Universit¨at Wuppertal, Germany 9Istituto Nazionale di Ottica, Consiglio Nazionale delle Ricerche, Firenze, Italy
10Institut f¨ur Energie- und Klimaforschung – Stratosph¨are, Forschungszentrum J¨ulich, Germany
11Institute for Atmospheric and Climate Science, Eidgen¨ossische Technische Hochschule (ETH), Z¨urich, Switzerland 12Istituto di Scienze dell’Atmosfera e del Clima ISAC-CNR, Consiglio Nazionale delle Ricerche, Italy
13UPMC Univ. Paris 06; Universit´e Versailles St-Quentin; CNRS/INSU, UMR 8190, LATMOS-IPSL, Paris, France 14Central Aerological Observatory, Dolgoprudny, Moskow Region, Russia
15MDB-Myasishchev Design Bureau, Zhukovsky-5, Moscow Region, Russia
*now at: Institut f¨ur Atmosph¨are und Umwelt, Goethe-Universit¨at, Frankfurt am Main, Germany
Received: 8 March 2011 – Published in Atmos. Chem. Phys. Discuss.: 21 March 2011 Revised: 22 September 2011 – Accepted: 22 September 2011 – Published: 29 September 2011
Abstract. New particle formation (NPF), which generates
nucleation mode aerosol, was observed in the tropical Upper Troposphere (UT) and Tropical Tropopause Layer (TTL) by in situ airborne measurements over South America (January– March 2005), Australia (November–December 2005), West Africa (August 2006) and Central America (2004–2007). Particularly intense NPF was found at the bottom of the TTL. Measurements with a set of condensation particle counters (CPCs) with different dp50 (50 % lower size detection
effi-ciency diameter or “cut-off diameter”) were conducted on board the M-55 Geophysica in the altitude range of 12.0– 20.5 km and on board the DLR Falcon-20 at up to 11.5 km al-titude. On board the NASA WB-57F size distributions were measured over Central America in the 4 to 1000 nm diam-eter range with a system of nucleation mode aerosol
spec-Correspondence to: R. Weigel
trometers. Nucleation mode particle concentrations (NNM)
were derived from these measurements which allow for iden-tifying many NPF events with NNM in the range of
thou-sands of particles per cm3. Over Australia and West Africa, we identified NPF in the outflow of tropical convection, in particular of a Mesoscale Convective System (MCS). Newly formed particles with NNM>1000 cm−3were found to
co-exist with ice cloud particles (dp>2 µm) as long as cloud
particle concentrations remained below 2 cm−3. The occur-rence of NPF within the upper troposphere and the TTL was generally confined within 340 K to 380 K potential tempera-ture, but NPF was of particular strength between 350 K and 370 K (i.e. ∼1–4 km below the cold point tropopause). Anal-yses of the aerosol volatility (at 250◦C) show that in the TTL on average 75–90 % of the particles were volatile, compared to typically only 50 % in the extra-tropical UT, indicative for the particles to mainly consist of H2SO4-H2O and possibly
organic compounds. Along two flight segments over Cen-tral and South America (24 February 2005 and 7 August
2006, at 12.5 km altitude) in cloud free air, above thin cir-rus, particularly high NNMwere observed. Recent lifting had
influenced the probed air masses, and NNM reached up to
16 000 particles cm−3 (ambient concentration). A sensitiv-ity study using an aerosol model, which includes neutral and ion induced nucleation processes, simulates NNMin
reason-able agreement with the in situ observations of clear-air NPF. Based on new, stringent multi-CPC criteria, our measure-ments corroborate the hypothesis that the tropical UT and the TTL are regions supplying freshly nucleated particles. Our findings narrow the altitude of the main source region to the bottom TTL, i.e. to the level of main tropical convection out-flow, and, by means of measurements of carbon monoxide, they indicate the importance of anthropogenic emissions in NPF. After growth and/or coalescence the nucleation mode particles may act as cloud condensation nuclei in the tropical UT, or, upon ascent into the stratosphere, contribute to main-tain the stratospheric background aerosol.
1 Introduction
Observational evidence suggests that the upper tropical tro-posphere is one of the most important source regions for the stratospheric particles in the Junge aerosol layer (Brock et al., 1995; Thomason and Peter, 2006; Borrmann et al., 2010). However, an evaluation of the different mechanisms forming new particles by Lucas and Akimoto (2006) re-vealed that qualitatively, due to the large uncertainties of pa-rameterizations, NPF was so far inadequately represented in global models. Recent studies (Yu et al., 2010; Zhang et al., 2010) suggest that uncertainties in the effectiveness of NPF mechanisms themselves may cause problems in sim-ulating global particle number densities. Nucleation mode aerosol particles form within the UT (Upper Troposphere) and in the TTL (Tropical Transition Layer) altitude region from gaseous precursors, and grow to stable and detectable sizes (e.g. >3 nm in diameter dp). This process is commonly
referred to as “new particle formation” (NPF), or previously as “nucleation event” (because of its sometimes burst-like oc-currence). Once formed, the particles are subject to micro-physical processes (e.g. coagulation, growth by condensation of water vapor and other gases, evaporation, scavenging). In the tropics, above the level of zero net radiative heating (Q = 0) and in the absence of clouds, these aerosols are trans-ported upward into the stratosphere. Strong NPF in burst-like events is thought to occur in the UT/TTL as a consequence of the oxidation of sulfur compounds, possibly aided by the oxidation of organic compounds. The aerosol population and its size distribution in the stratosphere take shape by coagu-lation, condensation of sulfuric acid and water vapor from the gas phase, and by removal from the stratosphere into the troposphere. Aerosol is removed from the stratosphere by sedimentation or isentropic transport and mixing, e.g. due to
tropopause folds (Hamill et al., 1997; Thomason and Peter, 2006) and, with particular efficiency, via the subsiding air masses in the polar winter vortex.
In situ observations of the number concentration of nu-cleation mode aerosol in the tropical upper troposphere are rare. Brock et al. (1995) identified remnants of recent NPF in tropical upper tropospheric cloud-free air by aircraft-borne in situ detection of high aerosol number concentrations and concurrent high levels of particle volatility. Lee et al. (2003) reported encounters with recent NPF events in 20 % of their samples (i.e. flight segments) between 7 and 20 km alti-tude in the tropics. The average number concentration was 1100 particles cm−3for 4 nm < dp<9 nm. One conclusion
from this study was that ion-induced NPF, i.e. a homoge-neous nucleation process driven by the abundant presence of ionized air molecules, might have been responsible for some of these NPF events. Lee et al. (2004) also found nu-cleation events inside subtropical and tropical cirrus clouds between 7 and 16 km over Florida. Evidence for previous NPF was found in 72 % of their in-cloud samples and in 56 % of the samples outside of clouds. According to Frey et al. (2011) such new particle formation events seem to oc-cur commonly inside anvils and cirrus decks of West African MCS cloud systems. Already Twohy et al. (2002) suggested that mid-latitude MCS play a particular role as a source of new particles in the UT based on in situ detection of elevated aerosol numbers (dp>25 nm) with increased levels of
parti-cle volatility. Other in situ observations of new partiparti-cle for-mation in the free troposphere originate from altitudes below 12 km (Clarke et al., 1998, 1999; Clarke and Kapustin, 2002; Weber et al., 1995, 1999; Krejci et al., 2003; Crumeyrolle et al., 2010) or above 12 km (Hermann et al., 2003; Minikin et al., 2003), but mostly below the level of zero net radiative heating (Q = 0) and, i.e. at altitudes where sinking air motion or frequent cloud formation may remove or scavenge aerosol particles before they can reach the stratosphere.
Particles found in the (tropical) upper free troposphere generally consist of sulfuric acid, water, and organic com-pounds with some fraction of non-volatile materials (e.g. Murphy et al., 1998, 2006; Curtius et al., 2001b; Heald et al., 2005; Froyd et al., 2010; Borrmann et al., 2010). The non-volatile components may be soot, mineral dust, biomass-burning residues, meteoric ablation condensates, inorganic salts, and others. However, according to recent measure-ments in the tropics by Borrmann et al. (2010) up to 50 % of the submicron aerosol particles between 370 K and 440 K potential temperature (2) contain non-volatile residuals with the implication that these are not pure H2SO4-H2O solution
droplets. Recent studies by English et al. (2011) support this by suggesting that micrometeorites dominate the aerosol properties in the stratosphere.
A major source for pure H2SO4-H2O solution droplets in
the UT/TTL is homogeneous nucleation following the oxida-tion of precursor gases like SO2, OCS, and CS2, and
emissions or of anthropogenic origin, e.g. by gaseous pol-lution material which undergoes long range transport into the TTL (Law et al., 2010). Occasionally, SO2 is directly
injected into the stratosphere from explosive volcanic erup-tions (Wilson et al., 1993; Vernier et al., 2011). SO2
ap-pears in the boundary layer in mixing ratios ranging from 20 pptv to more than 1 ppbv. In urban, highly polluted envi-ronments, SO2mixing ratios of up to several hundred ppbv
can be reached (Seinfeld and Pandis, 2006). Boundary layer SO2can be rapidly transported to the UT via deep convection
(Thornton et al., 1997), when ingested by a cumulonimbus cloud (Cb). Although SO2will be scavenged and dissolved
by cloud hydrometeors, owing to its moderate solubility, a fraction of 40–90 % is able to reach the Cb anvil or the out-flow region according to cloud-resolving model calculations (Barth et al., 2001). This is in reasonable agreement with es-timates by Crutzen and Lawrence (2000). Another study (Ek-mann et al., 2006) provided model calculations, according to which only 30 % of SO2reaches the top of a cloud. However,
Crutzen and Lawrence (2000) and Barth et al. (2001) showed the removal strength of a soluble gas (such as SO2)by cloud
elements to be controlled by the cloud acidity. Arnold et al. (1997) measured SO2mixing ratios in the extra-tropical
UT reaching up to ∼1 ppb.
Recent studies (e.g. Metzger et al., 2010; Kerminen et al., 2010) have argued that, in addition to sulfuric acid, or-ganic molecules are likely involved in particle nucleation and growth. Although these studies focused on conditions in the lower troposphere, given the abundance of organic species that was found in UT/TTL aerosols (Murphy et al., 2006), it is conceivable that organic compounds are also involved in NPF occurring in the UT/TTL.
With respect to the physico-chemical processes underly-ing NPF from the gas phase several mechanisms have been under consideration. These are: (1) binary homogeneous nu-cleation of sulfuric acid and water (Weber et al., 1999), (2) ternary nucleation of sulfuric acid, water, and a third sub-stance like ammonia (Merikanto et al., 2007) or an organic compound (Zhang et al., 2004; Ekman et al., 2008; Metzger et al., 2010; Kulmala et al., 2006; Kerminen et al., 2010), (3) ion-induced nucleation of H2SO4-H2O clusters (Lovejoy
et al., 2004; Curtius et al., 2006; Kazil and Lovejoy, 2004; Kazil et al., 2006, 2007; Lee et al., 2003) and (4) the ion-mediated nucleation scheme, which attempts to capture the interactions between vapors, neutral clusters, and charged species (Yu and Turco, 2001; Yu et al., 2010). Isobaric mixing of two saturated (or slightly subsaturated) air masses can result in supersaturation (e.g. with respect to H2SO4)
and enhance the NPF processes considerably (Khosrawi and Konopka, 2003). However, English et al. (2011) found that the number concentration of particles with dp>10 nm in the
UT, and aloft, is predominantly controlled by coagulation, instead of nucleation.
Initialization of nucleation by ions, which are formed by cosmic rays or by lightning discharge in the atmosphere, has been suggested to be a key mechanism for NPF (Kirkby et al., 2011). Huntrieser et al. (2002) provided evidence that NPF might be strongly connected to lightning-induced physico-chemical mechanisms in mid-latitude thunderstorms. They found elevated number concentrations of presumably newly formed particles (>30 000 particles per cm3)in the thun-derstorm outflow concurrent with increased lighting-induced NOx(=NO and NO2)concentrations over Europe.
While condensation of supersaturated gases occurs onto pre-existing aerosol particles and cloud elements, it can also contributes to the growth of neutral and charged molecular clusters that have formed from the gas phase. The growth of these molecular clusters is, however, generally hindered by a nucleation barrier (Curtius, 2006). Ions potentially act as nu-cleation cores for the attachment of supersaturated gas phase molecules by reducing the height of the nucleation barrier (Lovejoy et al., 2004; Curtius et al., 2006). Thermodynam-ically, the ion-induced NPF process is more favorable than neutral homogeneous nucleation, but the maximum amount of particles produced via the ion pathway is limited by the ion production rate. Large ions have been detected by Eichkorn et al. (2002) in the upper troposphere. First aircraft mea-surements with an air ion spectrometer in mid-latitudes were performed by Mirme et al. (2010), who found that ions play only a minor role in NPF in the free troposphere. Whether this spatially limited data set is representative for other con-ditions, regions and altitudes remains to be shown as other in-situ observations (Kanawade and Tripathi, 2006) support the importance of ions in the NPF process.
This study presents the data from in situ measurements in the tropical UT/TTL over South and Central America, Aus-tralia and West Africa performed during the TROCCINOX, SCOUT-O3and SCOUT-AMMA campaigns as well as
dur-ing several scientific missions on board the NASA WB-57F, respectively. The data are discussed concerning the occur-rence of NPF within the UT and TTL region. With this study the location, the occurrence abundance, the strength and duration of observed NPF events are analyzed. This work refines the general findings published by Borrmann et al. (2010), which are largely based on the same data sets as the one used here. Observations from two flights are discussed in detail, demonstrating several cases of recent NPF of variable strength. Studies with an aerosol nucleation model are presented for investigating the strength of NPF un-der various environmental conditions, and to investigate the simulation’s sensitivity concerning used parameters and as-sumptions. The role of SO2and pre-existing aerosol for the
nucleation process in the UT/TTL is discussed, as is the pres-ence of nucleation mode particles in ice clouds.
2 Field campaign data base and instrumentation 2.1 Campaign locations and research aircraft
In order to obtain in situ field measurements within the TTL and the tropical UT the Russian high altitude research aircraft M-55 Geophysica operated at altitudes up to 20.5 km. The DLR Falcon-20 covered the altitude range from the ground to the tropical middle troposphere reaching 11.5 km. Both aircraft were deployed:
1. during the TROCCINOX-2 field campaign (“Tropi-cal Convection, Cirrus, and Nitrogen Oxides Experi-ment”; January - March 2005, from Arac¸atuba, Brazil, at 21.1◦S, 50.4◦W; cf. Schumann, 2005; Schumann and Huntrieser, 2007; http://www.atmos-chem-phys. net/special issue82.html) and
2. during the SCOUT-O3 mission (November–December
2005, from Darwin, Australia, at 12.5◦S, 130.8◦E; cf. Vaughan et al., 2008; Brunner et al., 2009; http://www. atmos-chem-phys.net/special-issue124.html) and
3. during SCOUT-AMMA (August 2006, from Oua-gadougou, Burkina Faso, at 12.4◦S, 1.5◦W; cf. Cairo et al., 2010a; http://www.atmos-chem-phys.net/ special-issue125.html).
All field missions aimed at investigations concerning the in-fluence of tropical convection on the UT/TTL composition and its impact on the tropical stratosphere and the subtropi-cal lowermost stratosphere. During the TROCCINOX mea-surement period the local meteorology was predominantly influenced by the quasi-stationary pressure systems, the “Bo-livian high”. Frequent MCS formation over the East of South America (partly covering Argentina, Brazil, Paraguay and Uruguay) occurred and influenced the probed air masses as well as isolated thunder storms (Konopka et al., 2007). These authors analyzed the air mass transport and mixing across the TTL over Brazil. The studies of Schiller et al. (2009) describe the transport and conversion of H2O (e.g. for the
formation of H2SO4)in the TTL and the impact of this
con-version on the stratospheric water budget.
An objective of the SCOUT-O3campaign was the
charac-terization of the “Hector” storm system that develops north of Darwin, over the Tiwi Islands, nearly on a daily basis dur-ing the pre-monsoon season (Connolly et al., 2006). The top of the developing storm cell is capable of reaching altitudes of up to 20 km, which indicated that “Hector” could play an important role for the vertical transport of aerosol particles and trace gases into the TTL or into the lower stratosphere. Further information on the meteorological situation during SCOUT-O3are provided by Brunner et al. (2009).
The air masses in the TTL over West Africa, during the SCOUT-AMMA mission, were strongly influenced by the Tropical Easterly Jet (TEJ) such that the air mass transport towards the Sahelian TTL predominantly originates from the
Asian UT/LS, driven by the South Asian monsoon (Cairo et al., 2010a). Fierli et al. (2011) provides indications for lo-cal convection, formed in the Sahelian region extending from Sudan to West Africa. This local convection may have been superimposed on a mainly zonal air mass transport that pre-vailed throughout the SCOUT-AMMA mission with direct impact on the composition of the tropical UT. More stud-ies on the air masses which impact particularly the chemical composition of the trace gas and aerosol constituents in the West African TTL during SCOUT-AMMA are provided by Law et al. (2010).
The data obtained from measurements aboard the
Geo-physica which are included in the analyses of this study,
cover 5 local and 4 transfer flights from TROCCINOX, 6 local flights from SCOUT-O3 as well as 5 local flights
from SCOUT-AMMA. From the CPC measurements aboard the Falcon data of 11 local flights and 4 transfer flights from TROCCINOX as well as 8 local and 2 transfer flights from SCOUT-AMMA are analyzed. Details on the aircraft, the instrumentation, and the campaign deployments can be obtained for TROCCINOX from http://www.pa.op.dlr. de/troccinox/, for SCOUT-O3 from http://www.ozone-sec.
ch.cam.ac.uk/scout o3/ and for SCOUT-AMMA from http: //amma.igf.fuw.edu.pl/.
The NASA WB-57F was flown in a series of missions (Pre-AVE – Pre Aura Validation Experiment, AVE 0506 – Aura Validation Experiment, CR-AVE – Costa Rica Aura Validation Experiment and TC4 – Tropical Composition, Cloud and Climate Coupling) aiming at aerosol measure-ments in the UT/TTL in the tropics of South and Central America. The flights originated from Houston, (USA) and San Jose (Costa Rica). Measurements are reported which were made south of 23◦N and between 95.1◦and 78.2◦W (around Central America) in January and February 2004, in June 2005, in January and February 2006 and during August 2007. Descriptions of the aircraft payload, objectives and data for these missions can be found at www.espo.nasa.gov.
2.2 Instrumentation for submicron aerosol measurements
Two COPAS (COndensation PArticle counting Systems) were operated as dual-channel continuous-flow condensa-tion particle counters (CPCs) at altitudes between 12.0 and 20.5 km on board the Geophysica. The COPAS performance was characterized by extensive laboratory and airborne ex-periments (Curtius et al., 2005; Weigel et al., 2009). The set of CPCs installed on board the Falcon for measurements from ground level to 11.5 km altitude is described by Minikin et al. (2003), Fiebig et al. (2005), and Weinzierl et al. (2009). The smallest detectable particle size of two COPAS chan-nels were adjusted to dp50=6 and 15 nm (at 150 hPa
op-erating pressure), where dp50 denotes the particle diameter
at which particles are detected with 50 % efficiency. Cor-respondingly, the particle number concentrations resulting
from COPAS measurements are denoted as N6(for
submi-cron particles with dp>6 nm) and N15(dp>15 nm).
Gener-ally, CPC lower detection limits, as well as their maximum asymptotic counting efficiencies, were found to depend on the operating pressure (Hermann et al., 2005), which was ac-counted for in our data set according to Weigel et al. (2009). Both, the third and fourth COPAS channel were operated with a dp50 of 10 nm. One of these channels was equipped
with an aerosol pre-heater (of 250◦C) to determine the non-volatile aerosol fraction Nnv(Curtius et al., 2005; Borrmann
et al., 2010). The working fluid for all COPAS channels was FC-43, (perfluoro-tributylamine), because of its advanta-geous particle activation behavior at pressures below 200 hPa (Brock et al., 2000; Hermann et al., 2005).
Similar to the Geophysica CPCs, a CPC system on board the Falcon was operated at settings with dp50=4 nm, dp50=
10 nm and dp50=13 nm (Minikin et al., 2003). Another CPC
on board the Falcon was measuring the concentration of non-volatile particles Nnvby heating the sampled ambient air to
250◦C in a setup very similar to that on the Geophysica. The difference in the count results between two channels mea-suring with different dp50 provides in general the
concen-tration of nucleation mode particles NNM which represents
the number density of particles at sizes between about 4 and 10 nm (or 13 nm) for the CPCs on the Falcon during SCOUT-AMMA (TROCCINOX), and about 6 to 15 nm for the CO-PAS measurements. All particle concentration data in this paper are presented as number of particles per cm3of air at ambient pressure and temperature. The measurements oc-curred at a rate of 1 Hz and are provided as 15-s averages.
Due to payload limitations on the Geophysica we were not always able to operate all four COPAS channels which are pairwise integrated in two separate instrument boxes. In particular, no volatility measurements are available for the flights of 24 February 2005, and 7 August 2006. COPAS data are were rejected when the measurements were affected by aircraft exhaust plume crossing.
Results from measurements in the tropical UT/TTL re-gion near Costa Rica are also included from the University of Denver instruments NMASS (Nuclei Mode Aerosol Spec-trometer; Brock et al., 2000) and FCAS (Focused Cavity Aerosol Spectrometer; Jonsson et al., 1995). The NMASS consists of five continuous-flow condensation particle coun-ters operated in parallel at a constant system pressure of 60 hPa. The NMASS automation controls the CPC saturator-condenser temperature such that the NMASS CPCs 1 to 5 measure particle number concentrations with dp50of 5.3 nm,
8.4 nm, 15 nm, 30 nm and 53 nm respectively. FCAS analy-ses scattered light by aerosol particles revealing aerosol size distribution between 0.06 µm < dp<2 µm within 31 detector
channels (with mean 1dp/dp= 0.111). NMASS and FCAS
data which were acquired in recognized aircraft plumes and in air with relative humidity with respect to ice exceeding 95 % were excluded.
2.3 Instrumentation for cloud measurements
Some of the encountered NPF events occurred inside clouds. For their characterization the cloud particle size distributions were measured by a Forward Scattering Spectrometer Probe (modified FSSP-100, Dye and Baumgardner, 1984; De Reus et al., 2009) during TROCCINOX. During SCOUT-O3 and
-AMMA a Cloud Imaging Probe (CIP) was deployed be-sides the FSSP-100. The FSSP-100 measurement range cov-ers particle diametcov-ers from 2.7 µm to 30 µm while the CIP detects and images particles with diameter from 25 µm to 1.4 mm. The methods applied for the data reduction of the FSSP-100 and CIP measurements and the corresponding er-ror analyses are described in De Reus et al. (2009) and Frey et al. (2011).
In addition, the Multiwavelength Aerosol Scatterometer (MAS; Buontempo et al., 2006; Cairo et al., 2010b) was im-plemented on the Geophysica to detect the presence of clouds during flight. Responding to the presence of optically ac-tive particles with sizes above 0.2 µm the MAS also provides measurements of aerosol backscatter and depolarization (at 532 nm and 1064 nm wavelengths) in the immediate vicin-ity (3–10 m) of the aircraft with 5 s time resolution and 5 % accuracy.
2.4 Instrumentation for gas phase tracer species and flight parameters
Carbon dioxide (CO2)measurements with 5 s time resolution
were performed on board the Geophysica with the High Alti-tude Gas AnalyzeR (HAGAR, Riediger et al., 2000; Homan et al., 2010), which comprises a two-channel in situ gas chromatograph and a non-dispersive infrared absorption CO2
sensor (LICOR 6251). Carbon monoxide (CO) is measured by the COLD (Cryogenically Operated Laser Diode; Viciani et al., 2008) instrument with 0.25 Hz sampling rate, 1 % pre-cision, and with an accuracy of 6–9 %. The measurement of the ambient temperature was performed with the Thermo Dynamic Complex (TDC) probe with an accuracy of 0.5 K (Shur et al., 2007). Further relevant flight parameters are pro-vided by the Geophysica navigational system Unit for Con-nection with the Scientific Equipment (UCSE, Sokolov and Lepuchov, 1998).
3 Modeling tools for the case studies of new particle formation events
One goal of the case studies presented below is to provide model estimates of new particle formation rates and corre-sponding concentrations based on microphysical processes for direct comparison with the in situ measured number den-sities NNM. Therefore, MAIA (Model of Aerosols and Ions
in the Atmosphere) developed by Lovejoy et al. (2004) and Kazil et al. (2007) was applied. As input parameters for
MAIA, in situ data and estimates of SO2 mixing ratios
de-rived from FLEXPART/FLEXTRA model results were used.
3.1 FLEXPART model for emission sensitivity studies
Oxidation of SO2 to H2SO4 vapor with subsequent
nucle-ation is considered as the process driving NPF events which are described in the presented case studies. Consequently, it is important to quantify the amount of SO2which was
avail-able for oxidation in an air parcel along its trajectory until it was intercepted and sampled by the research aircraft. Esti-mates of anthropogenic SO2emission source strengths from
the EDGAR global inventory were used and the transport of air masses was simulated by means of the Lagrangian parti-cle dispersion model FLEXPART (Stohl et al., 1998, 2005). So-called retro-plumes (cf. Stohl et al., 2003) were initial-ized at short time intervals along the flight tracks of the
Geo-physica. The simulations are based on operational wind field
data from ECMWF with a horizontal resolution of 1◦ glob-ally and 0.5◦in the measurement area, and a time resolution of 3 h. Generally 60 vertical levels were considered with ad-ditional 31 for the SCOUT-AMMA flights (due to ECMWF data which were available with increased vertical resolution for the SCOUT-AMMA campaign). Each simulation con-sists of the trajectories of 40 000 air parcels that are released in the volume of air sampled by the aircraft instrumentation and tracked for 20 days backward in time. Stochastic fluctu-ations, obtained by solving Langevin equfluctu-ations, are super-imposed on the grid-scale winds to represent transport by turbulent eddies (Stohl et al., 2005). A convection scheme (Emanuel and ˇZivkovi´c-Rothman, 1999) is used to represent convective transport (Forster et al., 2007). This scheme does not resolve individual sub-grid-scale convective cells but rep-resents the overall effect of convection in grid cells where convection is diagnosed by redistributing particles stochasti-cally according to the convective mass fluxes determined by the Emanuel and Zivkoviæ-Rothman (1999) scheme.
The backward simulations yield an emission sensitivity (Stohl et al., 2005, 2006) which is proportional to the resi-dence times of the air parcels in a particular 3-D grid cell. The value of this emission sensitivity is a measure for the simulated mixing ratio in the receptor volume that a source of unit strength in the respective grid cell would produce, disre-garding loss processes. The emission sensitivity can be used to display the transport history. By multiplying the emis-sion sensitivity near the ground with an emisemis-sion flux (here, anthropogenic SO2 emissions from the EDGAR global
in-ventory), maps of source contributions are obtained, which can be used to identify pollution sources. Spatial integration of the source contributions yields the simulated mixing ratio of a passive tracer (here, of all anthropogenic SO2emissions
accumulated over the past 20 days) along the flight track.
3.2 FLEXTRA model for trajectory analyses
The box model used to describe aerosol nucleation runs on single “representative” trajectories and requires meteorolog-ical data along these trajectories as input. To produce back trajectories of single air masses from along the flight track, we used the trajectory model FLEXTRA (Stohl et al., 1995, 2001), driven with the same meteorological input data as FLEXPART. These calculations are based only on the grid-scale ECMWF winds and represent convection only to the extent resolved by the ECMWF data. Nevertheless, trajec-tories with strong ascent were found for the convectively in-fluenced flight segments of interest. We furthermore sub-jectively selected those trajectories with the strongest ascent for the MAIA calculations, assuming that they best repre-sent the overall lifting of NPF precursors into the UT/TTL, thus compensating for the fact that single trajectories cannot represent sub-grid-scale convective lifting. There was good qualitative agreement between the selected single strongly ascending trajectories calculated by the FLEXTRA and the FLEXPART model results for the corresponding flight seg-ments, both indicating transport from the boundary layer in the same region.
3.3 Physico-chemical model MAIA for neutral and ion-induced aerosol nucleation
MAIA (Lovejoy et al., 2004; Kazil et al., 2007) describes ox-idation of SO2to gaseous H2SO4, nucleation of neutral and
charged sulfuric acid-water aerosol particles, aerosol con-densational growth, and coagulation of the freshly formed aerosol particles among each other and onto pre-existing par-ticles. Nucleation is implemented in the model based on lab-oratory thermo-chemical data (Curtius et al., 2001a; Lovejoy and Curtius 2001; Froyd and Lovejoy 2003a and b; Hanson and Lovejoy, 2006) for H2SO4uptake and loss by neutral and
charged clusters with up to 2 and 5 sulfuric acid molecules, respectively. MAIA uses laboratory thermo-chemical data (Gibbs’ free energy of formation) to describe the stability (decay probability) of the smallest neutral and charged clus-ters, which is essential for the reliable description of the nucleation process. Gibbs’ free energy also gives the tem-perature dependence of the cluster stability. Hence MAIA describes neutral and charged nucleation down to the very low temperatures occurring in the upper troposphere and lower stratosphere. The thermo-chemical data for H2SO4
-H2O uptake and loss by large H2SO4-H2O aerosol particles
( 5 sulfuric acid molecules) originate from the liquid drop model and H2SO4 and H2O vapor pressures over bulk
so-lutions. This was calculated with a computer code (provided by S. L. Clegg, personal communication, 2007) which adopts experimental data from Giauque et al. (1960) and Clegg et al. (1994). The thermo-chemical data for intermediate sized particles are a smooth interpolation (cf. Kazil et al., 2007) of the data for the small (neutral clusters with 2 and charged
clusters with 5 sulfuric acid molecules) and large particles (with many more than 2 or 5 sulfuric acid molecules). The rate coefficients for sulfuric acid uptake and loss by the aerosol particles, for the coagulation of the aerosol parti-cles, and for the recombination of the negatively charged aerosol with cations are calculated with the Fuchs formula for Brownian coagulation (Fuchs, 1964) and averaged over the equilibrium H2O content probability distribution of the
aerosol. This simplification holds well in the troposphere up to UT/LS altitudes, where water is more abundant by orders of magnitude than sulfuric acid, so that the aerosol particles have ample time to equilibrate with respect to water uptake or loss before colliding with a H2SO4molecule. The
sys-tem of differential equations for the aerosol concentrations is integrated with the VODE (Variable-coefficient Ordinary Differential Equation) solver (Brown et al., 1989).
In summary, based on
1. the FLEXTRA derived estimates of temperature, rela-tive humidity, and pressure, along a backward trajectory of air mass transport,
2. estimates of available OH (which is parameterized as a cosine of the solar zenith angle, in approximation of the diurnal cycle of OH in the troposphere after Li et al., 2005; Wang et al., 2008) and of pre-existing aerosol surface area,
3. cosmic ray induced ion production rates, calculated by a model of energetic particle transport in the Earth’s at-mosphere (O’Brien, 2005), which accounts for varia-tions in cosmic ray intensity as function of latitude and altitude,
4. initial SO2mixing ratios of 50 pptv or 500 pptv,
repre-senting estimated minimum and maximum levels,
MAIA calculates the number of aerosol particles produced in a NPF event (per cubic centimeter and second) as a function of daytime along particular air parcel trajectories intersect-ing with the M-55 Geophysica flight path. The diameter size range of nucleation mode particles analyzed from the MAIA simulations coincides with the diameter size range of nucle-ation mode particles measured by COPAS.
One limitation of this approach is that as both model tools MAIA and FLEXTRA do not take into account that air masses are mixed with surrounding air. Particularly dur-ing uplift or when detrainment occurs, it is very likely that in reality the lifted air mass is diluted due to mixing with background air. One has to consider that the result of FLEX-PART calculations concerning the SO2 mixing ratio
repre-sents a maximum value because SO2removal is ignored. Air
mass mixing and resulting dilution, however, is considered by the FLEXPART model. In contrast, the single trajectories resulting from FLEXTRA and the results from MAIA simu-lations cannot reflect changes in SO2mixing ratios or aerosol
surface area concentrations due to dilution or removal pro-cesses. Thus, the MAIA simulations of this work serve as a sensitivity study.
4 Results and interpretations
4.1 Overview of the new particle formation events encountered in the tropics
4.1.1 Summary of tropical submicron particle measurements
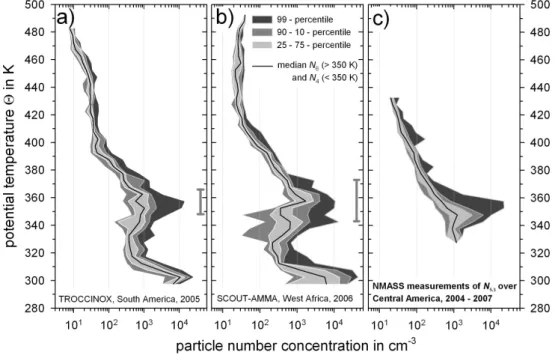
The vertical distribution of measured total submicron parti-cle number concentration data are displayed in Fig. 1 as me-dian profiles over all TROCCINOX (Fig. 1a) and SCOUT-AMMA (Fig. 1b) flights. The data include all measure-ments from the Geophysica (number concentration N6, for
2 >350 K, above ∼11 km altitude) and the Falcon (N4for
2 <350 K). The measurements indicate a high variability in particle number concentrations at 2 < 310 K (below ∼ 2 km altitude) ranging from 1000 to 40 000 particles per cm3. A minimum with typically less than 1000 particles per cm3 is observed for 310 K < 2 < 330 K (∼2–6 km) and a max-imum in the altitude range, where NPF events were de-tected most frequently and with the largest number concen-trations (350 K < 2 < 370 K, ∼11–15 km). Generally, over West Africa and between 380 K and 420 K (∼16–18 km) somewhat higher particle number concentrations were ob-served than over South America. Additionally, in Fig. 1c the vertical distribution of the particle number concentration from measurements with the University of Denver’s NMASS is shown from measurements in the tropical UT/TTL re-gion near Costa Rica. Displayed data show results from the first of five NMASS detection channels (dp50=5.3 nm).
Note that in Fig. 1a and b the TROCCINOX and SCOUT-AMMA datasets are displayed separately (distinguishing measurement locations and years) while the NMASS data set (Fig. 1c) is a composite of the measurements over 4 yr. The measurements with NMASS were performed almost at the same location in the tropics (Central America) including winter and summer seasons. However, the comparison re-veals one common feature: the altitude level which is charac-terized by highest particles number concentrations N6ranges
from 350 K (340 K, for the SCOUT-AMMA observations) to 370 K, the bottom of the TTL. The lower TTL bound-ary is located, according to the description by Fueglistaler et al. (2009), at the 355 K level where the main convective out-flow occurs. Gettelman et al. (2004) define 350 K to be the isentropic level of main deep convective outflow which is in agreement with the findings by Law et al. (2010) for the par-ticular case of the SCOUT-AMMA mission during the 2006 monsoon season over West Africa.
Fig. 1. Vertical profiles of total particle number densities (for particle diameters larger than 6 nm for 2 > 350 K and 4 nm for 2 < 350 K,
and up to ≈1 µm) for all tropical flights of the M-55 Geophysica and the DLR Falcon-20 during (a) TROCCINOX and (b) SCOUT-AMMA. Median values are shown (black line), as well as 10th, 25th, 75th, 90th, and 99th percentiles (grey-scale contours). Frequent occurrence of New Particle Formation events (99th percentiles) influences the median over South America in the 11–13.5 km altitude range and over West Africa in the 9–14 km altitude range. (c) Measurement results from the NMASS (on the NASA WB-57F) over Central America between 2004 and 2007 indicating frequent occurrence of high particle number densities (for particle diameters >5.3 nm) in the same altitude band.
4.1.2 Detection of NPF by the COPAS instrument and the DLR CPC system
The abundance of nucleation mode particles is determined by the subtraction of aerosol number concentrations measured with two CPC channels of different dp50 settings,
respec-tively. For the COPAS system this is generally NNM=N6–
N15. For the DLR CPC system NNM is obtained from the
difference between N4 and N13 (TROCCINOX) or N4 and
N10 (SCOUT-AMMA). It is important to note that in
back-ground conditions the COPAS channels with dp50=6 nm
and dp50= 15 nm show almost equal number concentrations,
within the measurement uncertainties of 15 % for each chan-nel (Weigel et al., 2009). The same is valid for the DLR CPC system within a measurement uncertainty of 10 %.
For the COPAS measurement analysis a conservative def-inition of an NPF event is used, which includes the measure-ment uncertainty of 15 % for each COPAS channel. Thus, a positive difference between N6 and N15 is only considered
to be an NPF event if 0.85 · N6–1.15 · N15>0 particles per
cm3(if ≥100 particles per cm3, the NPF event is considered to be of high intensity). At background conditions, with-out NPF, the subtraction of number concentrations that are measured by two independently operated CPCs leads to posi-tive and negaposi-tive values of NNMthat statistically vary around
zero. A similar NPF criterion was applied to the
measure-ment data from the DLR CPC system, assuming an instru-mental uncertainty of 10 %. For both instruments intention-ally a more rigorous criterion was adopted for our data analy-sis which excludes the statistical fluctuations of the counters. NPF criteria, e.g. as suggested by Lee et al. (2003), on our measurements data would lead to more frequent identifica-tion of NPF events with longer duraidentifica-tion of each event.
4.1.3 Summary of NPF event data
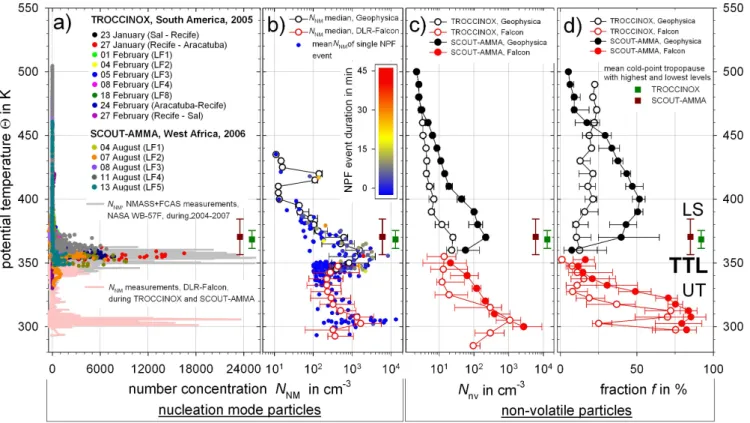
The number concentrations of nucleation mode particles NNM during TROCCINOX and SCOUT-AMMA are shown
as a function of potential temperature in Fig. 3a. Nucleation-mode particles often occurred at the bottom of the TTL. The cold point tropopause was located at 360–385 K during TROCCINOX and SCOUT-AMMA, but generally not above 385 K. Between 350 K and 370 K NNM peaks to values of
4 000 to 8 000 particles per cm3with a maximum of >16 000 particles per cm3 at 375 K which was observed during the flight on 27 January 2005. Similarly, the results for NNM
determined from measurements with the NMASS show the appearance of highest concentrations (>25 000 particles per cm3)of nucleation mode particles at altitudes below 385 K. Concentrations NNM that were measured aboard the Falcon
(Fig. 3a) indicate numerous NPF events in the range between 340 K and 350 K exceeding the COPAS measurements at this
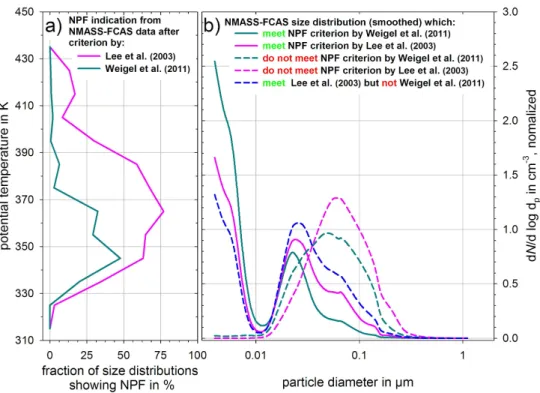
Fig. 2. Two different NPF criteria applied on NMASS-FCAS data measured on board the NASA WB-57F over Central America. (a) Fraction
of 5530 aerosol size distributions that either meet the NPF criterion according to Lee et al. (2003) or the more conservative NPF criterion of the present work (labled “Weigel et al., 2011”). (b) Mean normalized and smoothed aerosol size distributions in the altitude range 325–395 K that satisfy or not one of these criteria.
altitude range. The Falcon conducted considerably more and longer measurements at this flight level during TROC-CINOX and SCOUT-AMMA than the Geophysica (∼31 h versus ∼4 h) explaining the differences in the observations. Between 310 K and 340 K the occurrence of NPF is clearly reduced. A further distinct layer is shown by the CPC mea-surement data obtained aboard the Falcon with elevated NNM
reaching up to 23 500 particles per cm3between 300 K and 310 K, which is data from inside the boundary layer and, therefore, are not analyzed in detail here.
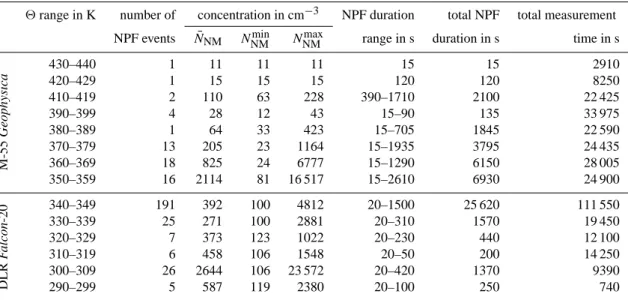
With COPAS the NPF events were observed in the TTL region during 4 transfer flight sections and during 5 out of 9 local flights over South America as well as during each of the 5 local flights over West Africa, albeit with differ-ing strength. The numbers of occurrences of NPF events throughout TROCCINOX and SCOUT-AMMA and statisti-cal parameters concerning measured NNM are summarized
in Table 1. During NPF events, applying the 15 %-criterion (negative values of NNMwere set to zero), median NNMwere
found to range between 200–900 particles per cm3 below 350 K (Fig. 3b). Between 355 K and 360 K NPF events with median NNM of more than 1000 particles per cm3were
ob-served. Additionally, the variability in this altitude range is large, ranging from 250 particles per cm3(25-percentile) up to 4000 particles per cm3(75-percentile). Above 365 K un-til 385 K the median NNM gradually decreases to 100
par-ticles per cm3. Above 385 K the frequency and strength of NPF events are reduced such that the median NNM
gener-ally remains below 50 particles per cm3. Above 400 K the median NNMdo not exceed 20 particles per cm3, apart from
the exceptional case of NPF occurrence on a flight section between Recife (Brazil) and Sal (Cape Verde) on 27 Febru-ary 2005 reaching NNM of 100–150 particles per cm3at the
415–420 K level. Moreover, this example demonstrates that elevated NNMcan also be observed at stratospheric altitudes.
Whether or not these nucleation mode particles were origi-nally formed in the stratosphere remains speculative.
In Fig. 3b also the averaged NNM determined from 68
(>350 K) and 266 (<350 K) single NPF events throughout TROCCINOX and SCOUT-AMMA are shown and color-coded according to respective duration of each event. Sum-marizing, some additional information on temporal exten-sions of the observed NPF events at specific flight levels and related to the overall measurement time at respective flight level are provided in Table 1.
On a timescale of 1–2 days after burst-like NPF events most of the nucleation mode particles either coagulate or grow by condensation. Both would mean that particles disap-pear out of the nucleation mode diameter size range. Since the NPF were encountered often it is conceivable that such events occur frequently in the tropical upper troposphere.
Fig. 3. (a) Colored circles: concentrations of nucleation mode particles, NNM, in the size range 6 nm < dp<15 nm (COPAS) of 9 tropical
flights of the M-55 “Geophysica” during TROCCINOX (4 transfer and 5 local flights) and of 5 local flights during SCOUT-AMMA. Rose colored: NNM(4 nm < dp<15 nm) from CPC measurements on the DLR Falcon-20 throughout both campaigns (2 < 350 K). Grey colored:
NNM(5.3 nm < dp<15 nm) resulting from 4 yr of measurements with the NMASS system (on the NASA WB-57F). (b) Solid lines: median
vertical distribution of NNM with 25th and 75th percentiles from COPAS measurements (black) and DLR Falcon-20 CPC measurements (red). Circles: averaged NNMof single NPF events, color-coded according to the observed event duration. (c) Median vertical profile with
25th and 75th percentiles of the number concentration (Nnv)of non-volatile particles with dp>1,0 nm. (d) Median vertical profile with 25th
and 75th percentiles of the fraction f = Nnv/N6of non-volatile particles (black: COPAS measurements; red: DLR Falcon-20 CPC data).
Squares with vertical bars: mean cold point tropopause (green: TROCCINOX; dark-red: SCOUT-AMMA) with bars denoting the highest and lowest encountered tropopause heights.
Analysis of the non-volatile particle distribution provides insight into the processes governing the budget for particle number concentration in the TTL, e.g. of aerosol transport from elsewhere versus local aerosol formation. Therefore, the measured vertical distribution of the median number con-centration for non-volatile particles Nnvis shown in Fig. 3c.
In Fig. 3d the ratio, f , of Nnvand N6(or N4for the
DLR-CPC) is displayed. The most intense events of NPF in the uppermost free troposphere and lower TTL region were en-countered within a narrow altitude band, between 350 K and 360 K. In the TTL between 360 K and 380 K nucleation mode particles were frequently found in quantities of several hun-dred up to thousands per cm3. With respect to particle volatil-ity, the altitudes between 340 K and 360 K (Fig. 3c and d) appear to contain the lowest amounts of non-volatile parti-cles. A similar minimum for f has also been observed in the TTL over Northern Australia (Borrmann et al., 2010). At those levels where nucleation mode particles were detected relatively low fractions of non-volatile particles (with f ≈10–
20 %) result. This is in agreement with the notion that freshly nucleated particles consist of solution droplets mainly con-taining substances which are entirely volatile at 250◦C.
4.1.4 Relevance for the TTL
The data indicate that the most intense NPF occurred at the bottom of the TTL (355 K to 360 K, cf. Fueglistaler et al., 2009) immediately above the main outflow region of tropical deep convection. For SCOUT-AMMA Fierli et al. (2011) showed by means of mesoscale model calculations that detrainment of convectively lifted air reached altitudes of 17 km and higher, significantly influencing the TTL over West Africa. Considering the outflow altitude range from 320 K, for shallow convection, up to 350 K, for deep convec-tion (Law et al., 2010), it can be speculated that the minima in the particle volatility parameters Nnvand f just above the
level of convective outflow are caused by previous scaveng-ing of non-volatile particles durscaveng-ing convective air mass as-cent.
Table 1. Number of occurrences of a total of 68 single NPF events observed aboard the M-55 Geophysica and of 266 single NPF events
observed aboard the DLR Falcon-20 as a function of potential temperature. The number concentration NNMis given as the arithmetic mean
together with the maximum and minimum value of NNMreached in each 2-bin. The “NPF duration” is given as range between shortest and
longest duration of an event with a total NPF duration for each 2-bin. The total measurement time reflects the residence time of the two aircraft in each 2-bin throughout the TROCCINOX and SCOUT-AMMA mission.
2range in K number of concentration in cm−3 NPF duration total NPF total measurement
NPF events N¯NM NNMmin NNMmax range in s duration in s time in s
M-55 Geophysica 430–440 1 11 11 11 15 15 2910 420–429 1 15 15 15 120 120 8250 410–419 2 110 63 228 390–1710 2100 22 425 390–399 4 28 12 43 15–90 135 33 975 380–389 1 64 33 423 15–705 1845 22 590 370–379 13 205 23 1164 15–1935 3795 24 435 360–369 18 825 24 6777 15–1290 6150 28 005 350–359 16 2114 81 16 517 15–2610 6930 24 900 DLR F alcon -20 340–349 191 392 100 4812 20–1500 25 620 111 550 330–339 25 271 100 2881 20–310 1570 19 450 320–329 7 373 123 1022 20–230 440 12 100 310–319 6 458 106 1548 20–50 200 14 250 300–309 26 2644 106 23 572 20–420 1370 9390 290–299 5 587 119 2380 20–100 250 740
Thus, is seems conceivable that large numbers of nucle-ation mode particles are found in the convective outflow re-gions because these particles where either freshly formed there or represent a remaining fraction of particles which were not removed by uptake from cloud elements. Fur-thermore, the region of tropical convective outflow is, due to in-cloud scavenging, affected by a minimum of non-volatile particles that can act as potential condensation sur-faces. Concurrently, the ambient temperatures may be low enough that NPF precursor gas concentrations are supersat-urated in the UT and lowermost TTL. Refining the original findings by Brock et al. (1995), we observe that the particles seem to be mostly produced in the lowest parts of the TTL and in the tropical UT. Fractions of these newly formed parti-cles are then amenable for being transported upward through the TTL and could reach the stratosphere (Fueglistaler et al., 2009; Borrmann et al., 2010).
The highest concentrations of nucleation mode particles NNM were found to occur within considerable spatial range
during two flights on 24 February 2005 (TROCCINOX, South America) and on 7 August 2006 (SCOUT-AMMA, West Africa). These two flights were therefore selected for detailed case studies, but also because of the strength of the observed NPF events. Moreover, the second flight allows for studying the presence of nucleation mode particles within clouds.
4.2 Case studies of three NPF events over South America and over West Africa
Three cases of NPF encounters are discussed here, one ob-served over South America (Case 1) and the other two over West Africa (Cases 2 and 3).
On 24 February 2005 (Case 1) the first post-mission trans-fer flight of the Geophysica was performed from Arac¸atuba (21◦S) to Recife (8◦S), Brazil. On this day the meteoro-logical situation over Brazil was dominated by a Bolivian high that supported the advection of air masses from the Pa-cific, passing over central Argentina in a counter-clockwise turn towards the Atlantic and northward along the Brazilian East coast. A trough was northward moving along the east-ern part of Brazil connected with isolated thunderstorms over the Amazon Basin, over North East Argentina (∼28◦S) and over the Atlantic (∼23◦S).
One local flight over West Africa (10–13◦N and 1.5– 8◦W) on 7 August 2006 (Case 2 and 3) was focused on measurements at the cloud top and in the outflow region of a dissolving intense MCS over southern Mali (Cairo et al., 2010a; Fierli et al., 2011). The flight track of the
Geophys-ica followed a direct approach towards the region above the
MCS top and the subsequent flight section allowed for mea-surements with increasing distance from the MCS. Finally, a new approach to the region above the same MCS was per-formed before the Geophysica turned back to the mission base. The level of main outflow of this MCS was located at the 353 K level according to Fierli et al. (2011). These
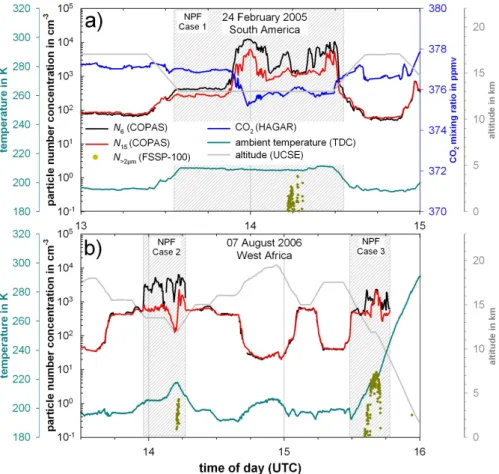
Fig. 4. Cases of increased concentration of nucleation mode particles indicating New Particle Formation (NPF – shaded areas): (a) Case 1
during the flight from Arac¸atuba to Recife, Brazil, on 24 February 2005 (TROCCINOX). (b) Cases 2 and 3 during a local flight over West Africa on 7 August 2006 (SCOUT-AMMA). The difference in particle concentrations, N6–N15, is indicative of recent NPF. Lines: grey –
flight altitude; dark cyan – ambient temperatures; blue – in situ measured CO2mixing ratio (not available for the SCOUT-AMMA flight on
7 August 2006). Green dots: flight time period inside a cirrus cloud as indicated by N>2µmmeasured by FSSP-100. Gaps in the N6time
series of (b) are caused by discarding data in case the measurements were affected by electronic noise.
authors investigate the convective uplift of air masses due to this particular MCS and find highly variable convective ages from a few up to 48 h.
4.2.1 In situ measurements from South America
During the Geophysica flight on 24 February 2005 at ∼13 km altitude large concentrations (up to 7700 particles cm−3)of nucleation mode particles were observed, indicating recent NPF (Case 1). The measured data are displayed in Fig. 4a together with other relevant variables. During Case 1, at ∼14:15 UTC, a cirrus cloud was encountered which is indi-cated by FSSP-100 measurements of increased number con-centrations (N>2µm)of particles with dp>2 µm.
The large concentrations of nucleation mode particles over South America are correlated with lower CO2concentrations
indicating a different air mass history for those air masses in which NPF occurred. It is not possible to relate the de-creased CO2 concentrations to specific sinks at ground due
to the strong variability of the various sources and sinks of
CO2, e.g. diurnal cycles, distribution of vegetation, etc. The
reduced CO2concentrations in the sampled air masses,
how-ever, are indicative for CO2 uptake by vegetation and thus,
the low CO2 concentrations also indicate that the sampled
air recently had contact with the boundary layer and most likely was carried aloft to the measurement altitudes.
4.2.2 In situ measurements from West Africa
On 07 August 2006 two pronounced NPF events with con-centrations up to 4000 particles cm−3 were observed in the
altitude range of 12 km to 14 km (cf. Fig. 4b, Case 2 and Case 3). The measurements of Case 2 were recorded during a period of level flight at ∼13.5 km followed by a descent to 12 km and re-ascent between 13:55 and 14:16 UTC. Ac-cording to measurements by MAS immediately before and after this NPF Case 2 increased backscatter and depolariza-tion were observed, indicative for having passed a field of very thin clouds.
Furthermore, NPF was observed during the descent period at 13.5 km to 12 km altitude between 15:35 and 15:40 UTC (Case 3). During Case 3 the anvil of a Mesoscale Convec-tive System (MCS) was partly crossed. The anvil contained many particles with large sizes constituting a correspond-ingly large surface area capable of scavenging newly formed nucleation mode particles. The high values of depolarization (cf. Sect. 5.4) measured by MAS indicate the presence of as-pherical particles, i.e. ice, inside the cloud.
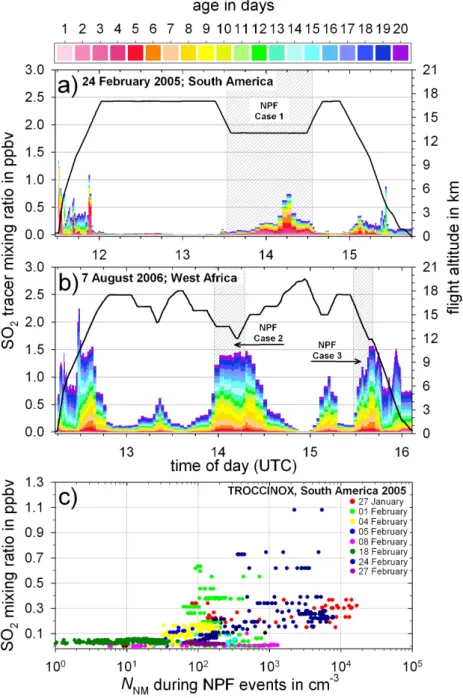
4.3 Transport model calculations and estimation of SO2
loadings
The FLEXPART results for the cases from South Amer-ica and West AfrAmer-ica are shown in Fig. 5, with superim-posed flight altitude (black line). The colored columns show SO2 tracer mixing ratios simulated by FLEXPART along
the flight track, with the colors indicating the time in days since emission of the SO2from the surface according to the
EDGAR inventory (cf. Sect. 3.1). Since SO2was carried as
a passive tracer, the mixing ratios represent the total expo-sure of the sampled air mass to SO2emissions over the last
20 days. Real SO2mixing ratios at the sampling locations
would likely have been lower because of loss processes both within the boundary layer and during uplift to the flight alti-tude.
The calculations with the FLEXPART model as presented in Fig. 5 indicate that the air parcels probed during the NPF events have contained potential maxima of SO2, i.e.
∼0.6 ppbv and ∼1.4 ppbv for the case studies of South Amer-ica and West AfrAmer-ica, respectively. The air masses were lifted to the measurement altitude within the last 4 to 7 days, ei-ther by convective or by slower, synoptic scale lifting. Both lifting processes are considered within the FLEXPART sim-ulations, nevertheless, it is impossible to quantify (i.e. by a lifting rate) respective contribution to the resulting up-lift. For the TROCCINOX case in the upper panel of Fig. 5 the highest source contributions of SO2were located along
West Brazil and Peru. For the SCOUT-AMMA study in the lower panel the SO2 source contributions were located
in East Africa and East India/South-East Asia. The latter is in qualitative agreement with the calculations by Law et al. (2010), who showed that ∼40 % of the air masses in the mid-TTL over West Africa during SCOUT-AMMA were in-fluenced by injection of lower tropospheric air from Asia and India, while Fierli et al. (2011) concluded that over Africa regional deep convection played a role as well. In Fig. 5c) the measured NNM for all NPF cases are shown versus the
predicted SO2mixing ratio along the flight track of the
Geo-physica for the TROCCINOX campaign. FLEXPART
simu-lations for SCOUT-AMMA were made only for one selected flight. When NPF was observed while SO2was predicted to
be lower than 0.1 ppbv this can still be sufficient for (moder-ate) NPF if other conditions promoting particle formation are favorable (low temperature, low condensation sink from
pre-existing particle surfaces and high relative humidity) (Kirkby et al., 2011). However, whenever FLEXPART predicted SO2
to be elevated (>0.1 ppbv) along the flight track, NPF was observed.
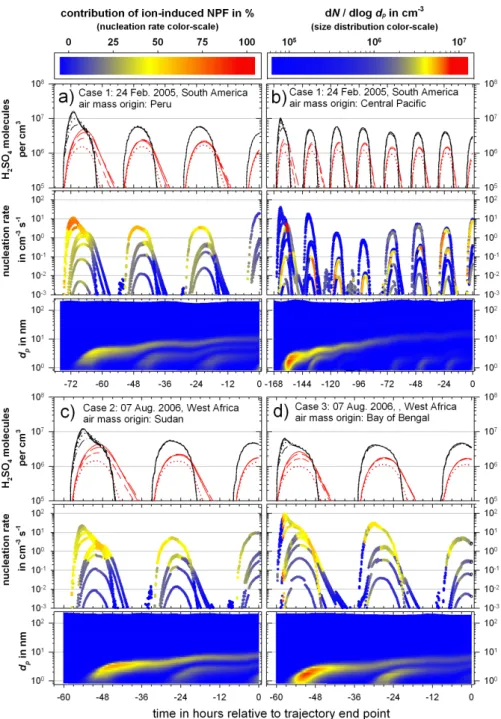
4.4 MAIA simulations of new particle formation over Brazil and West Africa
The purpose of the MAIA simulations is to investigate whether ion-induced and neutral aerosol formation from H2SO4 and H2O suffices to explain the measured
concen-trations of nucleation mode particles (NNM=N6–N15). The
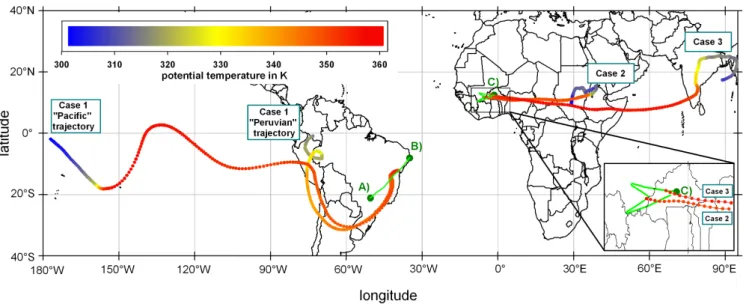
MAIA simulations (cf. Sect. 3.3; Lovejoy et al., 2004; Kazil and Lovejoy, 2004) are based on selected individual air mass trajectories as obtained from FLEXTRA (cf. Sect. 3.2; Stohl et al., 1995) which end at locations where NPF was observed by the Geophysica instrumentation. In Fig. 6 the pathway of these trajectories towards the Geophysica flight tracks are displayed over 10 days prior to the measurement and colored according to the potential temperature along respective tra-jectory in order to illustrate the air mass vertical movement.
For new particle formation observed during Case 1, two different air mass trajectories were considered. The first tra-jectory originates from the west coast of South America, i.e. Peru, and exhibits spatially extended and slow uplift towards the flight path. Most other trajectories for this NPF observa-tion (Case 1) underwent convective lifting starting over the Pacific Ocean, more than 2500 km west of South America’s coast. Due to oceanic emissions of dimethylsulfide (DMS, Charlson et al., 1987) which is oxidized to SO2, the Pacific
trajectories did not necessarily carry much less SO2
com-pared to the Peruvian trajectory. The MAIA calculations for the two SCOUT-AMMA NPF observations (Cases 2 and 3, cf. Fig. 7c and d) are based on one air mass trajectory for each case. For the Case 2 and Case 3 trajectories the FLEXTRA calculations indicated recent convective uplift. For Case 2 the air mass originated over the African continent, in Cen-tral Sudan (cf. Fig. 6) moving at low levels towards North Ethiopia and Eritrea before convective uplift occurred over North Ethiopia 4 days before sampling (cf. Fig. 7c). In the North of Ethiopia (i.e. Dabbahu rifting zone of the Nubia-Arabia Plate boundary, Afar region) a volcanically active re-gion is located (Hamling et al., 2009; Ferguson et al., 2010), and volcanic emission potentially contributed to the air mass SO2loading. As the trajectory narrowly passes also the Red
Sea coast natural SO2sources (by DMS) or, as the Red Sea
is a highly frequented route of sea going ships, a contri-bution of anthropogenic SO2 emission is conceivable.
Ac-cording to the FLEXTRA calculations for Case 3 the origin of the air masses was over the Bay of Bengal 10 days ear-lier. The trajectory describes a cyclonic turn partly cross-ing Myanmar, Bangladesh and India while continuously as-cending over land, reaching peak altitude about 4.5 days be-fore the sampling. Thus, SO2 from natural as well as
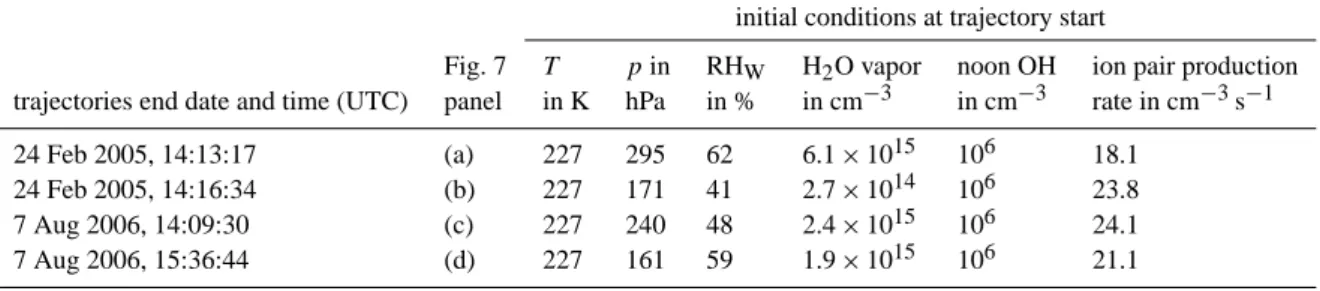
Table 2. Input parameters for MAIA model runs for calculations of the ion-induced and neutral aerosol nucleation for the case studies
displayed in Fig. 7. Values of temperature (T ), pressure (p) and relative humidity with respect to water (RHW) are given at the time the NPF
is initialized after convective uplift. Water vapor and OH are given in number of molecules per cm3of air. initial conditions at trajectory start
Fig. 7 T pin RHW H2O vapor noon OH ion pair production
trajectories end date and time (UTC) panel in K hPa in % in cm−3 in cm−3 rate in cm−3s−1
24 Feb 2005, 14:13:17 (a) 227 295 62 6.1 × 10¹⁵ 106 18.1
24 Feb 2005, 14:16:34 (b) 227 171 41 2.7 × 10¹⁴ 106 23.8
7 Aug 2006, 14:09:30 (c) 227 240 48 2.4 × 10¹⁵ 106 24.1
7 Aug 2006, 15:36:44 (d) 227 161 59 1.9 × 10¹⁵ 106 21.1
continent could have been transported into the TTL, as also indicated by Law et al. (2010) who concluded that pollution sources in Asia influence the TTL composition over Africa.
Table 2 provides a summary of the initial parameters for the MAIA runs. The values listed for water vapor, pressure, and temperature are derived from the FLEXTRA trajectories. The noon OH concentration represents the peak value in the parameterization of OH as a function of the cosine of the solar zenith angle. A zero OH concentration is assumed at nighttime. The ion pair production rate due to cosmic rays is calculated in the course of the MAIA runs (cf. Sect. 3.3). The SO2mixing ratios obtained from the FLEXPART runs likely
represent an upper limit, because the reduction of SO2 due
to air mass mixing and cloud processing are not accounted for. In previous simulations of convective clouds Ekman et al. (2006) found SO2mixing ratios in the outflow region to
be reduced to ∼30 % of initial surface values, or 62 pptm (∼28 pptv). With these comparably low SO2 mixing ratios
in the outflow region, nevertheless, Ekman et al. (2006) pre-dicted high NNMdue to NPF. Therefore, two initial SO2
mix-ing ratios of 50 and 500 pptv are used in the MAIA simula-tions (red and black lines in Fig. 7, respectively). The lower mixing ratio of 50 pptv represents a case with depletion of SO2by cloud processes. The higher mixing ratio of 500 pptv
represents a case of elevated upper tropospheric SO2.
SO2mixing ratios in polluted industrial outflow measured
in the boundary layer over the Bay of Bengal can exceed val-ues of 1.5 ppbv (Lelieveld et al., 2001). Pollution emissions of SO2from Peruvian copper smelters were observed over
10 months to release a mean daily SO2burden of 0.2–3 Gg
per day (Carn et al., 2007) and by a 6 month lasting study at a Peruvian measurement site (Marcapomacocha) a median SO2 mixing ratio was determined to range at about 3 ppbv
(Carmichael et al., 2003). Thus, even considering SO2loss
during the transport into the TTL, it is plausible that polluted air masses from Asia or Peru reach the TTL with a SO2
mix-ing ratio which differs not too much from the upper limit of estimated pre-existing SO2mixing ratio for the MAIA
sim-ulations (i.e. 500 pptv). In contrast, the SO2 loading of air
masses over East Africa (Sudan, Ethiopia and Eritrea) or over
the Pacific Ocean might be less intense, such that these air masses, when reaching the TTL, may contain significantly less SO2compared to Asian or Peruvian air masses, probably
in quantities close to the lower limit of assumed pre-existing SO2mixing ratio for the MAIA simulations (i.e. 50 pptv).
Since pre-existing surface area (in µm2per cm3of air) of the background aerosol constitutes a sink for gaseous H2SO4
and the highly mobile newly formed particles, five different simulations were performed, varying the initial aerosol sur-face area, using values of 0.5, 1, 2, 4, and 8 µm2cm−3. The maximum and minimum values for the pre-existing surface area (i.e. 0.5 and 8 µm2cm−3)were chosen with the aim to cover a representative range that is realistic and that natu-rally prevails from boundary layer up to 13–15 km altitude. These aerosol surface area densities change in the course of the runs due to growth and coagulation of the pre-existing aerosol particles. The purpose of choosing a broad range as initial assumptions for the MAIA calculations is to com-pensate for the neglected mixing and dilution processes in the simulations. The results of the simulations are shown in Fig. 7. Each panel displays the number of nucleation mode particles (N6–N15)per cm3predicted by MAIA due to
ion-induced and neutral nucleation as a function of time. At time zero the air parcel was sampled by the instrumentation on board the aircraft.
For completeness, MAIA simulations were conducted on both trajectories for the Case 1, along the Peruvian and the Pacific trajectory, respectively. For the MAIA simulations concerning the SCOUT-AMMA cases the trajectory origi-nating from East Africa (Case 2 – Fig. 7c) and the Bay of Bengal (Case Fig. 7d) are considered.
Notably, the increase of NNM predicted by MAIA starts
temporally staggered. The time that is needed for the forma-tion of molecular clusters, for their growth to stable but very small particles (1.5 nm) and for further growth until reach-ing sizes between 6–15 nm is governed by the abundance of gaseous H2SO4. Additionally, the number of formed
clus-ters and small particles influence the time that is needed for particles to grow to nucleation mode sizes.
Fig. 5. FLEXPART trajectory model simulation of SO2mixing ratio (upper envelope of colored regions) along the flight track (black line). (a) TROCCIONOX NPF event Case 1. (b) SCOUT-AMMA NPF event Cases 2 and 3. FLEXPART predicts high SO2values exactly for the
NPF events. Color code: age along trajectory since most previous SO2emission (see text for details). (c) Relation between NNMduring
NPF and predicted SO2by FLEXPART. When SO2mixing ratios were predicted to be enhanced NPF was observed.
4.4.1 Results of the MAIA simulations for the NPF events
The maximum of NPF predicted by the nucleation model ap-pears several days (e.g. up to 6.5 days, cf. Fig. 7b) before the actual measurement. The temporal evolution of NNM
strongly depends on the history of the respective trajectory, on the pre-existing aerosol surface area, and on the initial concentration of SO2. The resulting number concentration
NNM at time zero predicts the quantity of nucleation mode
particles at the location of the flight track of the Geophysica where NPF has been detected by COPAS.
The aerosol nucleation model predicts maxima of NNM
due to NPF ranging up to 30 000–40 000 particles cm−3. These values arise with 0.5 µm2cm−3of pre-existing aerosol surface area and SO2 concentrations of 500 pptv, i.e. under
maximum available SO2 and minimum background aerosol