HAL Id: hal-00458321
https://hal.archives-ouvertes.fr/hal-00458321
Submitted on 21 Dec 2015
HAL is a multi-disciplinary open access
archive for the deposit and dissemination of
sci-entific research documents, whether they are
pub-lished or not. The documents may come from
teaching and research institutions in France or
abroad, or from public or private research centers.
L’archive ouverte pluridisciplinaire HAL, est
destinée au dépôt et à la diffusion de documents
scientifiques de niveau recherche, publiés ou non,
émanant des établissements d’enseignement et de
recherche français ou étrangers, des laboratoires
publics ou privés.
layer in West Africa: in-situ observations and mesoscale
modelling
Federico Fierli, E. Orlandi, Kathy S. Law, C. Cagnazzo, F. Cairo, C. Schiller,
S. Borrmann, G. Didonfrancesco, F. Ravegnani, M. Volk
To cite this version:
Federico Fierli, E. Orlandi, Kathy S. Law, C. Cagnazzo, F. Cairo, et al.. Impact of deep convection
in the tropical tropopause layer in West Africa: in-situ observations and mesoscale modelling.
Atmo-spheric Chemistry and Physics, European Geosciences Union, 2011, 11 (1), pp.201-214.
�10.5194/acp-11-201-2011�. �hal-00458321�
Atmos. Chem. Phys., 11, 201–214, 2011 www.atmos-chem-phys.net/11/201/2011/ doi:10.5194/acp-11-201-2011
© Author(s) 2011. CC Attribution 3.0 License.
Atmospheric
Chemistry
and Physics
Impact of deep convection in the tropical tropopause layer in West
Africa: in-situ observations and mesoscale modelling
F. Fierli1, E. Orlandi1, K. S. Law2, C. Cagnazzo3, F. Cairo1, C. Schiller4, S. Borrmann5,6, G. Di Donfrancesco7, F. Ravegnani1, and C. M. Volk8
1Institute for Atmospheric Sciences and Climate, ISAC-CNR, Italy
2UPMC Univ. Paris 06; Univ. Versailles St-Quentin; CNRS/INSU, UMR 8190, LATMOS-IPSL, Paris, France 3CMCC, Bologna, Italy
4Forschungzentrum Juelich, Juelich, Germany
5Max Planck Institute for Chemistry, Particle Chemistry Department, Mainz, Germany 6Institute for Atmospheric Physics, Johannes Gutenberg University, Mainz, Germany 7ENEA, UTMEA-TER, Rome, Italy
8Department of Physics, University of Wuppertal, Wuppertal, Germany
Received: 28 December 2009 – Published in Atmos. Chem. Phys. Discuss.: 18 February 2010 Revised: 28 November 2010 – Accepted: 30 November 2010 – Published: 11 January 2011
Abstract. We present the analysis of the impact of
con-vection on the composition of the tropical tropopause layer region (TTL) in West-Africa during the AMMA-SCOUT campaign. Geophysica M55 aircraft observations of water vapor, ozone, aerosol and CO2 during August 2006 show
perturbed values at altitudes ranging from 14 km to 17 km (above the main convective outflow) and satellite data indi-cates that air detrainment is likely to have originated from convective cloud east of the flights. Simulations of the BO-LAM mesoscale model, nudged with infrared radiance tem-peratures, are used to estimate the convective impact in the upper troposphere and to assess the fraction of air processed by convection. The analysis shows that BOLAM correctly reproduces the location and the vertical structure of convec-tive outflow. Model-aided analysis indicates that convection can influence the composition of the upper troposphere above the level of main outflow for an event of deep convection close to the observation site. Model analysis also shows that deep convection occurring in the entire Sahelian transect (up to 2000 km E of the measurement area) has a non negligible role in determining TTL composition.
Correspondence to: F. Fierli ([email protected])
1 Introduction
The role of deep convection and of large scale transport in de-termining the composition of the upper troposphere region is still a question of debate. The height where convection domi-nates is an important question to answer, since it impacts sub-stantially the chemical composition, hence the radiative equi-librium in the tropical tropopause layer (TTL) (Fueglistaler et al., 2009; Corti et al., 2006).
Several studies (see for instance Folkins and Martin (2005); Fueglistaler and Fu (2006)) pointed out that TTL composition is controlled by slow upwelling driven by ra-diation, while convection determines the composition up to the lower boundary of the TTL (350 K in potential tempera-ture coordinates) through fast vertical transport. The deter-mination of the height of convective clouds and their subse-quent impact on TTL composition is difficult to achieve from satellite measurements due to the low sensitivity of observed parameters from, for example METEOSAT, at the tropical tropopause due to the limited vertical resolution of satellite-borne profilers. The information on the height where deep convection outflow occurs and modifies water vapour and trace gas distributions can be derived from in-situ observa-tions that offer an adequate vertical resolution. Several ob-servational analyses based on in-situ aircraft data show that deep convection can impact up to the tropical tropopause (Dessler, 2002). Locally, convection can overshoot up to the lower stratosphere influencing directly the water budget above the tropopause as observed during the convective sea-son in Brazil (Chaboureau et al., 2007), above the Hector
convective system in northern Australia (Corti et al., 2008), and in West Africa (Khaykin et al., 2009).
The role of convection in West Africa is still poorly known; local convection superimposes its signature on the large scale circulation that is characterized by an easterly jet that transports air in the UT-LS from the Indian Ocean where deep convection in monsoon area occurs (Barret et al., 2008). A large field campaign in the framework of AMMA (African Monsoon Multidisciplinary Analyses, Redelsperger et al. (2006)) was devoted to the study of the dynamics and chemical composition of atmosphere in West Africa (Reeves et al., 2010) and, in August 2006, a specific observational ac-tivity focused on the TTL based on the M55-Geophysica ob-servations took place (Cairo et al., 2010). The meteorological situation and phases of convective activity during 2006 wet season have been described in detail by Janicot et al. (2008). Ancellet et al. (2009) analysed the role of local convec-tion on tropospheric aircraft observaconvec-tions and concluded that convective transport played a role in governing concentra-tions of ozone and other chemical tracers during the wet sea-son up to 250 hPa in August 2006. Signatures of convection can be identified as deviations of tracer concentrations from mean profile due to rapid vertical transport from the plane-tary boundary layer; several typologies of air masses have been identified with highly variable values of CO and O3
mixing ratios depending on the emissions in the region where convection occurred and subsequent chemical processing in the upper troposphere. West Africa is characterized by the presence of potentially important and poorly known sources of aerosol and ozone precursors. Large latitudinal variabil-ity of nitrogen oxides emissions in West Africa during the wet season was observed during AMMA and is reported by Stewart et al. (2008); NOxlevels in the Sahelian area are high
leading to higher ozone mixing ratios (Saunois et al., 2009) while ozone precursors from biomass burning in the south-ern hemispheric African continent can be transported by deep convection in the upper troposphere up to 10◦N (Mari et al., 2008; Real et al., 2010).
A companion paper (Law et al. (2010) hereafter Law2010) presents the analysis of transport based on European Center for Medium Range Weather Forecast (ECMWF) data show-ing that large scale transport plays a pivotal role in deter-mining average vertical distribution of trace species in the UTLS over West Africa while local convection has a domi-nant impact up to the lower boundary of the TTL (on average 180 hPa); air masses are lifted from the troposphere in the Indian Ocean and warm pool region and then advected west-ward by the tropical easterly jet. Schiller et al. (2009) anal-ysed satellite observations coupled to a Lagrangian transport model showing that average values of water vapour in the UTLS appear to be controlled by large-scale transport. Nev-ertheless, the analysis of aircraft and balloon-borne observa-tions indicates that local convection, i.e. convection formed in the Sahelian region extending from Sudan to West Africa between 10◦N and 15◦N, are likely to be superimposed on
this zonal transport and directly influence the composition in the tropical upper troposphere above 200 hPa over West Africa and downwind. Law2010 gives some indications of large scale organised uplift estimated from trajectories based on large scale analyses, that likely underestimates the effects of local convection. Here we use a mesoscale model to in-vestigate the role of convective uplift on trace gas and aerosol concentrations over West Africa during August 2006.
The analysis is restricted to flights where there was poten-tially a strong influence from local convection and data col-lected on these specific flights are used to examine whether signatures of local deep convection can be seen in the chem-ical data. Moreover, the mesoscale simulations are used to estimate the variability in convective outflow through the use of the in-situ observations coupled to the trajectory analysis. The main aims of this study are to: (1) evaluate the capabil-ity of the model to reproduce the vertical structure of con-vective outflow and the presence of concon-vectively processed layers above 355 K and, (2) identify the extent of such layers and compare with the observed impact of convection in the upper troposphere. In this respect these approaches are com-plementary with Law2010 analysing the interplay of large-scale transport and convection and this paper examining the role of local deep convection in more detail.
2 Observations
The M55 Geophysica aircraft performed 5 local flights and 2 transfer flights in West Africa from 1 to 16 August 2006. The objective was to characterize the TTL composition un-der different regimes (local convection, background, large scale westerly flow, and long-range transport of biomass burning emissions). M55 observations show that the ther-mal tropopause was located at 375 K potential temperature level (17 km) and that TTL boundaries ranged between 350 and 420 K. Moreover observations indicates the presence of enhanced aerosol due to convection in the lowermost TTL (355 K); further details are provided in Fig. 2 of Law2010. The same paper reports the analysis of average profiles of aerosol and chemical tracers during the whole M55 cam-paign coupled to synoptic back trajectories showing that dur-ing three flights (7 August from 12:00 to 16:00 UTC, 8 Au-gust from 12:00 to 16:00 UTC and 11 AuAu-gust from 14:00 to 18:00 UTC) there was a presence of organized convec-tive systems either close to the flights or upwind over eastern and central Africa with a likely impact in the observed upper tropospheric composition. In the following subsections we present the satellite observations of deep convection and the observed vertical profiles of aerosol and chemical tracers for each one of the three selected flights.
F. Fierli et al.: Impact of deep convection in the TTL in West Africa 203
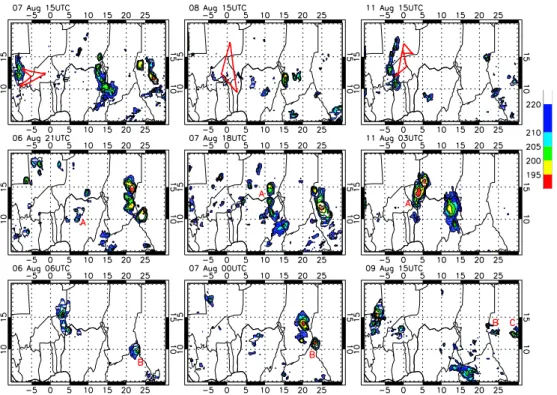
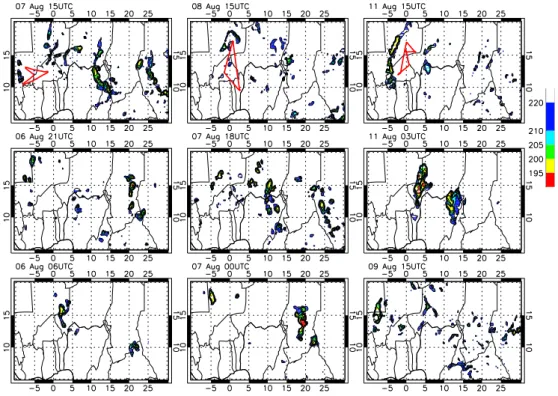
Fig. 1. METEOSAT cloud top brightness temperature time evolution prior to the M55 flight on 7 August 2006 (left panels), 8 August 2006
(central panels), and 11 August 2006 (right panels). Color scale indicates cloud top temperature expressed in K. Flight paths are shown by the red lines; red capital letters identify matches between back trajectories and deep convection as described in the text.
2.1 Satellite observations
In order to analyse the lifetime and position of Mesoscale Convective Systems (MCS) upwind and in proximity of the flight region, we use Cloud Top Brightness Temperature (CTBT) at 10.8 µm measured by the SEVIRI instrument on-board the Meteosat Second Generation satellite (MSG). Syn-optic back trajectories calculated from ECMWF data and originating from flight path are used to identify air masses likely influenced by convection. To do so, positions derived from back trajectories are matched with MSG CTBT to iden-tify MCS outflows that likely influenced M55 observations. Figure 1 shows CTBT at the time of M55 flight (top row) and at the time of matches between back trajectories and ob-served deep convection for each event (central and bottom rows). A temperature threshold (CTBT < 220 K) was ap-plied to select deep convective clouds (Schmetz et al., 1997).
2.1.1 7 August 2006
Left column in Fig. 1 shows MSG CTBT on 6 August at 06:00 UTC, at 21:00 UTC and on 7 August at 15:00 UTC. Back trajectory matches with an MCS located in northern Nigeria the evening of 6 August, i.e. 18 h prior to the flight (labeled as A in Fig. 1, left column central panel) with min-imum CTBT ranging between 205 and 210 K. A second match is observed 33 h prior to the flight with an MCS in
South Chad (B, Fig. 1 left column, bottom panel) with mini-mum CTBT below 200 K. Moreover, the western part of the flight (indicated with the red line in Fig. 1, top panel) was close to a dissolving intense MCS in Southern Mali.
2.1.2 8 August 2006
Central column in Fig. 1 shows the MSG CTBT on 7 Au-gust at 00:00 UTC, 7 AuAu-gust at 18:00 UTC and on 8 AuAu-gust at 15:00 UTC. Back trajectory matches with a squall line be-tween northern Nigeria and Niger late afternoon of 7 August, i.e. 21 h prior to the flight (labeled as A in Fig. 1, central col-umn middle panel) with minimum CTBT ranging between 195 and 200 K. A second match with an MCS in South Chad is observed 39 h prior to the flight (B, Fig. 1 central column, bottom panel) with minimum CTBT below 195 K. Sparse convective activity with CTBT higher than 210 K is observed simultaneously to the flight.
2.1.3 11 August 2006
Right column in Fig. 1 shows the MSG CTBT on 9 August at 15:00 UTC, 11 August at 03:00 UTC and on 11 August at 15:00 UTC. The flight was carried out in the outflow of a vast MCS observed above western Niger 12 h prior to the flight with CTBT lower than 195 K (labeled as A in Fig. 1, right column middle panel). The MCS propagated westward and
was observed in its decaying phase west of the flight region at 15;00 UTC. A second match is observed 39 h prior to the flight with two MCSs (B and C, Fig. 1 right column, lower panel) with minimum CTBT above 200 .
2.2 M55 observations
In this work observations of aerosol backscatter ratio (BSR), aerosol depolarization (δa), ozone (O3), water vapour (H2O),
carbon dioxide (CO2) and particle fine fraction (N6−14) from
7, 8 and 11 August 2006 are presented. Measurements of O3
were made using FOZAN (Fast OZone ANalyzer, Yushkov et al. (1999)), H2O using FISH (Fast In-situ Stratospheric
Hygrometer, Schiller et al. (2009)), CO2 using HAGAR
(High Altitude Gas AnalyzeR, Volk et al. (2000)), NO us-ing SIOUX (see Voigt et al. (2008) and references therein) CO using COLD (Cryogenically Operated Laser Diode, Vi-ciani et al. (2008)), N6−14using COPAS (COndensation
PAr-ticle counter Systems) (Borrmann et al. (2010)), BSR and δa
by MAS (Multiwavelength Aerosol Scatterometer, Adriani et al. (1999)). Relative humidity with respect to ice freez-ing (RHI) is estimated from observed H2O, temperature and
pressure using the formula prescribed by the World Meteoro-logical Organization and the Marti and Mauersberger (1993) formula for saturation pressure over ice. The description of the campaign and the overview of each flight is provided in Cairo et al. (2010) where a list of available observations are presented. Enhanced values of BSR indicate the presence of aerosols and values of δaabove 10% indicate the presence of
ice crystals (Cairo et al., 1999). The mechanism of cirrus for-mation in the uppermost troposphere is still matter of debate, in particular whether ice particles formation can be directly linked to deep convective systems (see for instance Pfister et al. (2001) and Mace et al. (2006)). The use of ice particles as tracer for convection may be ambiguous.
Ultrafine particles (N6−14) are estimated as the
differ-ence between the concentration of particles larger than 6 nm and larger than 14 nm; enhanced values of N6−14(up to
1000 cm−3) indicate that formation must be recent because nucleation mode particles exist only for few hours to one day. Such values can be observed in recent outflow of deep con-vective clouds (Curtius, 2006). Observations of O3, H2O,
CO2 in air masses possibly influenced by local convection
can be identified as deviations with respect to their average value assuming that air masses uplifted by convection are characterized by tracer concentrations close to those repre-sentative of the lower troposphere (Bertram et al., 2007). Al-ternatively, convective processing can act as an ozone source through lightning activity (Schumann and Huntreiser, 2007) with susbstantial production in the TTL (Riviere et al., 2006). As outlined in the introduction and discussed in Law2010, O3in the UT can come from advection of pollutants sources
so in that respect, and because of its relatively long lifetime, identification of local convection signatures is not straight-forward. A non convective average profile, used to
iden-tify observed outliers, was calculated from data collected on the 4 and 13 August flights. These flights were large-scale north-south transects and provide information on the back-ground conditions in the uppermost troposphere as shown by Law2010 where background observations are compared to average convective profiles.
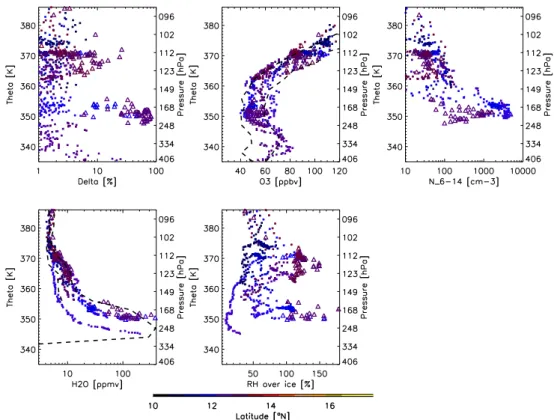
Figure 2 shows the M55 observations on 7 August; there and in the following Figs. 3 and 4 dashed lines represent non-convective average profile plus (and minus) one standard de-viation; the flight was carried out between 11◦N and 13◦N and sampled a region east of the MCSs indicated by (1) in the top left panel of Fig. 1. Two layers of enhanced aerosol depo-larization were observed at 350 and 370 K. Observations with enhanced aerosol concentrations (BSR>1.2) are labeled with open triangles. It can be seen that particles are in the solid phase since δa is larger than 20% when BSR is enhanced.
Total water is enhanced with respect to the average profile in both aerosol layers where RHI exceeds 100%. O3mixing
ratios range between 45 and 60 ppbv at 350 K (where BSR is enhanced) and increase steadily above 360 K. N6−14shows
enhanced values (above 100 cm−3) in the lower aerosol layer. In the higher layer, enhanced BSR were observed together with O3mixing ratios of 80 ppbv which is above the values
measured below 360 K. CO2data were not available for this
event.
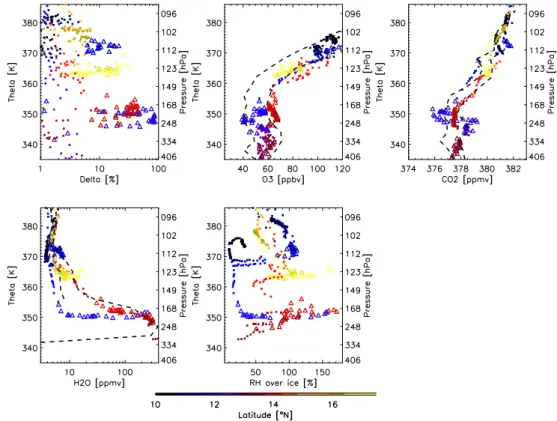
Figure 3 shows the observations for 8 August; the M55 performed a north-south cross section between 8◦N and 18◦N (see Fig. 1, top-central panel), and measurements are likely to have been influenced by MCS outflow 20 h prior to observation. Enhanced BSR and δa were observed
be-tween 11◦N and 14◦N below 355 K, at 17◦N at 365 K and at
lower latitudes (11◦N) between 370 and 375 K. In the lower
layer, H2O mixing ratios are much larger (15 to 200 ppmv) at
14◦N with respect to 11◦N. Values of RHI are above 100% inside the three aerosol layers. O3shows mixing ratios
rang-ing between 40 and 70 ppbv below 360 K that corresponds to the enhanced BSR (triangles) with lower mixing ratios (O3<50 ppbv) observed at lower latitudes (<12◦N). CO2
concentrations are quite variable below 350 K (larger values at 11◦N than at 14◦N) and steadily increase above. Slightly reduced CO2concentrations were observed between 365 and
375 K. This can be interpreted as a signature of convective outflow that transport depleted CO2from below. In fact CO2
mixing ratios are reduced above continents due to vegeta-tion uptake; moreover, since convecvegeta-tion in West Africa has a marked daily cycle with maxima in the evening and dur-ing night, when mixdur-ing layer CO2 is around its minimum,
convective uplift can be identified as negative anomaly with respect to the average vertical profile.
The aerosol layer at 365 K is also associated with en-hanced H2O (15 ppmv) and saturated RHI while no clear
signature in CO2, CO and O3 is visible. The highest
layer at 372 K is associated with enhanced H2O and RHI
>100% while CO2 does not show any deviation with
F. Fierli et al.: Impact of deep convection in the TTL in West Africa 205
Fig. 2. Vertical profiles of observed depolarization δa, ozone O3, carbon dioxide CO2, particle fine fraction N6-N14, water vapour H2O and
relative humidity with respect to ice RH on 7 August 2006. Colors indicate the measurement latitude; triangles indicate the observations within air parcels containing aerosol (BSR>1.2). Dashed lines indicate average values +/− one standard deviation of O3, CO2and H2O.
observations have a partial coverage. However the analy-sis of total number of particles available above 360 K height do not show any increase in concentration due to nucleation event.
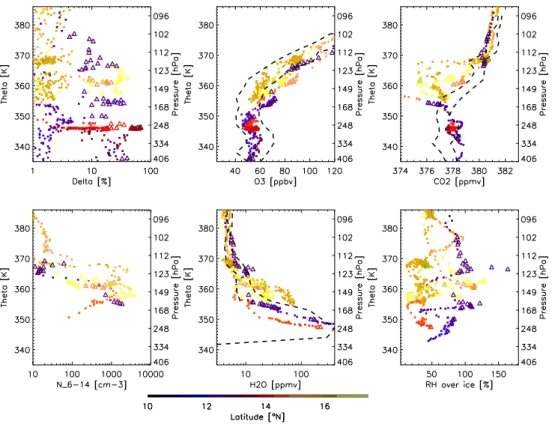
Figure 4 shows the observations for 11 August, taken be-tween 12◦N and 16◦N (see Fig. 1, bottom right panel). Sev-eral layers with enhanced BSR and δa are observed up to
376 K. H2O is enhanced in the 355–365 K layer at 16◦N of
latitude where no particles were observed while RHI were unsaturated. Increased H2O was also observed between 365
and 380 K at 14◦N of latitude at the same time as enhanced
ice particles. N6−14is higher (with values between 100 and
3000 cm−3) up to 370 K and larger values are observed with background BSR. Moreover, large N6−14 is in general
cor-related to depleted CO2. O3 mixing ratios range between
45 and 60 ppbv below 355 K. Between 355 and 370 K O3is
highly variable (45 to 90 ppbv) depending on the sampled latitude and increases steadily above that level. CO2shows
constant mixing ratios below 355 K (377 ppmv) and reduced mixing ratios (374 ppmv) from 355 to 368 K.
From the data collected during these 3 flights, it is evi-dent that convective impact is visible below 355 K with si-multaneous enhancements in water vapour, BSR and aerosol fine fraction, together with reduced concentrations of CO2.
Enhanced concentrations of ice particles were also observed
up to these altitudes indicating that in the main outflow they were formed as a result of deep convection. Above 355 K several layers of particles under saturated conditions were observed. During 7 and 8 August these layers were less ubiquitous with respect to the main outflow below 355 K and were, on average, not correlated to a clear signature on chem-ical tracers. Nevertheless, small and sporadic signatures in CO2(and NO – not reported here) were observed above the
main convective outflow level. Homan et al. (2010) presents the analysis of CO2profiles for 8 August and indicates that
“tape recorder” signal is less compact than as during the other flights which might be an indication of convective transport while on 11 August the CO2depletion can be attributed to
the effect of local deep convection. In fact, observations on 11 August show a different picture with ice aerosol ob-served throughout the vertical profile up to 375 K. In this case, convective impact reached up to 365 and 370 K based on depleted CO2 concentrations and the presence of
ultra-fine particles. O3 mixing ratios are variable below 355 K
and increase above during the first two flights (7 and 8 Au-gust) while the last analyzed event (11 AuAu-gust) shows a nearly constant profile up to 360 K. As observed on 8 Au-gust, O3in the lowermost TTL can present a latitudinal
gra-dient that, according to Law2010, can be attributed to higher NOx emissions and/or lightning NOx that might be more
Fig. 3. As Fig. 2 but for 8 August 2006
relevant further north and directly related to the main latitude of convective activity. The role of long-range transport on the variability of chemical tracers in the TTL during AMMA is presented in Law2010, showing that local sources of O3
over West Africa can be convectively uplifted and mix with air masses advected from upwind regions in the upper TTL; this leads to a less straightforward identification of convec-tive signatures in O3in the West African troposphere with
respect to oceanic convection as discussed for instance in Folkins et al. (2002). The same analysis shows also evidence for enhanced CO2 in convection further east in air masses
originating from central African BB emission regions. Observations of ice particles and outliers in chemical species (and ultrafine particles) are often uncorrelated in the layer between the average convective outflow at 355 K and the tropopause, leading to the qualitative conclusion that this region is composed of air masses with different processing and lifetimes in the TTL. To quantify the convective transport during the M55 observations we will use now a mesoscale model as detailed below.
3 Mesoscale simulations
BOLAM (BOlogna Limited Area Model) is a meteorologi-cal mesosmeteorologi-cale model based on primitive equations in the hy-drostatic approximation and uses wind components u and v, potential temperature θ , specific humidity q and surface
pres-sure ps and includes the advection of passive tracers.
Vari-ables are defined on hybrid coordinates and they are dis-tributed on a non-uniformly spaced Lorenz grid. The hori-zontal discretization uses geographical coodinates, with lat-itudinal rotation on an Arakawa C-grid. The model imple-ments a Weighted Average Flux (WAF) scheme for the three dimensional advection. The lateral boundary conditions are imposed using a relaxation scheme that minimises wave en-ergy reflection. Deep convection is parameterized using the scheme of Kain-Fritsch (Kain, 2004). The boundary layer scheme is based on the mixing length assumption and on the turbulent kinetic energy explicit prediction; the surface tur-bulent fluxes are computed according to the Monin-Obukhov similarity theory. The parameterization of the effects of veg-etation and soil processes is based on water and energy bal-ance in a four layer soil model, and includes diagnostic com-putation of skin temperature and humidity, seasonally depen-dent vegetation effects, evapo-transpiration and interception of precipitation. The radiation is computed with a combined application of the scheme from Ritter and Geleyn (1992) and that from the operational ECMWF model (Morcrette et al., 1998). BOLAM uses a microphysical scheme derived from Schultz (1995) and described in Drofa (2003) that treats five categories of condensate: liquid cloud, pristine ice (cloud ice), rain, snow and graupel. The amount of pristine ice and the crystal growth by water vapour diffusion are both depen-dent on the supersaturation level and are parameterized via
F. Fierli et al.: Impact of deep convection in the TTL in West Africa 207
Fig. 4. As Fig. 2 but for 11 August 2006
the average mass of a single nucleated pristine crystal and a conversion rate control parameter. Ice is removed through sedimentation, conversion to graupel, melting and evapora-tion. Further details about the model are given in Buzzi and Foschini (2000). The model is based on a 38 vertical level hybrid coordinate system, from the ground to the top of the atmosphere (0.1 hPa) with denser levels near the ground, leading to a vertical resolution of 800 m in the upper tro-posphere. The horizontal domain has 235×235 grid points or 24 km horizontal resolution covering the whole Sahelian transect (15◦W to 40◦E in longitude and 0 to 25 N in lati-tude). In this study, the simulation was started at 00:00 UTC on 4 August 2006 and run until 00:00 UTC on 14 August 2006. The model was continuously nudged with brightness temperatures at 10.8 µm from Meteosat Second Generation (MSG) satellite in order to accurately reproduce the evolu-tion of mesoscale convective systems as already described in Orlandi et al. (2010).
3.1 Validation
The nudged BOLAM simulation was evaluated by com-paring model derived CTBT and the satellite observations shown in Fig. 1. Figure 5 shows, for the same times re-ported in Fig. 1, model CTBT calculated with the RTTOV-8 (Saunders and Brunel, 2004) radiative transfer model, using BOLAM water vapour, temperature and hydrometeors
pro-files. Similarly to Fig. 1, only regions with CTBT <220 K are plotted. Overall the comparison between observed and simulated CTBT shows that the BOLAM model correctly re-produces the location and temperature range of convective clouds top even if it underestimates the area of convection. In particular there is a good agreement with the convective activity influencing the area sampled by M55 measurements, discussed in Sect. 2.1.
BOLAM CTBTs prior to 7 August (shown in left column of Fig. 5) correctly reproduce the observed MCSs in Fig. 1 and also the convection upwind of measurement area which developed 18 and 33 h before the flight took place (labeled A and B in Fig. 1). Model brightness temperatures for both systems range between 200 and 195 K, similarly to MSG ob-servations.
On the 8 August, BOLAM CTBTs (central panels of Fig. 5) show the squall line (labeled as A in Fig. 1) and the convective system (labeled as B) 39 h before the flight. The modeled CTBT for MCS B is slightly lower than observed by MSG. Right column of Fig. 5 shows CTBT prior to 11 August. The evolution and CTBT of MCS labeled as (A) is correctly reproduced, although modelled clouds appear to be more scattered. The aerosol backscatter data from the Cloud-Aerosol Lidar and Infrared Pathfinder Satellite Obser-vation (CALIPSO), shown in Fig. 6, sampled the Sahelian region at longitudes ranging between 3◦E and 5◦E on 11 August at 01:30 UTC. It shows a deck of solid particles up
Fig. 5. As Fig. 1 but for the BOLAM model
Fig. 6. Left: CALIPSO aerosol backscatter observed at 01:30 UTC
on 11 August. Aerosol observations (not shown) shows that aerosol are in solid phase. Right: relative humidity with respect to ice es-timated from BOLAM along the CALIPSO overpass. Shaded area shows where relative humidity exceeds 100%.
to 17 km (380 K) between 7◦N and 18◦N and vast deep con-vection area reaching up to 16.5 km (370 K) around 15◦N corresponding to MCS (A) in Fig. 1 right column. BOLAM relative humidity along the CALIPSO overpass is reported in right panel of Fig. 6, showing a good agreement with ob-servations: the model indicated that saturation occurs up to 17 km, the level of average tropopause during August 2006 (Cairo et al., 2010; Law et al., 2010), in correspondance with the CALIPSO cloud top. The latitudinal extent of the MCS is also well captured, with a slight northward shift in the BO-LAM model, also visible from the comparison of system (A) reported in Figs. 1 and 5, right column. A thorough com-parison of the BOLAM simulations for this event and the
improvement due to nudging to satellite observations is re-ported in Orlandi et al. (2010). In general, BOLAM gener-ates less organized convective systems with respect to satel-lite observations even if the position and the temporal evo-lution of MCSs are well reproduced. Simulations also show a coherent transport behavior in the presence of MCSs gen-erated by nudging, with increased divergence in the upper troposphere (Orlandi et al., 2010). Therefore, the transport by convective uplift and outflow can be estimated from the BOLAM simulation with an accuracy considered adequate enough to be used for the interpretation of the M55 data.
3.2 Convective tracer
In order to quantify convective uplift of lower tropospheric air with the BOLAM model, a set of Eulerian tracers are in-cluded in the run. Tracer are injected instantaneously with a timestep of 6 h in the two lowest model levels over the whole domain with a mass mixing ratio χi(φ,λ,θ ) of 10 units where φ, λ, θ are the model longitude, latitude and po-tential temperature level. They are treated as passive tracers for 6 h following the injection and then removed from the mixed layer. The mixed layer top is the upper boundary of the region where rapid mixing occurs and can be defined as an abrupt decrease tracer mixing ratios. This approach has been previously used by Mullendore et al. (2005) for a single tracer to estimate the upward mass fluxes in deep convection from mesoscale model. Here, we extend this approach con-sidering 31 independent tracers, injected from 4 August at
F. Fierli et al.: Impact of deep convection in the TTL in West Africa 209
00:00 UTC until the end of period under analysis (11 August at 18:00 UTC). We remove the tracers below 400 hPa, that is above the maximum mixed layer top and below the minimum height of deep convective outflow as reproduced by the BO-LAM model. Tracer profiles (not shown) indicate a mixing ratio minimum, that appears at 400 hPa 3 h after emission, above the region of rapid vertical mixing uplift tracer (that can reach up to 500 hPa) while the effect of convective up-lift is visible above 300 hPa. So each tracer can be upup-lifted by convection only during the 6 h after emission, when it re-sides in the mixed layer. For each of the convective flights analysed, only the twelve tracer fields emitted in the previous 72 h have been considered. In order to quantify the amount of mixed layer air uplifted by convection during the i-th 6 h interval, the convective fraction of the i-th tracer fci can be estimated for each model grid point and for each timestep t analogously to that reported in Bertram et al. (2007) as:
fci(φ,λ,θ,t ) =χ
i(φ,λ,θ,t )
χMLi (1)
where χMLi is the tracer mean mass mixing ratio in the mixed layer and i is the tracer index representative of emission time. The mixed layer top is estimated for each model grid point as the minimum of the vertical gradient of tracer mixing ratio vertical profile. The use of different tracers allows estimation of the age spectrum Fc(φ,λ,θ,t )of convective uplift from
mixed layer as:
Fc(φ,λ,θ,t,T ) = T X i=1
fci(φ,λ,θ,t ) (2)
where T is the time in hours of tracer emission prior to the analyzed time. The total convective fraction fc, that is used
to quantify the amount of mixed layer air regardless of the uplift time, is estimated as the sum of the fci 72 h prior to each analysed time t , i.e. Fc(φ,λ,θ,t,T =72). We estimate
the convective time Tc(φ,λ,θ,t ) as the time when 75% of
total tracer concentration is present for each model grid point and time:
Fc(φ,λ,θ,t,Tc) =0.75 · Fc(φ,λ,θ,t,T =72) (3)
and represents the time (prior to the analyzed time t ) when dominant convective uplift occurred. The results are slightly sensitive to changes in the threshold (60% to 75%); a posi-tive bias (for lower thresholds) is visible especially for older outflow in limited regions but the spatial distribution remains unchanged.
4 Convective outflow from tracer simulations
We report the spatial distribution of the model diagnostics described above for each M55 flight under analysis. Fig-ure 7 shows the convective fraction fc and the convective
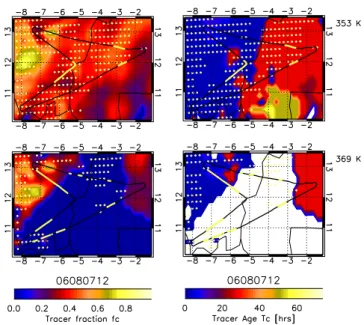
Fig. 7. Left: maps of fc estimated from the BOLAM model
(see text for definition) for two theta layers (368–369 K above the main convective levels and at 352–354 K) for 7 August 2009 at 15:00 UTC. Yellow dots indicates where BOLAM RHice exceeds
100%. The M55 path is reported in the plot: yellow thick lines in-dicates the part of flight occurring at the theta level reported in the figure. Right: same as left but for tc.
time Tcon 7 August at 15:00 UTC for two θ layers at 353 K
(representative of the main outflow) and 369 K (close to the tropopause) . The whole flight area in the lower layer is char-acterized by values of total convective tracer ranging between 0.1 and 0.7 indicating that convective uplift has a likely im-pact. Convective age is highly variable with lower values (few hours) in the western part of the analyzed domain and higher values (24 to 48 h) in the eastern part indicating that air parcels were uplifted at different times. Based on the tracer analysis, more recent uplift occurs close to the con-vective system observed west of the flight region (see Fig. 1 and Fig. 5 top left panel) while more aged uplift occurs at two distinct times, in reasonable agreement with the conclu-sions drawn in Sect. 2.1.1. BOLAM also shows the presence of saturated air (RHice>100%) (yellow shaded area)
corre-sponding to convective outflow with Tc less than 24 h. The
distribution of fc and Tc in the upper layer (369 K) shares
similar characteristics with the lower layer but with a smaller area with significant convective impact (i.e. fc>0.1)
con-fined to the east and west boundaries of flight region. Figure 8 shows the same set of diagnostics for 8 Au-gust. Although a similar picture to the previous event can be inferred, the impact of deep convection in the higher layer (369 K) is larger during this event. The model shows the co-existence of air masses with different convective age
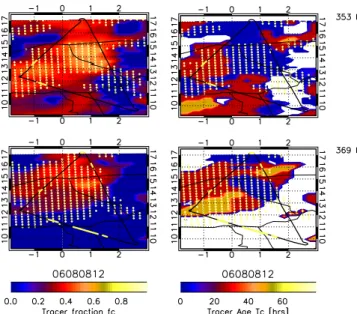
Fig. 8. As Fig. 7 but for the 8 August 2006 at 15:00 UTC .
fraction occurs in the northern part of the domain positively correlated to the observed O3latitudinal variability reported
in Fig. 3 with higher values of O3(65 ppbv) observed north
of 14◦N. Saturated air (yellow shade) is large and is present also in the upper layer located close to the outflow.
The results for 11 August (Fig. 9) show a large convective impact in both 352 and 365 K layers in the western part of the flight area, mostly related to uplift occurring in the large MCS labeled by (1) in Fig. 1 that is correctly reproduced by BOLAM (Fig. 5, right column). Tc is lower than previous
events, ranging between 6 and 20 h, with values higher that 24 h only in the eastern part of the domain at 365 K. Both layers are characterized by large areas of saturated air. In the lower level saturation occurs in the western part of the domain where older convection has a likely impact.
Overall, the analysis also shows that modeled convection has an important impact on the 353 K layer. At 365–369 K, convective transport influence is visible to a smaller extent. Moreover, the convective age (as given by Tcvalues) is
vari-able showing that air masses influenced by very recent con-vection (Tc<24 h) coexist (especially at higher altitudes)
with air masses influenced by older convection (Tc>48 h)
which likely formed to the east over central the Sahelian re-gion above northern Nigeria and southern Chad.
5 Comparison with observations
Since modeled and observed ice particle presence can also provide useful information, two additional diagnostics were defined to estimate model ice clouds and the extent to which such clouds might have been influenced by deep convection.
Fig. 9. As Fig. 7 but for the 11 August 2006 flight.
– The ice fraction, fi(θ,t ), is the fraction of model grid
points with values of RHI>100%
– The convective fraction of ice, fic, is the fraction of
model grid points with values of RHI>100% and with a total tracer concentration Fc(φ,λ,θ,t,T =72) greater
than 0.1
We focus now on the vertical structure of convective out-flow in the upper troposphere. The model diagnostics are averaged in latitude and longitude over the flight area shown in Figs. 7–9 and in the vertical over 12 θ -levels with a verti-cal resolution comparable to the model. In order to perform a comparison of the modeled and the observed vertical pro-files, a set of diagnostics analogous to those derived from BOLAM output are applied to measurements: (1) fBSR is
the fraction of observations with BSR> 1.2 and describes the vertical distribution of ice clouds to be compared with
fi; (2) fCO2is the fraction of observations with CO2 concen-trations lower than the average value minus its standard de-viation and describes the possible impact of deep convection on CO2profiles. Vertical profiles of diagnostics are plotted
in Fig. 10: observation-derived ones are colored in red and model derived in blue. The vertical profile of fcis shown by
the rightmost curve of Fc(θ,T )contours.
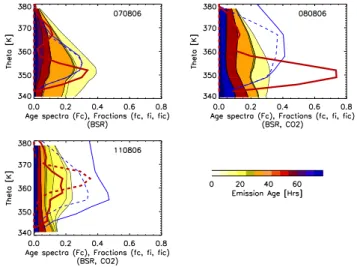
On 7 August the BOLAM convective fraction fc has a
maximum of 0.4 at 350 K in agreement with observations that show a similar fraction of aerosol measurements at the same height; fc decreases rapidly with height becoming
small (<0.1) above 370 K. The convective age spectra indi-cates that uplift occurred at three different times: less than 6 h, approximately at 31 h and more than 48 h before the flight; recent uplift, likely originating from the convective
F. Fierli et al.: Impact of deep convection in the TTL in West Africa 211
Fig. 10. Vertical profiles of the diagnostics described in the text.
Model-derived ones are plotted in blue, observation-derived in red. Left column: BOLAM ice fraction fi(solid blue line) and convec-tive ice fraction fic (dashed blue line); observed aerosol fraction
fBSR(dotted red line), Right column: convective fraction fc;
ob-served fraction of outliars in CO2fCO2 plotted as dashed red line; fBSRis also plotted to be compared with fc. Top panels are for 7
August, middle for 8 August and bottom for 11 August.
system west of the flight path shown in Fig.1 , has a maxi-mum impact at 350 K in the main convective outflow. Above, older uplift (>48 h) becomes dominant. The vertical profile of fBSR for 7 August flight (Fig. 10, upper left panel, red
solid line) shows the presence of two distinct layers (below 360 K and at 367 K) as shown in Fig. 2. The model-derived vertical profiles of fice (left panel, solid blue line) and ficec
(left panel, dashed blue line) indicate that BOLAM predicts the presence of ice clouds in the whole convective layer that are formed inside air masses uplifted by deep convection. In the uppermost layer, where enhanced depolarization was ob-served, BOLAM reproduces a smaller amount of ice clouds in connection to the older convective uplift.
On 8 August (middle panel) the vertical structure of fBSR
is similar to the previous day but, in this case, BOLAM shows a less steep decrease in fc with height; enhanced fi
is simulated up to the tropopause level in agreement with ob-servations that indicate several layers of ice particles up to 375 K. ficis equal to fi below 355 K indicating that model
ice clouds were formed in the convective outflow. Above that level the BOLAM model shows the presence of ice par-ticles also in upper tropospheric air masses not originating from convective outflow. Above 370 K the model shows that ice forms predominantly in the uppermost troposphere and is uncorrelated to the convective uplift. Analogously to the pre-vious event, recent uplift is confined below 355 K and above that level uplift occurred more than 24 h prior to the flight.
On 11 August (lower panel) the model shows that Fc
reaches quasi-constant values up to 370 K indicating that
convective impact extended higher up in altitude with respect to the 2 previous events. Convective outflow is mainly com-posed of air mass recently uplifted (< 24 hrs). Nevertheless, the presence of older air masses (up to 72 h) cannot be con-sidered negligible throughout the vertical profile. BOLAM shows also the presence of a thick ice cloud layer (peaking at 360 K) in agreement with the observations which show dis-tinct thin layers of ice particles with a maxima in fBSRat the
same height. BOLAM overstimates fi with respect to fBSR
and 75% of model ice clouds are of recent convective origin in the lower layer (estimated as the ratio between fic and fi
throughout the vertical range) whilst the fraction is around 30% in the upper layer. Within the 355–370 K layer, fCO2is large (up to 90%) and corresponds to regions where low CO2
was observed (see Fig. 3) .
The analysis shows that local convection hydrates the up-per troposphere over West Africa and, in one case (11 Au-gust), there is a significant impact up to 375 K. Convection can induce an upward transport of water vapour and ice par-ticles which can evaporate. This recent convection is super-imposed on older convection which took place up to 3 days before the observations. Even if a detailed analysis of cir-rus formation mechanisms is outside the scope of this paper, it is worth noting that modelled and observed layers of ice particles are in good agreement.
Ice particles appear to be formed directly in the main out-flow below 360 K and their presence is correlated to the uplift seen by model. Above the main outflow, BOLAM humidity indicates that ice clouds often form in the TTL at the top of mesoscale convective systems. These results are in qual-itative agreement with a recent analysis of CALIPSO and CLOUDSAT observations which concluded that TTL cirrus are likely observed close to deep convective clouds (Sassen et al., 2009).
6 Conclusions
The analysis presented here aimed to characterize the im-pact of deep convection on the West African upper tropo-sphere in August 2006 using a combination of aircraft data and mesoscale modelling. In particular, three M55 flights were analysed where there was a clear presence of organized convective systems either close to the flights or upwind over eastern and central Africa up to 3 days earlier.
The observations of trace gases and aerosols collected dur-ing these flights on 7, 8 and 11 August, showed that it is pos-sibile to identify a main convective outflow characterized by substantial hydration, low concentrations of CO2and freshly
nucleated ice particles. Deep convection largely determined the chemical composition up to a potential temperature level ranging between 355 K to 360 K that is assumed to be the top of the main outflow. These results confirm the results pre-sented in Law2010 based on estimations using trajectories
calculated from large-scale meteorological analyses. More-over, convective signatures are often observed above the top of the main outflow up to the thermal tropopause (375 K) and can be identified by observations of thin ice cloud layers, en-hanced fine particles concentration and CO2 depletion. In
particular, one specific event (11 August) clearly shows that the distributions of CO2and fine particles were strongly
per-turbed up to the tropical tropopause. On the other hand, large perturbations in ozone are not always observed since this re-gion is characterized by land based convection that transports air masses containing different levels of ozone and its precur-sors or aerosols (local pollution, biomass burning, soil NOx,
lightning NOx). As discussed further in Law2010,
large-scale easterly transport in the TTL can also bring lightning NOxand pollutants from the Asian continent and air masses
with marine convective signatures such as low O3 into the
UT over West Africa and its superposition on different con-tinental sources makes it difficult to use ozone as a tracer of deep convective transport in this region. This is clearly vis-ible for instance during one event (8 August) where ozone is highly variable in the region of main convective outflow correlated to the latitudinal dependence of local sources.
Nudged mesoscale simulations performed with the BO-LAM model correctly reproduce the general pattern of con-vection observed during the first 15 days of August 2006 and therefore, can be used to estimate the convective outflow and compared with the measurements. Passive boundary layer tracers are used to estimate the convective age, identify when uplift occurred and calculate the fraction of convectively up-lifted air masses in the flight area.
BOLAM shows good agreement with convective perturba-tions derived from observaperturba-tions of aerosol and chemical trac-ers for the main convective outflow region below 355 K and indicates that West Africa convection influences around 30% of air masses resulting in substantial hydration and formation of ice particles up to this level. Model tracers also indicate that convective outflow can be highly spatially variable and this might help to explain, at least on qualitative basis, the large variability in trace species observed by M55, for ex-ample, O3on the 8 August event. BOLAM also correctly
reproduces the outflow of a recent MSC on 11 August and simulates a large convective influence (up to 20%) between 355–370 K in acceptable agreement with the convective frac-tion estimated from observafrac-tions of CO2and of freshly
nu-cleated small particles.
Recent uplift (less than 24 h) is mainly confined in the main convective layer while older uplift is important above 355 K showing that deep convection in the central Sahel has a non negligible role, at least with respect to the formation of ice layers. The event of deep convection on 11 August is characterized by air masses uplifted by recent convection up to the tropopause level; this is superposed to an older uplift, being responsible of the presence of thin ice clouds. This is confirmed, at least on qualitative basis, by in-situ observa-tions of CO2, water vapor and aerosol that show the presence,
in the upper troposphere, of perturbed trace gas concentra-tions, hydrated air and particles. Air masses perturbed by more recent convection are likely characterized by depleted CO2and large concentrations of freshly nucleated particles
whilst ozone shows concentrations slightly higher than in the mean convective outflow.
In-situ observations and model data helped to identify and quantify the role of deep convection in the TTL showing that local convection generates a main outflow that was sam-pled during the measurement campaign. The impact on at-mospheric composition between the main outflow and the tropopause is more difficult to assess due to different sources and the role of large-scale westward transport. Nevertheless, it is possible to identify a clear signature of local convec-tion in the observaconvec-tions. Model aided analysis confirms the presence of direct injection up to the tropical tropopause by intense convective systems and indicates that composition is dependent on the residence time in the TTL after convec-tive uplift. An interesting extension of this work would be to implement the same analysis considering the whole mon-soon season in order to characterize on the longer term (and larger scale) the impact of central/west African convection on the UT. Climatological analysis of METEOSAT data (Laing et al., 2008) shows Sahelian cold clouds often formed over Nigeria, Chad and Sudan, and possibly fed by trace species from biomass burning sources (Mari et al., 2008; Real et al., 2010). Extensive regional model simulations coupled with satellite data analysis would be necessary to quantify their impact on upper tropospheric composition.
Acknowledgements. The authors acknowledge the partial support
of the EC SCOUT-O3 Integrated Project (505390- GOCE-CT-2004). This work was partly supported by AMMA project. Based on French initiative, AMMA was built by an international scientific group and is currently funded by a large number of agencies, espe-cially from France, UK, US and Africa. It has been the beneficiary of a major financial contribution from the European Community’s Sixth Framework Research Programme. We acknowledge the anonymous reviewers for their valuable suggestions.
Edited by: C. Reeves
References
Adriani, A., Viterbini, M., Cairo, F., Mandolini, S., and Di Don-francesco, G.:Multiwavelength Aerosol Scatterometer for air-borne experiments to study the stratospheric particle optical properties: J. Atmos. Ocean. Technol., 16, 1328–1335, 1999. Ancellet, G., Leclair de Bellevue, J., Mari, C., Nedelec, P., Kukui,
A., Borbon, A., and Perros, P.: Effects of regional-scale and con-vective transports on tropospheric ozone chemistry revealed by aircraft observations during the wet season of the AMMA cam-paign, Atmos. Chem. Phys., 9, 383–411, doi:10.5194/acp-9-383-2009, 2009.
Barret, B., Ricaud, P., Mari, C., Attiz, J.-L., Bousserez, N., Josse, B., Le Flochmon, E., Livesey, N. J., Massart, S., Peuch,
V.-F. Fierli et al.: Impact of deep convection in the TTL in West Africa 213
H., Piacentini, A., Sauvage, B., Thouret, V., and Cammas, J.-P.: Transport pathways of CO in the African upper troposphere during the monsoon season: a study based upon the assimilation of spaceborne observations, Atmos. Chem. Phys., 8, 3231–3246, doi:10.5194/acp-8-3231-2008, 2008.
Bertram, T. H., Perring, A. E., Wooldridge, P. J., Crounse, J. D., Kwan, A. J., Wennberg, P. O., Scheuer, E., Dibb, J., Avery, M., Sachse, G., Vay, S. A., Crawford, J. H., McNaughton, C. S., Clarke, A., Pickering, K. E., Fuelberg, H., Huey, G., Blake, D. R., Singh, H. B., Hall, S. R., Shetter, R. E., Fried, A., Heikes, B. G., and Cohen, R. C.: Direct Measurements of the Convec-tive Recycling of the Upper Troposphere, Science, 315, 816820, 2007.
Borrmann, S., Kunkel, D., Weigel, R., Minikin, A., Deshler, T., Wilson, J. C., Curtius, J., Volk, C. M., Homan, C. D., Ulanovsky, A., Ravegnani, F., Viciani, S., Shur, G. N., Belyaev, G. V., Law, K. S., and Cairo, F.: Aerosols in the tropical and subtropical UT/LS: in-situ measurements of submicron particle abundance and volatility, Atmos. Chem. Phys., 10, 5573–5592, doi:10.5194/acp-10-5573-2010, 2010.
Buzzi A. and Foschini, L.: Mesoscale meteorological features as-sociated with heavy precipitation in the southern Alpine region. Meteorol. Atmos. Phys., 72, 131–146, 2000.
Cairo F., Di Donfrancesco, G., Adriani, A., Pulvirenti, L., and Fierli, F.: Comparison of Various Linear Depolarization Param-eters Measured by Lidar Applied Optics, 38, 21, 4425–4432, 1999.
Cairo, F., Pommereau, J. P., Law, K. S., Schlager, H., Garnier, A., Fierli, F., Ern, M., Streibel, M., Arabas, S., Borrmann, S., Berthelier, J. J., Blom, C., Christensen, T., D’Amato, F., Di Don-francesco, G., Deshler, T., Diedhiou, A., Durry, G., Engelsen, O., Goutail, F., Harris, N. R. P., Kerstel, E. R. T., Khaykin, S., Konopka, P., Kylling, A., Larsen, N., Lebel, T., Liu, X., MacKen-zie, A. R., Nielsen, J., Oulanowski, A., Parker, D. J., Pelon, J., Polcher, J., Pyle, J. A., Ravegnani, F., Rivire, E. D., Robinson, A. D., Rckmann, T., Schiller, C., Simes, F., Stefanutti, L., Stroh, F., Some, L., Siegmund, P., Sitnikov, N., Vernier, J. P., Volk, C. M., Voigt, C., von Hobe, M., Viciani, S., and Yushkov, V.: An in-troduction to the SCOUT-AMMA stratospheric aircraft, balloons and sondes campaign in West Africa, August 2006: rationale and roadmap, Atmos. Chem. Phys., 10, 2237–2256, doi:10.5194/acp-10-2237-2010, 2010.
Corti, T., Luo, B. P., Fu, Q., Vsmel, H., and Peter, T.: The impact of cirrus clouds on tropical troposphere-to-stratosphere transport, Atmos. Chem. Phys., 6, 2539–2547, doi:10.5194/acp-6-2539-2006, 2006.
Corti, T., Luo, B. P., de Reus, M., Brunner, D., Cairo, F., Ma-honey, M. J., Martucci, G., Matthey, R., Mitev, V., dos Santos,F. H., Schiller, C., Shur, G., Sitnikov, N. M., Spelten, N., Voss-ing, H. J., Borrmann, S., and Peter, T.: Unprecedented evidence for deep convection hydrating the tropical stratosphere, Geophys. Res. Lett., 35, L10810, doi:10.1029/2008GL033641, 2008. Chaboureau, J.-P., Cammas, J.-P., Duron, J., Mascart, P. J., Sitnikov,
N. M., and Voessing, H.-J.: A numerical study of tropical cross-tropopause transport by convective overshoots, Atmos. Chem. Phys., 7, 1731–1740, doi:10.5194/acp-7-1731-2007, 2007. Curtius J.: Nucleation of atmospheric particles, C. R. Physique, 7,
1027–1045, 2006.
Dessler, A. E.: The effect of deep, tropical convection on the
tropical tropopause layer, J. Geophys. Res., 107(D3), 4033, doi:10.1029/2001JD000511, 2002.
Drofa, O. V.: The parameterization of microphysical processes for atmospherical numerical models, Il Nuovo CImento, 26C(3), 233–262, 2003.
Fierli, F., Di Donfrancesco, G., Cairo, F., Marcal, V., Zampieri, M., Orlandi, E., and Durry, G.: Variability of cirrus clouds in a convective outflow during the Hibiscus campaign, Atmos. Chem. Phys., 8, 4547–4558, doi:10.5194/acp-8-4547-2008, 2008. Folkins, I., Braun, C., Thompson, A. M., and Witte, J.: Tropical
ozone as an indicator of deep convection, J. Geophys. Res. At-mos., 107(D13), 4184, doi:10.1029/2001JD001178, 2002. Folkins, I. and Martin, R. V.: The vertical structure of tropical
con-vection and its impact on the budgets of water vapor and ozone, J. Atmos. Sci.,62, 1560–1573, 2005.
Fueglistaler, S. and Fu, Q.: Impact of clouds on radiative heating rates in the tropical lower stratosphere, J. Geophys. Res., 111, D23202, doi:10.1029/2006JD007273, 2006.
Fueglistaler, S., Dessler, A. E., Dunkerton, T. J., Folkins, I., Fu, Q., and Mote, P. W.:, Tropical tropopause layer, Rev. Geophys., 47, RG1004, doi:10.1029/2008RG000267, 2009.
Gheusi, F. and Stein, J.: Lagrangian description of airflows using Eulerian passive tracers, Q. J. Roy. Meteorol. Soc., 128(579), 337–360, 2002.
Homan, C. D., Volk, C. M., Kuhn, A. C., Werner, A., Baehr, J., Vi-ciani, S., Ulanovski, A., and Ravegnani, F.: Tracer measurements in the tropical tropopause layer during the AMMA/SCOUT-O3 aircraft campaign, Atmos. Chem. Phys., 10, 3615–3627, doi:10.5194/acp-10-3615-2010, 2010.
Janicot, S., Thorncroft, C. D., Ali, A., Asencio, N., Berry, G., Bock, O., Bourles, B., Caniaux, G., Chauvin, F., Deme, A., Kergoat, L., Lafore, J.-P., Lavaysse, C., Lebel, T., Marticorena, B., Mounier, F., Nedelec, P., Redelsperger, J.-L., Ravegnani, F., Reeves, C. E., Roca, R., de Rosnay, P., Schlager, H., Sultan, B., Tomasini, M., Ulanovsky, A., and ACMAD forecasters team: Large-scale overview of the summer monsoon over West Africa during the AMMA field experiment in 2006, Ann. Geophys., 26, 2569– 2595, doi:10.5194/angeo-26-2569-2008, 2008.
Kain, J. S.: The Kain-Fritsch convective parametrization: an up-date. J. App. Meteorol., 43, 170–181, 2004.
Khaykin, S., Pommereau, J.-P., Korshunov, L., Yushkov, V., Nielsen, J., Larsen, N., Christensen, T., Garnier, A., Lukyanov, A., and Williams, E.: Hydration of the lower stratosphere by ice crystal geysers over land convective systems, Atmos. Chem. Phys., 9, 2275–2287, doi:10.5194/acp-9-2275-2009, 2009. Laing, A.G., Carbone, R., Levizzani, V., and Tuttle, J.: The
propagation and diurnal cycles of deep convection in north-ern tropical Africa, Q. J. Roy. Meteorol. Soc., 134, 93–109, doi:10002/qj.194, 2008.
Law, K. S., Fierli, F., Cairo, F., Schlager, H., Borrmann, S., Streibel, M., Real, E., Kunkel, D., Schiller, C., Ravegnani, F., Ulanovsky, A., d’Amato, F., Viciani, S., and Volk, C. M.: Air mass origins influencing TTL chemical composition over West Africa during 2006 summer monsoon, Atmos. Chem. Phys., 10, 10753–10770, doi:10.5194/acp-10-10753-2010, 2010.
Mace, G. G., Benson, S., and Vernon, E.: Cirrus Clouds and the Large-Scale Atmospheric State: Relationships Revealed by Six Years of Ground-Based Data, J. Climate, 19, 3257–3278, doi:10.1175/JCLI3786.1, 2006.
Mari, C. H., Cailley, G., Corre, L., Saunois, M., Atti, J. L., Thouret, V., and Stohl, A.: Tracing biomass burning plumes from the Southern Hemisphere during the AMMA 2006 wet season ex-periment, Atmos. Chem. Phys., 8, 3951–3961, doi:10.5194/acp-8-3951-2008, 2008.
Marti, L. and Mauersberger, K.: A survey and new measure-ments of ice vapor pressure at temperatures between 170 and 250 K,Geophys. Res. Lett., 20, 363–366, 1993.
Morcrette, J. J., Clough, S. A., Mlawer, E. J., and Iacono, M. J.: Impact of a validated radiative transfer scheme, RRTM, on the ECMWF model climate and 10-day forecasts. ECMWF Techni-cal Memo., 252, 1998.
Mullendore G. L., Durran D. R., and Holton, J. R.: Cross.tropopause tracer transport in midlatitude convec-tion, J. Geophys. Res., 116, D06113, doi:10.129/2004JD005059, 2005.
Orlandi, E., Fierli. F., Davolio, S., Buzzi, A., and Drofa, O.: A nudging scheme to assimilate satellite brightness tempera-ture in a meteorological model: Impact on representation of African mesoscale convective systems, Q. J. Roy. Meteorol. Soc., 136(647), 462–474, 2010.
Pfister, L., Selkirk, H. B., Jensen, E. J., Schoeberl, M. R., Toon, O. B., Browell, E. V., Grant, W. B., Gary, B., Mahoney, M. J., Bui, T. V., and Hintsa, E.: Aircraft observations of thin cirrus clouds near the tropical tropopause, J. Geophys. Res., 106(D9), 9765–9786, 2001.
Real, E., Orlandi, E., Law, K. S., Fierli, F., Josset, D., Cairo, F., Schlager, H., Borrmann, S., Kunkel, D., Volk, C. M., McQuaid, J. B., Stewart, D. J., Lee, J., Lewis, A. C., Hopkins, J. R., Raveg-nani, F., Ulanovski, A., and Liousse, C.: Cross-hemispheric transport of central African biomass burning pollutants: impli-cations for downwind ozone production, Atmos. Chem. Phys., 10, 3027–3046, doi:10.5194/acp-10-3027-2010, 2010.
Redelsperger, J. L., Thorncroft, C., Diedhiou, A., Lebel, T., Parker, D. J., and Polcher, J.: African Monsoon Multidisciplinary Analy-sis (AMMA): An International Research Project and Field Cam-paign, BAMS, 87(12), 1739–1746, 2006.
Reeves, C. E., Formenti, P., Afif, C., Ancellet, G., Attiz, J.-L., Bechara, J., Borbon, A., Cairo, F., Coe, H., Crumeyrolle, S., Fierli, F., Flamant, C., Gomes, L., Hamburger, T., Jambert, C., Law, K. S., Mari, C., Jones, R. L., Matsuki, A., Mead, M. I., Methven, J., Mills, G. P., Minikin, A., Murphy, J. G., Nielsen, J. K., Oram, D. E., Parker, D. J., Richter, A., Schlager, H., Schwarzenboeck, A., and Thouret, V.: Chemical and aerosol characterisation of the troposphere over West Africa during the monsoon period as part of AMMA, Atmos. Chem. Phys., 10, 7575–7601, doi:10.5194/acp-10-7575-2010, 2010.
Ritter, B. and Geleyn, J.: A comprehensive radiation scheme for numerical weather prediction models with potential applications in climate simulations, Mon. Weather Rev., 120, 303–325, 1992. Rivi`ere, E. D., Marecal, V., Larsen, N., and Cautenet, S.: Modelling study of the impact of deep convection on the UTLS air compo-sition. Part 2: budget of ozone in the TTL, Atmos. Chem. Phys., 6, 1585–1598, doi:10.5194/acp-6-1585-2006, 2006.
Sassen K., Wang, Z. and Liu, D. , Cirrus clouds and deep convec-tion in the tropics: Insights from CALIPSO end CloudSat, Journ. Geophys. Res., 114, D00H06, doi:10.129/2009JD011916, 2009. Saunders, R. and Brunel, P.: RTTOV 8.5 user guide, EUMET-SAT SAFNWP http://www.metoffice.gv.uk/research/interproj/ nwpsaf/rtm/, 2004.
Saunois, M., Reeves, C. E., Mari, C. H., Murphy, J. G., Stewart, D. J., Mills, G. P., Oram, D. E., and Purvis, R. M.: Factors control-ling the distribution of ozone in the West African lower tropo-sphere during the AMMA (African Monsoon Multidisciplinary Analysis) wet season campaign, Atmos. Chem. Phys., 9, 6135– 6155, doi:10.5194/acp-9-6135-2009, 2009.
Schultz, P.: An explicit cloud physics parameterization for opera-tional numerical weather prediction, Mon. Weather Rev, 123, 3331–3343, 1995.
Schmetz J., Tjemkes, S. A., Gube, M., and van de Berg, L.: Mon-itoring deep convection and convective overshooting with ME-TEOSAT, Advances in Space Research, Proceedings of the A0.1 Symposium of COSPAR Scientific Commission A, 19(3), 433– 441, 1997.
Schiller, C., Grooß, J.-U., Konopka, P., Pl¨oger, F., Silva dos Santos, F. H., and Spelten, N.: Hydration and dehydration at the tropical tropopause, Atmos. Chem. Phys., 9, 9647–9660, doi:10.5194/acp-9-9647-2009, 2009.
Schumann, U. and Huntrieser, H.: The global lightning-induced nitrogen oxides source, Atmos. Chem. Phys., 7, 3823–3907, doi:10.5194/acp-7-3823-2007, 2007.
Stewart, D. J., Taylor, C. M., Reeves, C. E., and McQuaid, J. B.: Biogenic nitrogen oxide emissions from soils: impact on NOx
and ozone over west Africa during AMMA (African Monsoon Multidisciplinary Analysis): observational study, Atmos. Chem. Phys., 8, 2285–2297, doi:10.5194/acp-8-2285-2008, 2008. Viciani, S., D’Amato, F., Mazzinghi, P., Castagnoli, F., Toci, G., and
Werle, P.: A cryogenically operated laser diode spectrometer for airborne measurement of stratospheric trace gases, Appl. Phys. B, 90, 581–592, 2008.
Voigt, C., Schlager, H., Roiger, A., Stenke, A., de Reus, M., Borrmann, S., Jensen, E., Schiller, C., Konopka, P., and Sit-nikov, N.: Detection of reactive nitrogen containing particles in the tropopause region evidence for a tropical nitric acid trihydrate (NAT) belt, Atmos. Chem. Phys., 8, 7421–7430, doi:10.5194/acp-8-7421-2008, 2008.
Volk, C. M., Riediger, O., Strunk, M., Schmidt, U., Ravegnani, F., Ulanovsky, A., and Rudakov, V.: In situ Tracer Measurements in the Tropical Tropopause Region During APE-THESEO, Eur. Comm. Air Pollut. Res. Report 73, 661–664, 2000.
Yushkov, V., Ouloanovsky, A., Lechenuk, N., Roudakov, I., Ar-shinov, K., Tikhonov, F.,Stefanutti, L., Ravegnani, F., Bonaf, U., and Georgiadis, T.: A chemiluminescent analyzer for strato-spheric measurements of ozone concentration (FOZAN), J. At-mos. Ocean. Tech., 16, 1345–1350, 1999.