HAL Id: hal-01632315
https://hal-upec-upem.archives-ouvertes.fr/hal-01632315
Submitted on 10 Nov 2017HAL is a multi-disciplinary open access
archive for the deposit and dissemination of sci-entific research documents, whether they are pub-lished or not. The documents may come from teaching and research institutions in France or abroad, or from public or private research centers.
L’archive ouverte pluridisciplinaire HAL, est destinée au dépôt et à la diffusion de documents scientifiques de niveau recherche, publiés ou non, émanant des établissements d’enseignement et de recherche français ou étrangers, des laboratoires publics ou privés.
Structure and properties of lead silicate glasses and
melts
Ilyes Ben Kacem, Laurent Gautron, Daniel Coillot, Daniel R. Neuville
To cite this version:
Ilyes Ben Kacem, Laurent Gautron, Daniel Coillot, Daniel R. Neuville. Structure and prop-erties of lead silicate glasses and melts. Chemical Geology, Elsevier, 2017, 461, pp.104-114. �10.1016/j.chemgeo.2017.03.030�. �hal-01632315�
1
Structure and properties of lead silicate glasses and melts
Ilyes Ben Kacem
1,2, Laurent Gautron
1,
Daniel Coillot
3, Daniel R. Neuville
2*1
Laboratoire Géomatériaux et Environnement, Université Paris-Est Marne-la-Vallée, 5 Bd Descartes 77454 Champs-sur-Marne, Marne-la-Vallée cedex 02, France.
2
Géomatériaux, CNRS-UMR7154, Institut de Physique du Globe de Paris, Sorbonne Paris Cité, F-75005 Paris, France.
3
Baccarat, Manufacture Baccarat, Baccarat 54120.
* corresponding author
E-mail: [email protected]. Tel: 01 83 95 74 61. Fax: 01 83 95 77 06.
Abstract
Viscosity, density and glass transition temperature measurements were performed on the simple PbO-SiO2 system with increasing PbO content from 5 to 70 mol.%. The results of these analyses have been complemented by spectroscopic studies (Raman & X-Ray Absorption Spectroscopy) in order to link macroscopic properties to structural information at short- and middle-range order. A strong decrease of the viscosity is observed even with the incorporation of 5 mol.% PbO, and this decrease goes on with the increase of PbO content. This effect is confirmed by the continuous decrease of the glass transition temperature with increasing PbO content. Based on our interpretations of Raman spectra, which show similarities to alkali or earth-alkaline-silicate glasses, these effects appear to arise from depolymerization of the silica network. Consequently, lead acts as a network modifier even at low content. Although, it could form PbO4 tetrahedra when it is present in large quantities, it cannot be asserted that lead acts as a network former at high lead content.
Keywords: lead silicate, Raman spectroscopy, Viscosity, glasses, structure of glasses and melts
Highlights
Lead silicate glasses were made from 95 to 30 mol.% SiO2.
Pb cation acts as network modifier even above the orthosilicate composition (more than 65 mol.% PbO).
2
1. Introduction
Flint glass (old nomination of lead crystal) is very well known and used for a very long time in particular for optical application, because they display a high refractive index and low Abbe number (high dispersion). These high refractive index glasses are also highly sought-after because they can imitate precious stones and objects of great value. This kind of glasses corresponds to the work made by the very well-known factories of the “art de la table” such as Baccarat, St Louis, Daum or Lalique. Lead metal is a heavy element also used for radioprotection against high energy radiations, and its radioprotection quality works also when lead is incorporated in glass. Then, lead-bearing transparent materials can be manufactured to protect workers from radiation in nuclear sites, and also to monitor radioactive materials. Moreover, lead (Pb) is a very common metal used in many supplies and objects, and domestic wastes may contain lead in large quantities (Karnis and Gautron, 2009) then requiring to take lead into account for waste management. Lead is also an element of major interest in many systems in Earth Science since it is an important marker used to date geological processes through its isotopes (radiogenic 206Pb, 207Pb and 208Pb, non-radiogenic 204Pb). In fact, by using isochron dating, it was found that the most accurate age of the earth is obtained by demonstrating that the earth's uranium-lead system belongs to the array of meteoritic uranium-lead systems (see Patterson, 1956). The partitioning of these isotopes inside the magmas and silicate melts observed at the Earth surface gives key constrains on geochemical and geophysical processes occurring in the deep Earth.
Lead silicate glasses are interesting because lead is the only element for which it is possible to make glass with a very large range of SiO2 content from 100% down to less than 30% of silica (Jak et
al., 1997). These glasses have already been investigated by several research groups from a
thermodynamic point of view (Bockris and Mellors, 1956; Nesbitt and Fleet, 1980; Hess, 1974 and
Gupta 1995) or by a spectroscopic approach (Furukawa et al., 1978; Worrell and Henshall, 1978;
Smets and Lommen, 1982; Wang an Zhang, 1996; Ohno et al., 1991 and Feller 2010; Lee and Kim, 2015). Despite these studies, the role of Pb is still debated. Using X-Ray Photoelectron Spectroscopy (XPS), Smets and Lommen (1982) showed that there is a decrease of the fraction of Bridging Oxygen (BO: one oxygen binding two silicon atoms) with the increase of PbO content. The BO fraction goes from 0.66 to 0.19 for 30 to 70 mol.% PbO incorporated respectively. Based on these results and comparing to alkali-silicate systems, there is no complete depolymerization of the silicate network near the orthosilicate composition (presence of BO). These authors suggest that Pb keeps its role of network modifier and that the silicate network is preserved. By using the same technique (XPS), Wang and Zhang (1996) observed that the BO binding energy decreases slowly down to a PbO content of 40 mol.%, and then, it decreases abruptly and keeps on decreasing with the increase of
3
the PbO content. However, the binding energy of the Non-Bridging Oxygens (NBO: one oxygen linked to a network former (Si, Ge,..) and a network modifier (Na, Ca,..)) displayed the same trend (then abrupt decrease) as BO down to 40 mol.% PbO, then, it remains constant while the PbO content increases. The authors attribute this behavior to another type of NBO which are linked to two Pb in the form of Pb-O-Pb. Based upon these assumptions, they propose that the lead silicate glass network is built with PbO4 pyramids when the PbO content is higher than 40 mol.%: in this scenario, Pb acts as network former. The ability of Pb atoms to form covalent PbO4 pyramids has already been discussed by different works (Morikawa et al. (1982) from X-ray diffraction analysis; Furukawa et al. (1978), Worrell and Henshall (1978) and Ohno et al. (1991) from Raman spectroscopy investigations) and more details are given in the discussion section. In order to remove all ambiguities, we propose a new name for this type of oxygen: these NBO linked to two Pb, will be called POP oxygens. This POP oxygen is different from the so-called “free oxygen” which is cited in previous works (Bockris and
Mellors, 1956; Nesbitt and Fleet, 1980 and Hess, 1974). These free oxygens correspond to oxygen
atoms (O2-) solely bonded to Pb atoms to form Pb-O and whose proportions increase above the orthosilicate composition (then more than 65 mol.% PbO). Moreover, to explain the thermodynamic phenomena occurring in the PbO-SiO2 system, Bockris and Mellors (1956), Nesbitt and Fleet (1980) and Hess (1974) used theoretical models based on the equation (O0 + O2- = 2 O- ) to explain the depolymerization of the SiO2 network. In the present work, we want to merge these two approaches on the same glass composition to bring complementary information between macroscopic properties and nano-structural changes investigated by Raman spectroscopy.
In the different works on lead silicate glass referenced in this study, the glass synthesis were performed from reagent grades PbO and SiO2 or Pb3O4 and SiO2 (as indicated by Furukawa et al.,
1978). The different mixtures were melted in platinum crucibles except to Wang and Zhang (1996) who used silica crucibles. Most of these studies were limited to a range of compositions between 30 to 70 mol.% SiO2, according to the PbO-SiO2 phase diagram drawn by Geller et al. (1934). Geller et al. (1934) took their investigations for compositions up to 66 mol.% SiO2. Jak et al. (1997) proposed an optimized phase diagram with compositions up to pure silica. Based on a thermodynamic optimization of the experimental liquidus and activity data, Jak et al. (1997) predict the existence of a miscibility gap for the SiO2-rich compositions, but this gap has not been experimentally confirmed. Thus, it is agreed that the lower silica content limit depends on the quenching rate in order to avoid crystallization and the upper silica content limit is determined by the phase separation (Bansal and
Doremus, 1986; Hess, 1974). At a laboratory scale, we do agree with the lower limit, however we
don’t agree with the upper limit since we could synthesize lead-bearing glasses with up to 90 to 95 mol.% SiO2. Through various works and by using different spectroscopic techniques, Furukawa et al.
4
(1978), Wang and Zhang (1996), Fayon et al. (1998) highlighted the following results: i) at high SiO2
content (low lead concentration, PbO < 40 mol.%), the glass structure is close to the structure of alkali-silicate glasses and lead acts as a network modifier then implying that the glass network even depolymerized is still built with SiO4 tetrahedra; ii) at low SiO2 content (high lead concentration, PbO > 60 mol.% ), lead acts as a network former with PbOn (n=3,4) polymeric chains. Note that whether it is network former or modifier, the redox state of Pb remains (+2) (Fayon et al., 1998). In order to determine the role of lead as network modifier and/or former, the effects of increasing PbO content on PbO-SiO2, glasses have been investigated through viscosity measurements, glass transition temperatures determination and Raman spectroscopy. All the results were compared to pure SiO2 glass as a reference to explain the observed evolution.
2. Experimental method
2.1 Starting materials
In order to overcome the problem of the PbO volatilization, the glass synthesis were performed in two steps: i) first, a large batch of approximately 1.2 kilograms of PbSiO3 has been synthesized by melting mixtures of Pb3O4 and SiO2 powders in a platinum-rhodium crucible according to a standard process in the Baccarat factory: a slow rise of temperature from room temperature to 900°C (140°C above the melting point (Jak et al., 1997) during 9h (100°C/h) followed by a 9 hours plateau, then the liquid is poured in a metallic mold. After that, the glass is ground for 1h under ethanol in an agate mortar; ii) secondly, different glasses have been prepared by mixing the initial Baccarat PbSiO3 glass with SiO2 or PbO powders. The different compositions of this binary system are named PAX.00 where X corresponds to the SiO2 content in mol.%, then the PbO content in mol.% is 100X. Prior to mixing, both SiO2 and PbSiO3 powders are dried at different temperatures (1000°C and 200°C respectively) before weighting in the right proportions in order to obtain the expected compositions. All compositions were made with 100 grams of powders, which is grinded and melted again 3 times to ensure a good homogeneity. All melting operations were made in covered platinum crucible and heated at different temperatures from 1000°C to 1650°C as a function of silica content. The crucible was weighed before and after fusion and there was no significant mass loss. All samples were quenched by partially immersing the crucibles in pure water, excepted for the glass PA95.00, which was obtained using aerodynamic levitation technique (Neuville et al., 2014) and by melting 15 mg of small pieces of PA95.00 crystals already-heated at 1650°C. The heating procedure was repeated until no crystallization could be detected by optical microscope and Raman spectroscopy.
To check the homogeneity of the glasses, a mean of 10 density measurements (different pieces of the same sample) were made with Archimedean method using toluene as immersion liquid (Table
5
1). Chemical compositions have been measured by using Cameca SX100 electron microprobe at the Camparis platform (University Pierre et Marie Curie, Paris) (Table 1) with the following operating conditions: 10 nA probe current, 15 kV accelerating voltage and 10 s of counting. Chemical compositions correspond to the mean of 10-20 individual measurements.
2.2 Viscosity measurements
Viscosity measurements were made with the creep apparatus described by Neuville and Richet (1991) and Neuville (2006). This creep apparatus allows viscosity measurements from 108 to 1015 Pa.s in a temperature range between 573 K and 1173 K. The measurements were carried out on glass cylinders (3 to 9 mm in diameter and 6 to 13 mm long), obtained by coring the annealed glass. The cylinders were polished in order to obtain two parallel faces and placed between two pistons. With the aim to have a homogenous temperature along the sample, two Pt90Rh10 thermocouples are placed at the top and the bottom giving a temperature difference lower than 0.2 K. In our measurements, we have changed the applied stress from 4 MPa up to 800 MPa in order to confirm the Newtonian behavior of deformation (Neuville, 2006). A mean of eight different stresses were used at each temperature, four stresses in loading and four other in unloading. For each temperature and by changing the stress, 20 to 40 measurements were obtained and each point on a viscosity curve corresponds to the mean of them. After the experiments, a typical regular cylinder shape for all the samples was observed. By consequence, it can be confirmed that both temperature and deformation were homogenous.
2.3 Glass transition temperatures
The glass transition temperature, Tg, can be determined from the Tamman-Vogel-Fulcher (TVF) equation of viscosity (using Tgvis = T12 isokom (12 log Pa.s)), and were also measured by a 96 LINE TGA-DTA/DSC (SETARAM) with a constant heating rate (5K/min). The results are listed in Table 3 as
Tgvis and TgDSC respectively.
2.3 Raman Spectroscopy
Non-polarized Raman spectra were recorded by using a T64000 Jobin-Yvon Raman spectrometer equipped with a confocal system, a 1024 charge-couple detector cooled by liquid nitrogen and an Olympus microscope. The optimal spatial resolution allowed by the confocal system is 1-2 µm2 with a x100 Olympus objective, and the spectral resolution is 0.7 cm-1. The excitation source operating at
6
100 mW on the sample, was the 488 nm line of a coherent 70-C5 Ar+ laser. Raman spectra were acquired between 20 and 1400 cm-1 with integration time of 300 s.
The treatment of the spectra was made on the base of the change occurring on the SiO2 spectrum when we introduce PbO. The baseline was subtracted following previous works (Furukawa
et al., 1978; Worrell and Henshall, 1978; Neuville et al., 2014). The Raman spectra were normalized
to the area in order to compare the evolution of the spectra (only one normalization was undertaken even for deconvolutions). In order to study the structure of glasses, the deconvolutions were focused on the area located around 1000 cm-1, which is characteristic of SiO2 stretching vibration (Furukawa
et al., 1981; McMillan, 1984; Mysen and Frantz, 1994; Frantz and Mysen, 1995, Neuville and Mysen,
1996, Neuville, 2006). Using the method of minimization of least squares (Seifert et al., 1982; Mysen
et al., 1982, Mysen 1990) and the randomness of the residuals, the spectra were deconvoluted by
adding Gaussian bands so that their sum models the real envelope. As mentioned above, the deconvolutions were implemented based on the fitted curve of SiO2 by 3 bands (Mysen et al., 1982,
Seifert et al., 1982; Neuville and Mysen, 1996). The others bands were added as a function of the
evolution of the envelope. During curve-fitting, all bands parameters (frequency, half-width and intensity) are independent and unconstrained.
2.4 X-ray Absorption Near Edge Structure, XANES, spectra at the Pb L3-edge
The XANES spectra have been collected at the Pb L3-edge, 13035 eV, at ODE (Dispersive Optics
EXAFS) beamline (SOLEIL, France). ODE is an energy dispersive beamline with a bent Si (111) polychromator crystal at the focal point of which the sample is placed. The beam size was 30 x 30 μm (Full Width at Half Maximum, FWHM). Due to the fixed energy–position correlation in the diffracted energy band, a complete absorption spectrum was obtained from measurements of the intensity distribution on a position-sensitive detector. The Si (111) bend polychromator provides an energy resolution of ~ 1 eV at 13 keV. After calibration (by converting pixel position to energy), the background was removed and the signal normalized at the Pb L3-edge using the Athena software
(Ravel and Newville, 2005).
3. Results
3.1 Density and Molar Volume
Varshneya and Tomozawa (1994), considered a glass as a solution. As volume is the fundamental property whose variations can shed light on structural changes, it is more useful to check the evolution of the glass structure in terms of molar volume rather than density. Then, the density and
7
molar volume are plotted in Figure 1. It can be seen that the value of density increases from 2.20 103 Kg.m-3 for silica glass up to 7.301 103 Kg.m-3 for PA30.00. The density is in good agreement with previous calculated and experimental data of Nesbit and Fleet (1980) and Bockris and Mellors (1956) respectively. Furthermore in Figure 1, the evolution of the molar volume can be described in three parts: at high SiO2 content (90-100 mol.%) the molar volume is nearly constant at about 27.30 10-6 m3.mol-1; from 90 to 40 mol.% SiO
2, there is a significant decrease from 27.30 to 23.84 10-6 m3.mol-1 (about 13% decrease); and below 40 mol.% SiO2 a slight increase from 23.84 to 24.34 10-6 m3.mol-1 is observed. The fall of molar volume around 40 mol.% SiO2, is in agreement with previous data from Bockris and Mellors (1956), even though our measurements were made at room temperature, while Bockris and Mellors (1956) made their measurements at 1000 °C.
3.2 Viscosity measurements
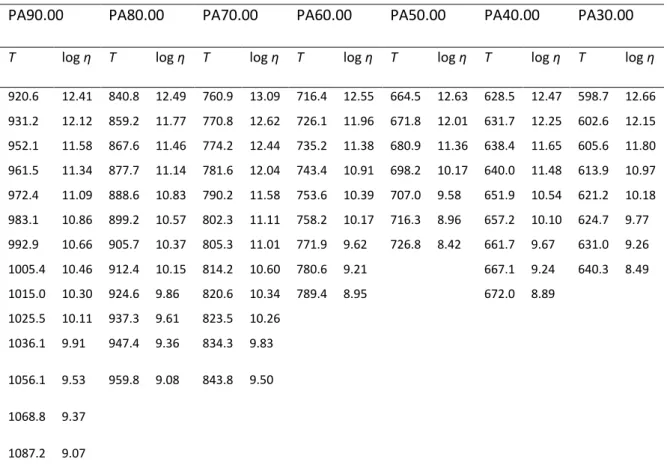
The values of all viscosity measurements carried out near the glass transition temperature are reported in Table 2 and plotted in Figure 2 as a function of reciprocal temperature (104/T, in K-1). Each temperature in the versus 104/T plot, was applied with different stresses in order to verify
that each composition well follows a Newtonian behavior. This feature proves that no crystallization is occurring during viscosity measurements, which is confirmed and checked by density measurements before and after each viscosity measurement. In Figure 2, we observe a strong difference between the most viscous composition (PA90.00) and the less viscous one (PA30.00), higher than 400 K at constant viscosity. This 400 K difference corresponds to the difference between two isokom temperatures (temperatures determined at constant viscosity). Thus, T12 isokom is the temperature when the viscosity is equal to 12 log Pa.s. A very different Arrhenian behavior is also visible as a function of silica content, where the non-Arrhenian behavior appears more and more pronounced with decreasing SiO2 content. This non-Arrhenian behavior was based on the full viscosity curve of SiO2 glass from Urbain et al. (1982) (low viscosities, in the melt; high viscosities, on glass). All viscosity curves were fitted with a TVF equation, log = A + B/(T-T1), in order to calculate the glass transition temperature (by considering Tgvis = T12). A, B and T1 are adjustable parameters and are given in Table 3, together with the glass transition temperatures obtained from viscosity and Differential Scanning Calorimetry (DSC) measurements. Both (Tgvis and TgDSC) are plotted in Figure 3 as a function of SiO2. In the latest, we observe the huge effect of increasing PbO content on lowering Tg. This effect is also visible on the glass transition temperature (Figure 3 insert). Since it was not possible to produce a piece of PA95.00 large enough for viscosity measurements, its Tg is determined only by DSC. We observe a very good agreement between the two techniques and we can show a full set of Tg variation between pure SiO2 and very depolymerized glass, PA30.00.
8
3.3 Raman spectroscopy
Normalized Raman spectra between 200 and 1300 cm-1 are plotted in Figure 4 as a function of composition. We observe that the Raman spectra display a strong change as a function of silica content. Three distinct parts are clearly visible in these Raman spectra: a low frequency part between 200 and 650 cm-1, an intermediate part between 650 and 850 cm-1 and a high frequency envelope (850 to 1300 cm-1) characteristic of Si-O-Si stretching vibrations (Brawer and White (1977), Mysen et
al. (1982), Seifert et al. (1982), Mc Millan (1984) and Neuville et al. (2014)).
Moreover, Raman spectra are made at very low frequency (20-200 cm-1, Figure 5), around the boson peak area. In the case of lead silicate glasses, the boson peak ( at 70 cm-1) of SiO2 glass disappears when adding 5 mol.% of PbO and a peak appears at 141 cm-1 with a shoulder at 100 cm-1 in the glass PA95.00. These two peaks appear directly with the incorporation of 5 mol.% PbO and they increase in intensity with increasing PbO content until PA50.00. From 50 mol.% PbO incorporated in the silicate network, the intensity of the peak at 141 cm-1 increases continuously whereas the shoulder at 100 cm-1 remains constant.
The low frequency part, 200-650 cm-1: in the pure SiO2 glass, we observe a strong band at 490 cm
-1
shouldered by another band at 450 cm-1 and a third band at 600 cm-1. These bands are characteristic of vitreous silica and have already been reported in different works (Bell and Dean,
1972; Seifert et al, 1982; Neuville and Mysen, 1996; Le Losq et al., 2014). These 3 bands are usually
assigned to the vibration of the Bridging Oxygen (BO) associated with higher-membered rings of tetrahedra in the three-dimensional silicate networks (Sharma et al., 1981, 1985; Galeener, 1982a,b;
Neuville et al. (2014) for review). Thus, these bands at 600 cm-1, 490 cm-1 and 450 cm-1 correspond to
three-, four-, and 5 and 6 membered rings of tetrahedra and are respectively called D2, D1 and R-band (Neuville et al, 2014). This difference between these bands comes from a typical T-O-T bond angles for each band according to the central force model of Sen and Thorpe (1977). In the present study, a rapid decrease of these 3 bands is observed with increasing PbO content until PA80.00 where a very large band then appears at 500 cm-1. Matson et al. (1983) have shown that the incorporation of alkali element (Li, Na, Cs, K and Rb) between 5 and 30 mol% in silica glass, produces similar changes as those observed in lead silicate glasses in the present work. However, in this work, we observe a homogenous decrease of these three bands (bands decreasing at the same time) while it is heterogeneous in the study of Matson et al. (1983).
9
Intermediate frequency region, 650-850 cm-1: in this region, we only observe an asymmetric
broad envelope at 800 cm-1 which continuously decreases and shifts to lower frequencies with increasing PbO content until 50 mol.% PbO (Table 4), then, it disappears. This envelope specific to the network of SiO2 glass is attributed to the O bond stretching involving oxygen motions in the Si-O-Si plane to which the oxygen atom moves perpendicularly (McMillan et al, 1994).
High frequency region, 850-1300 cm-1: in this region, the spectra of lead silicate glasses display
similar changes as those observed in the low frequency region, with a peak broadening and a shift to lower frequencies with increasing lead content (Figure 4). For pure SiO2, there are two broad peaks, one near 1050 cm-1 and an even less pronounced peak centered near 1200 cm-1. These two peaks are also visible in the PA95.00 Raman spectrum, but with less resolution than in the spectrum of pure SiO2 (see Figure 4, Figure 6). For the glasses with more than 5 mol.% of PbO, the high frequency region consists of an asymmetric band at 1000 cm-1 with a shoulder near 950 cm-1. The 1000 cm-1 band eventually disappears with further increase of lead content, whereas the 950 cm-1 peak grows rapidly. In addition, we observe that the peak intensity at 1000 cm-1 is increasing from PA90.00 to PA80.00 where it remains constant until PA50.00, while the peak intensity at 1200 cm-1 continues to decrease until it disappears at PA60.00. With regard to the shoulder at 950 cm-1, it continues to increase in intensity and width. For the three spectra at high lead content, there is an envelope composed of a broad peak at 930 cm-1 and a shoulder at 840 cm-1. All of these observations in the high frequency region were the starting point of the Raman spectra deconvolution.
The Raman spectra deconvolutions: it is well known that the peak areas do not give the Q species
concentrations totally (Q is a tetrahedrally coordinated cation) (Mysen, 1988), even if the model approximates well the shape of the high frequency envelope. But in these systems, we can assume that the relative cross sections do not change with composition as a first approximation (Mysen et
al., 1982). The Raman spectrum of pure silica corresponds to a fully polymerized network and one of
the first interpretations was developed by Seifert et al. (1982) based on the central-force model (Sen
and Thorpe, 1977; Galeener, 1979). Seifert et al. (1982) showed that two different structures coexist
with different inter-tetrahedral angles of these two units. Coexisting three-dimensionally interconnected structures in vitreous SiO2 have subsequently been found consistent with results from a range of spectroscopic studies (see Mysen, 1988, for review and summary of such models). More recently, this model was confirmed by several authors, using Raman spectroscopy (Le Losq and
10
Neuville, 2013, Le Losq et al., 2014, and Neuville et al., 2014 for a review). In the present study, this
model can be confirmed by the existence of 2 units, one with large angle, Q4I, at high frequency close to 1220 cm-1 and the second with small angle, Q4II, at lower frequency, around 1150 cm-1. The proportion of these 2 bands, Q4I and Q4II, varies as a function of composition (as shown in Figure 6,
and as previously demonstrated by Seifert et al. (1982), Neuville and Mysen (1996), Le Losq et al.
(2014)). The third band at 1061 cm-1 is attributed to T
2s (see Figure 6), where T2s is related to the vibrational mode of TO2 units (Le Losq et al., 2014) and corresponds to two oxygen atoms moving closer to the central Si atom while the two other oxygen atoms move away. As the frequency of this band does not change along the different compositions, we assume that the Si-O stretching bond generating this T2s band is different from the Si-O stretching of the Qn bands, where Q is a tetrahedrally coordinated cation with n Bridging Oxygens, BO, and 4-n Non-Bridging Oxygens, NBO.
With the incorporation of a little quantity of PbO (PA95.00, 5 mol.% PbO) and comparing with pure SiO2 spectrum, we observe the decrease of Q4,I band with the apparition of two new bands at 1030 cm-1 and 970 cm-1 (see Figure 6). Based on these observations and the modification of the bands at low frequencies, we believe that here we observe the process of depolymerization of the silicate network with the creation of non-bridging oxygens replacing bridging oxygens. So, the first band at 1030 cm-1, can be assigned to Si-O- stretching in structural units Q3 with one non-bridging oxygen and the second band at 970 cm-1 can be assigned to Q2 with two non-bridging oxygens. To the best of our knowledge, and except for Ohno et al. (1991) who present a deconvolution of an irradiated sample which displays 66 mol.% SiO2, the attribution of the bands as it is done in this work, has never been proposed before for the PbO-SiO2 system.
For the other compositions with increasing lead content, the depolymerization of the silicate structure still goes on and we observe successively the formation of Q1 and Q0 species with the loss of Q4 above the lead metasilicate composition. These observations are in a good agreement with those reported by Neuville et al. (2014) in silicate glasses with different alkali and earth-alkaline elements. Furthermore, the variation of these deconvolutions of Raman spectra are quite similar to those observed from Si NMR spectra by Maekawa et al. (1991) and Fayon et al. (1998), for alkali silicates and lead silicates respectively. After the deconvolutions reported in the present study, the evolution of these different bands frequencies is plotted as a function of the silica content in Figure 8. The shift of the frequency of Q4 and Q3 bands (Figure 8) is more important than for Q2 and Q1, then confirming the shifts of the spectra in Figure 4.
11
Long discussions and assumptions have been made about the role, valence, coordination number of Pb in glasses and melts. To try to answer these points, we have obtained some XANES spectra at the Pb L3 edge on ODE beamline at SOLEIL light source. From XANES spectra plotted in Figure 7, we observe that the edge and features of PbSiO3 glass are similar to alamosite mineral PbSiO3 rather than plattnerite. For alamosite mineral PbSiO3, Pb is in valence 2+ and in four fold coordination. The similarity between the glass and the mineral leads us to think that in our glasses, Pb is a divalent cation in four fold coordination according to the crystalline reference and previous work (Fayon et al., 1999). Secondly, the XANES spectra are not really affected by the increase of PbO content in silicate, excepted for the first EXAFS oscillation which shows a slight increase in energy with increasing PbO content: that feature reflects that the medium-range organization around Pb is changing a little with increasing PbO content, and probably the Pb-O-Pb fraction could be increasing with the PbO content according to Lee and Kim (2015).
4. Discussion
4.1 Viscosity, glass transition temperature
In the last section, we have presented rheological data and Raman spectroscopy data of lead silicate glasses with silica content from 30 mol.% up to 95 mol.%. Both viscosity and glass transition temperature display a strong decrease when PbO is added to the silica glass. Furthermore, in the insert of the Figure 3, we have compared the glass transition temperatures of our glasses, which have been calculated with TVF equation, Tgvis, and measured with DSC calorimeter with a heating rate of 5K/min, TgDSC, to those obtained by Neuville and Richet (1991) for Ca and Mg silicate glasses with 50 mol.% of silica and by Neuville (2005, 2006) for Na, Ca and Sr silicate glasses with 60 mol.% SiO2. With 10 mol.% PbO, the glass transition temperature decreases by more than 500 K: this effect is less important than for Na2O added in silica melts as observed by Leko et al. (1977) and Bockris et al. (1955). However, when considering the glass transition temperature, Tg, this difference between Na2O and PbO becomes smaller when the content of network modifier is getting higher: for example, with 40 mol.% of Na2O or PbO, the effect on the glass transition temperature is very close, 698 K for soda silicate compared to 725 K for lead silicate glass (Neuville, 2006 for Na, and this work for Pb). Moreover, the effect of breaking network and the creation of non-bridging oxygen atoms, are clearly visible in Figure 3. It is likely that the increasing role of PbO in the network breaking could be due to its weight. This assumption could be confirmed by comparing the lead glass transition temperature to those of earth-alkaline elements like Mg, Ca, Sr with 50 and 60 mol% SiO2 (Neuville, 2006, 2005
and Neuville and Richet, 1991) and in this case also, we observed an important effect that may be
12
to 1.3Å depending on coordination number (from 4 to 8) (Shannon, 1976) while Ca2+ is~1.0 to 1.1Å and Sr+2 is 1.2 to 1.3Å. So its field strength should be similar to Ca and Sr, while its mass (207.2 g.mol-1 vs 87.6 g.mol-1 for Sr, 40.1 g.mol-1 for Ca and 23 g.mol-1 for Na) is much greater. The effect of the element weight is clearly visible, because Pb2+ produces almost the same effect on the glass transition temperature than that produced by Na2O, which is around 300 K more than for the heavier alkaline earth elements. However, two Na = 46 g.mol-1 ~ Ca, so then it should be close to Ca, but, it’s not the case. Thus, depolymerization is more effective by two Na cations than a single Pb cation. Several authors (Furkawa et al, 1978 ; Worrell and Henshal, 1978; Zahra et al, 1993, Fayon et al., 1999) have shown that Pb can be a network former (above 60 mol.% PbO), but based upon this glass transition temperature behavior it is difficult to justify their conclusions. Indeed, even at low silica content, glass transition temperature continues to decrease.
4.2 Fragility
Plazek and Ngai (1991) have defined the fragility as the gradient of the viscosity curve as a function of the reduced temperature, at the glass transition temperature. Angell (1991) proposed a classification of liquids between strong and fragile. A strong liquid shows a linear variation of log
versus Tg/T, while this linear relation is not preserved in a fragile liquid. The configurational entropy
does control the fragility of silicate melts. The viscosities of the lead silicate melts are plotted as a function of Tg/T in Figure 9. The liquid with the highest silica content (PA90.00) displays the strongest behavior while the most fragile liquid is characterized by the highest PbO content (PA30.00). All the other chemical compositions present an intermediate behavior between PA90.00 and PA30.00. The configurational heat capacity (Cpconf) is calculated as a difference of the heat capacity of the glass at
Tg, Cp,g(Tg), and the heat capacity of the liquid, Cp,l, determined from Richet and Bottinga (1985).
Partial molar heat capacity of SiO2 for the calculations of Cp,g(Tg) was taken from Richet and Bottinga (1985) and the value of partial molar heat capacity of crystalline PbO was taken from Robie et al., (1978). The configurational heat capacity displays an increase of about 20% when PbO is added to the silica glass between PA95.00 and PA50.00, and a small decrease between PA50.00 and PA30.00. For the configurational heat capacity between PA95.00 and PA50.00, the results are in good agreement with the variation of the slope of the curve log versus Tg/T which increases with the
PbO content. However, the results between PA50.00 and PA30.00 are different and underline the limits of the calculation method.
4.3 Network polymerization
13
several orders of magnitude (Figure 2 and Figure 3). This finding suggests an increase of the disorder in the glass and/or a change in the glass network polymerization. Neuville and Mysen (1996) have shown that the variation in viscosity and/or configurational entropy can be directly correlated with structural changes observed in the Raman spectra of the glasses. From Raman spectroscopy, the network polymerization is evaluated in terms of Qn species.
Figure 4 presents Raman spectra of lead silicate glasses. As mentioned above, we focused on 3 different regions: 200-650cm-1, 650-850cm-1, 850-1300cm-1, each corresponding to different types of vibrations resulting from differences in the organization of the glass structure. The high frequency part is deconvoluted into Gaussians attributed to Qn species. Figure 10 presents the area of the Qn species plotted as a function of SiO2 content. The Q4 intensity drops a lot because the area of (Q4,I +
Q4,II) is not divided by the full envelope of SiO2 (at high frequency), as we consider that the Gaussian band at 1060 cm-1 (T2s in Figure 6) is not a part of Qn species. Thus, Q4 is 100% for pure SiO2. Discussion still remains about this T2s band. This band has been attributed to vibrations involving bridging oxygen atoms in structural units, which do not need to be fully polymerized (Mysen et al. 1982), or to vibrations of Si-O doublets associated with earth-alkaline elements (Fukumi et al. 1990;
McMillan et al. 1992). However, these latter bands are present all along the SiO2-MO join (Mysen et
al. 1982; Seifert et al. 1982; McMillan, 1984; Neuville et al. 2004, 2006, 2008 and 2014 for a review).
The presence of lead in the silicate glass affects the frequency of the T-O-T stretching vibration, in the same order than those observed by Frantz and Mysen (1995), where the heavier the M element is and more the Qn species vibrations are at low frequency.
The area of the Qn species as a function of silica content (Figure 10), shows similar variation trend than that observed for alkali or earth-alkaline elements when added to SiO2 (Neuville et al.
2014), where Q4 decreases from pure SiO2, Q3 shows an increase from 95 mol.% of silica with a maximum at 80 mol.% of SiO2. Q2 species appear at around 90 mol.% of silica and show a maximum at 50 mol.% of silica and decrease at lower silica contents. All Qn species display expected variations as a function of silica content, and follow this reaction 2Qn Qn-1 + Qn+1 with 1=n=3, which
characterizes the depolymerization processes of glasses and melts. Our results on lead silicate glasses follow a variation similar to that observed from NMR spectroscopy (Maekawa et al., 1991; and Fayon
et al. ,1998).
4.4 Very low frequency observations, and assumptions about the role of Pb in silicate glasses
The peaks (at 100 cm-1 and 141 cm-1 (Figure 5))have been already observed in Raman spectra of lead silicate glasses in different previous studies (Worrell and Henshal, 1978; Furkawa et al, 1978;
14
silicates glasses and lead silicates crystals by Furkawa et al. (1978) and on lead oxides by Worrell and Henshal (1978) and Zahra et al. (1993), the 141 cm-1 peak has been attributed to a covalent Pb-O-Pb bond in an interconnected tetragonal pyramid PbO4. Also, this peak at 141 cm-1 can be correlated to the NMR results of Lee and Kim (2015) who observed that the proportion of Pb-O-Pb increases with the PbO content. The charge balancing in the PbO4 pyramids was discussed in several X-Ray diffraction analysis (Morikawa et al., 1982, Imaoka et al, 1986). Different models are presented in these studies (PbO4 zigzag chains from Morikawa et al. (1982), screw chains PbOn polyhedra (n = 3 or 4) from Imaoka et al. (1986)), but in general the bonds connecting Pb2+ ions and oxygen atoms are not equivalent (usually two are covalent and the two others are secondary). Concerning the band at 100 cm-1, it has been attributed to ionic Pb-O bond which implies the presence of Pb2+ compensated
by O2- (Worrell and Henshal, 1978; Ohno et al., 1991). The attribution of this band can be confusing
with the description of the Pb-O bond (as presented in the introduction section) from Bockris and Mellors (1956), Nesbitt and Fleet (1980) and Hess (1974) who presented a free oxygen as an oxygen atom (O2-) solely bonded to Pb atoms and whose proportions increase above the orthosilicate composition. As the Pb-O band at 100 cm-1 remains constant along the PbO-SiO2 join and as the Pb-O-Pb band at 141 cm-1 increases above the orthosilicate composition, we suggest that the “free oxygen” as described by Bockris and Mellors (1956), Nesbitt and Fleet (1980) and Hess (1974), corresponds to the POP oxygen presented in the introduction section.
5. Conclusion
PbO-SiO2 glasses and melts have been investigated by using viscosimetry and Raman spectroscopy. Glasses with compositions ranging from 50 to 95 mol.% of SiO2 are quite easy to synthesize, but below 50 mol.% of SiO2 it is more difficult, because of a rapid crystallization. Viscosity measurements and glass transition temperature determination show a strong decrease with increasing PbO content. This feature is well correlated with the network depolymerization observed by Raman spectroscopy, which gives the evolution of Qn species from Q4 down to Q0. This is also well correlated with the variation of the fragility, which is increasing with the increase of PbO content. XANES spectroscopy suggests that Pb could display a divalent cation in silicate glasses and stay in four fold coordination. From all the observations reported in this work, we do not have the possibility to decide on the role of Pb as network former or not. In the Raman spectra, a strong band is clearly visible at 141 cm-1 and is attributed to a tetragonal pyramid, PbO4, but such tetragonal pyramids are expected to have no effect on the decreases of the glass transition temperature and of the fragility observed when PbO is added in silicate glass. The fragility continues to decrease above lead-orthosilicate compositions. These tetragonal pyramids only modify the molar volume of Pb silicate
15
glasses, which appears to increase at high PbO content. Through the different results present here and mainly the Raman bond at 141 cm-1, it can be tempting to jump to the conclusion that glass formation in the PbO-SiO2 system is not arrested by the breakdown of the SiO2 network, because this network is replaced by a PbO network. However, through the Raman deconvolutions, we suggest that even at high PbO content, a silicate network is preserved. Moreover, a four-fold coordination number for Pb in a glass could not be proposed as a proof to be a network former.
Acknowledgments
OXYMORE funding from Ile de France and ANR Dystras to support the Multi HT96 LINE TGA-DTA/DSC Setaram. Francois Baudelet and Lucie Nataf for support during ODE experiments.
Daniel Neuville thanks Eric Brient for stimulating discussions on lead silicate glass and for help at the beginning of this work.
16 References
Angell, C. A., 1991. Relaxation in liquids, polymers and plastic crystals strong/fragile patterns and problems. Journal of Non-Crystalline Solids 131-133, 13-31.
Bansal, N. P., Doremus, R. H., 1986. Handbook of Glass Properties Academic. Orlando. p55.
Bell, R.J., Dean, P., 1972. Localization of phonons in vitreous silica and related glasses, In: Douglas,R.W., Ellis, B. (Eds.),International Conference on the Physics of Non-Crystalline Solids,3rd. Wiley-Interscience, pp. 443–452.
Bockris, J. M., Mackenzie, J. D., Kitchener, J. A., (1955). Viscous flow in silica and binary liquid silicates. Transactions of the Faraday Society 51, 1734-1748.
Bockris, J. O., Mellors, G. W., 1956. Electric Transport in Liquid Lead Silicates and Borates. The Journal of Physical Chemistry 60, 1321-1328.
Brawer, S. A., & White, W. B., 1977. Raman spectroscopic investigation of the structure of silicate glasses (II). Soda-alkaline earth-alumina ternary and quaternary glasses. Journal of Non-Crystalline Solids 23, 261-278.
Fayon, F., Bessada, C., Massiot, D., Farnan, I., Coutures, J. P., 1998. 29Si and 207Pb NMR study of local order in lead silicate glasses. Journal of Non-Crystalline Solids 232, 403-408.
Fayon, F., Landron, C., Sakurai, K., Bessada, C., Massiot, D., 1999. Pb2+ environment in lead silicate glasses probed by Pb-LIII edge XAFS and 207Pb NMR. Journal of non-crystalline solids 243, 39-44.
Feller, S., Lodden, G., Riley, A., Edwards, T., Croskrey, J., Schue, A., Liss, D., Stentz, D., Blair, S., Kelley, M., Smith, G., Singleton, S., Affatigato, M., Holland, D., Smith, M.E., Kamitsos, E.L., Varsamis, C.P.E., Loannou, E., 2010. A multispectroscopic structural study of lead silicate glasses over an extended range of compositions. Journal of Non-Crystalline Solids 356, 304-313.
Frantz, J. D., Mysen, B. O., 1995. Raman spectra and structure of BaO-SiO2 SrO-SiO2 and CaO-SiO2 melts to 1600°C. Chemical Geology 121, 155-176.
Fukumi, K., Hayakawa, J., & Komiyama, T., 1990. Intensity of Raman band in silicate glasses. Journal of Non-Crystalline Solids 119, 297-302.
Furukawa, T., Brawer, S.A., White, W.B., 1978. The structure of lead silicate glasses determined by vibrational spectroscopy. Journal of Materials Science 13, 268-282.
17
Furukawa, T., Fox, K. E., White, W. B., 1981. Raman spectroscopic investigation of the structure of silicate glasses. III. Raman intensities and structural units in sodium silicate glasses. The Journal of Chemical Physics 75, 3226-3237.
Galeener, F.L., 1979. Band limits and the vibrational spectra of tetrahedral glasses. Physical Review B 19, 4292–4397.
Galeener, F.L., 1982a. Planar rings in vitreous silica. Journal of Non-Crystalline Solids 49, 53–62.
Galeener, F.L., 1982b. Planar rings in glasses. Solid State Communications 44, 1037–1040.
Geller, R. F., Creamer, A. S., & Bunting, E. N., 1934. The System PbO-SiO2. Journal of Research of the National Bureau of Standards 13(2), 237-244.
Gupta, S. K., 1995. Viscosity of PbO-SiO2 melts. Metallurgical and Materials Transactions B 26(2), 281-287.
Hess, P. C., 1975. PbO-SiO2 melts: structure and thermodynamics of mixing. Geochimica et Cosmochimica Acta 39(5), 671-687.
Imaoka, M., Hasegawa, H., Yasui, I., 1986. X-ray diffraction analysis on the structure of the glasses in the system PbO-SiO2. Journal of non-crystalline solids 85(3), 393-412.
Jak, E., Hayes, P. C., Degterov, S., Pelton, A. D., Wu, P., 1997. Thermodynamic optimization of the systems PbO-SiO2, PbO-ZnO, ZnO-SiO2 and PbO-ZnO-SiO2. Metallurgical and Materials Transactions B 28(6), 1011-1018.
Karnis, A., Gautron, L., 2009. Promising immobilization of cadmium and lead inside Ca-rich glass-ceramics. Solid waste management: Waste valorization. International Journal of Civil and Environmental Engineering, ISSN: 2010-3883, 1(4), 210-213.
Le Losq, C., & Neuville, D. R., 2013. Effect of the Na/K mixing on the structure and the rheology of tectosilicate silica-rich melts. Chemical Geology 346, 57-71.
Le Losq, C., Neuville, D. R., Florian, P., Henderson, G. S., Massiot, D., 2014. The role of Al3+ on rheology and structural changes in sodium silicate and aluminosilicate glasses and melts. Geochimica et Cosmochimica Acta 126, 495-517.
Lee, S. K. and Kim, E. J., 2015. Probing Metal-Bridging Oxygen and Configurational Disorder in Amorphous Lead Silicates: Insights from 17O Solid-State Nuclear Magnetic Resonance. The Journal of Physical Chemistry C 119, 748-756.
18
Leko, V. K., Gusakova, N. K., Meshcheryakova, E. V., Prochorova, T. I., 1977. The effect of impurity alkali oxides, hydroxyl groups, Al2O3 and Ga2O3 on the viscosity of glass forming silica. Fiz. Chim. Stekla 3, 219-226.
Maekawa, H., Maekawa, T., Kawamura, K., Yokokawa, T., 1991. The structural groups of alkali silicate glasses determined from 29Si MAS-NMR. Journal of Non-Crystalline Solids 127, 53-64.
Matson, D. W., Sharma, S. K., Philpotts, J. A., 1983. The structure of high-silica alkali-silicate glasses. A Raman spectroscopic investigation. Journal of Non-Crystalline Solids 58, 323-352.
McMillan, P.F., 1984. Structural studies of silicate glasses and melts–Applications and limitations of Raman spectroscopy. American Mineralogist 69, 622–644.
McMillan, P. F., Wolf, G. H., Poe, B. T., 1992. Vibrational spectroscopy of silicate liquids and glasses. Chemical Geology 96, 351-366.
McMillan, P. F., Poe, B. T., Gillet, P. H., Reynard, B., 1994. A study of SiO2 glass and supercooled liquid to 1950 K via high-temperature Raman spectroscopy. Geochimica et Cosmochimica Acta 58, 3653-3664.
Morikawa, H., Takagi, Y., Ohno, H., 1982. Structural analysis of 2PbO.SiO2 glass. Journal of Non-Crystalline Solids 53, 173-182.
Mysen, B. O., Finger, L. W., Virgo, D., Seifert, F. A., 1982. Curve-fitting of Raman spectra of silicate glasses. American Mineralogist 67, 686-695.
Mysen, B.O., 1988. Structure and Properties of Silicate Melts. Elsevier. 354 pp.
Mysen, B.O., 1990. The role of aluminum in depolymerized, peralkaline aluminosilicate melts in the systems Li2O–Al2O3–SiO2, Na2O–Al2O3–SiO2 and K2O–Al2O3–SiO2. American Mineralogist 75, 120– 134.
Mysen, B. O., Frantz, J. D., 1994. Silicate melts at magmatic temperatures: in-situ structure determination to 1651°C and effect of temperature and bulk composition on the mixing behavior of structural units. Contributions to Mineralogy and Petrology 117, 1-14.
Nesbitt, H. W., Fleet, M. E., 1981. An ion-association model for PbO-SiO2 melts: Interpretation of thermochemical, conductivity, and density data. Geochimica et Cosmochimica Acta 45, 235-244.
Neuville, D.R., Richet, P., 1991. Viscosity and mixing in molten (Ca, Mg) pyroxenes and garnets. Geochimica et Cosmochimica Acta 55, 1011–1019.
19
Neuville, D. R., & Mysen, B. O., 1996. Role of aluminium in the silicate network: In situ, high-temperature study of glasses and melts on the join SiO2-NaAlO2. Geochimica et Cosmochimica Acta 60, 1727-1737.
Neuville, D. R., Cormier, L., Massiot, D., 2004. Role of aluminium in peraluminous region in the CAS system. Geochim. Cosmochim. Acta 68, 5071-5079.
Neuville, D.R., 2005. Structure and properties in (Sr, Na) silicate glasses and melts. Physics and Chemistry of Glasses 46, 112–118.
Neuville, D. R., 2006. Viscosity, structure and mixing in (Ca, Na) silicate melts. Chemical Geology 229, 28-41.
Neuville DR, Cormier L, Montouillout V, Florian P, Millot F, Rifflet JC, Massiot D, 2008. Structure of Mg- and Mg/Ca aluminosilicate glasses: 27Al NMR and Raman spectroscopy investigations. American Mineralogist 93, 1721–1731.
Neuville, D. R., De Ligny, D., Henderson, G. S., 2014. Advances in Raman spectroscopy applied to earth and material sciences. Reviews in Mineralogy and Geochemistry 78, 509-541.
Ohno, H., Nagasaki, T., Igawa, N., Kawamura, H., 1991. Neutron irradiation effects of PbO-SiO2 glasses. Journal of Nuclear Materials 179, 473-476.
Patterson, C., 1956. Age of meteorites and the earth. Geochimica et Cosmochimica Acta 10, 230-237.
Ravel, B., Newville, M., 2005. ATHENA, ARTHEMIS, HEPHAESTUS: Data analysis for X-ray absorption spectroscopy using IFEFFIT. Journal of Synchrotron Radiation 12, 537–541.
Robie, R. A., Hemmingway, B. S., Fisher, J. R., 1978. Thermodynamic properties of minerals and related substances at 298.15 K and 1 bar (105 Pascals) pressure and at higher temperature. Geological Survey Bulletin 1452, 205-209.
Richet, P., Bottinga, Y., 1985. Heat capacity of aluminum-free liquid silicates. Geochimica et Cosmochimica Acta 49, 471–486.
Seifert, F. A., Mysen, B. O., Virgo, D., 1982. Three-dimensional network structure of quenched melts (glass) in the systems SiO2-NaAl2, SiO2-CaAl2O4 and SiO2-MgAl2O4. American Mineralogist 67(7-8), 696-717.
Sen, P. N., Thorpe, M. F., 1977. Phonons in AX2 glasses: From molecular to band-like modes. Physical Review B 15(8), 4030.
20
Sharma, S. K., Mammone, J. F., Nicol, M. F., 1981. Raman investigation of ring configurations in vitreous silica. Nature 292,140-141.
Sharma, S. K., Philpotts, J. A., Matson, D. W., 1985. Ring distributions in alkali-and alkaline-earth aluminosilicate framework glasses-a Raman spectroscopic study. Journal of Non-Crystalline Solids 71, 403-410.
Shannon, R. T., 1976. Revised effective ionic radii and systematic studies of interatomic distances in halides and chalcogenides. Acta Crystallographica Section A: Crystal Physics, Diffraction, Theoretical and General Crystallography 32(5), 751-767.
Smets, B. M. J., Lommen, T. P. A., 1982. The structure of glasses and crystalline compounds in the system PbO-SiO2, studied by X-ray photoelectron spectroscopy. Journal of Non-Crystalline Solids 48, 423-430.
Urbain, G., Bottinga, Y., Richet, P., 1982. Viscosity of liquid silica, silicates and alumino-silicates. Geochimica et Cosmochimica Acta 46(6), 1061-1072.
Varshneya, A. K., 1994. Density and Molar Volume, in: Varshneya, A. K., Tomozawa, M. Fundamentals of inorganic glasses. Journal of Non-Crystalline Solids, 149-159.
Worrell, C. A., Henshall, T., 1978. Vibrational spectroscopic studies of some lead silicate glasses. Journal of Non-Crystalline Solids 29, 283-299.
Wang, P. W., Zhang, L., 1996. Structural role of lead in lead silicate glasses derived from XPS spectra. Journal of non-crystalline solids 194, 129-134.
Zahra, A. M., Zahra, C. Y., Piriou, B., 1993. DSC and Raman studies of lead borate and lead silicate glasses. Journal of Non-Crystalline Solids 155, 45-55.
21 TABLES
Table 1: Chemical compositions and density of lead-silicate glasses (Uncertainties are given in parentheses). wt.% SiO2 wt.% PbO d (103 kg.m-3) PA95.00 85.04 (67) 12.07 (45) 2.420 (1) PA90.00 68.30 (20) 29.09 (39) 2.810 (4) PA80.00 50.66 (82) 48.19 (85) 3.470 (3) PA70.00 38.76 (33) 61.13 (70) 4.241 (8) PA60.00 28.34 (14) 72.04 (52) 5.130 (1) PA50.00 20.49 (10) 80.41 (60) 5.974 (8) PA40.00 15.33 (12) 84.65 (51) 6.630 (3) PA33.00 10.69 (12) 87.72 (1.15) 7.089 (7) PA30.00 9.22 (24) 88.72 (0.29) 7.301 (6)
22
Table 2: Viscosity measures performed on PA.X.Y glasses. The viscosities are in log Pa.s and T in K. error on measures is equal to 0.02 log Pa.s.
PA90.00 PA80.00 PA70.00 PA60.00 PA50.00 PA40.00 PA30.00
T log η T log η T log η T log η T log η T log η T log η
920.6 12.41 840.8 12.49 760.9 13.09 716.4 12.55 664.5 12.63 628.5 12.47 598.7 12.66 931.2 12.12 859.2 11.77 770.8 12.62 726.1 11.96 671.8 12.01 631.7 12.25 602.6 12.15 952.1 11.58 867.6 11.46 774.2 12.44 735.2 11.38 680.9 11.36 638.4 11.65 605.6 11.80 961.5 11.34 877.7 11.14 781.6 12.04 743.4 10.91 698.2 10.17 640.0 11.48 613.9 10.97 972.4 11.09 888.6 10.83 790.2 11.58 753.6 10.39 707.0 9.58 651.9 10.54 621.2 10.18 983.1 10.86 899.2 10.57 802.3 11.11 758.2 10.17 716.3 8.96 657.2 10.10 624.7 9.77 992.9 10.66 905.7 10.37 805.3 11.01 771.9 9.62 726.8 8.42 661.7 9.67 631.0 9.26 1005.4 10.46 912.4 10.15 814.2 10.60 780.6 9.21 667.1 9.24 640.3 8.49 1015.0 10.30 924.6 9.86 820.6 10.34 789.4 8.95 672.0 8.89 1025.5 10.11 937.3 9.61 823.5 10.26 1036.1 9.91 947.4 9.36 834.3 9.83 1056.1 9.53 959.8 9.08 843.8 9.50 1068.8 9.37 1087.2 9.07
23
Table 3: TVF parameters of the viscosity calculated with TVF equation, TgDSC determined with DSC with a heating rate of 5K/min. Data in log Pa.s and K.
PA95.00 PA90.00 PA80.00 PA70.00 PA60.00 PA50.00 PA40.00 PA33.00 PA30.00
A 0.85 0.93 -7.61 -0.21 -14.199 -25.41 -16.41 B 4801.6 3329 8129.3 2337 8939.6 15651 7174 T1 504.6 552.2 368.3 533.5 331 215.9 351.6 Tgvis 935.2 853.0 782.7 724.8 672.2 634.1 604.0 TgDSC 1305.8 961.9 854.5 800.1 748.1 700.4 657.1 635.1 624.5
24
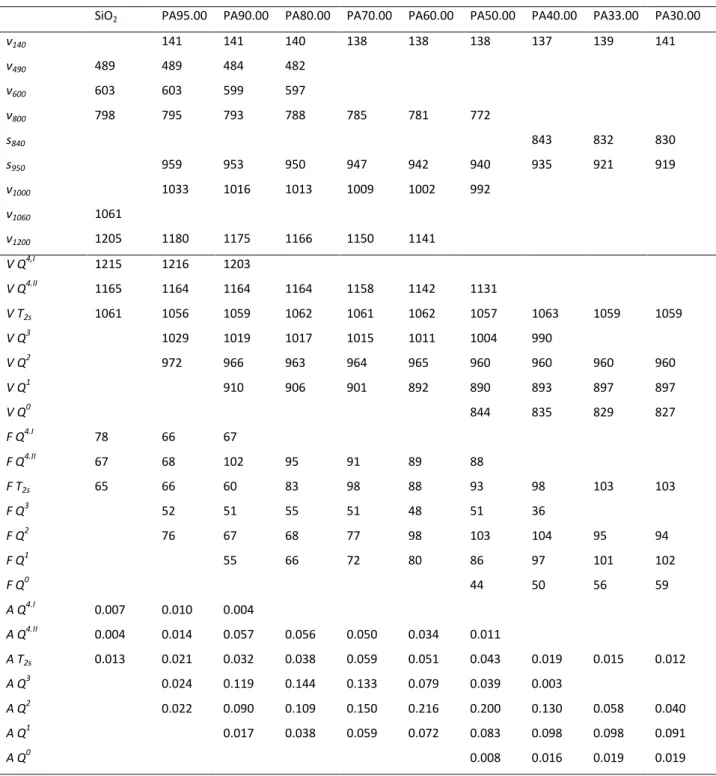
Table 4: Frequencies of peaks obtained by differentiation of Raman spectra and Raman bands obtained from the deconvolution fits (data in cm-1).
SiO2 PA95.00 PA90.00 PA80.00 PA70.00 PA60.00 PA50.00 PA40.00 PA33.00 PA30.00
ν140 141 141 140 138 138 138 137 139 141 ν490 489 489 484 482 ν600 603 603 599 597 ν800 798 795 793 788 785 781 772 s840 843 832 830 s950 959 953 950 947 942 940 935 921 919 ν1000 1033 1016 1013 1009 1002 992 ν1060 1061 ν1200 1205 1180 1175 1166 1150 1141 V Q4,I 1215 1216 1203 V Q4.II 1165 1164 1164 1164 1158 1142 1131 V T2s 1061 1056 1059 1062 1061 1062 1057 1063 1059 1059 V Q3 1029 1019 1017 1015 1011 1004 990 V Q2 972 966 963 964 965 960 960 960 960 V Q1 910 906 901 892 890 893 897 897 V Q0 844 835 829 827 F Q4.I 78 66 67 F Q4.II 67 68 102 95 91 89 88 F T2s 65 66 60 83 98 88 93 98 103 103 F Q3 52 51 55 51 48 51 36 F Q2 76 67 68 77 98 103 104 95 94 F Q1 55 66 72 80 86 97 101 102 F Q0 44 50 56 59 A Q4.I 0.007 0.010 0.004 A Q4.II 0.004 0.014 0.057 0.056 0.050 0.034 0.011 A T2s 0.013 0.021 0.032 0.038 0.059 0.051 0.043 0.019 0.015 0.012 A Q3 0.024 0.119 0.144 0.133 0.079 0.039 0.003 A Q2 0.022 0.090 0.109 0.150 0.216 0.200 0.130 0.058 0.040 A Q1 0.017 0.038 0.059 0.072 0.083 0.098 0.098 0.091 A Q0 0.008 0.016 0.019 0.019
25 Figures Captions:
Figure 1. Variation of the density and molar volume as a function of mol.% SiO2, open symbol and star correspond, respectively, to the results from Nesbitt and Fleet (1980) and Bockris and Mellors (1956).
Figure 2. Viscosity measurements (in log Pa.s) of PA.X.00 samples as a function of the reciprocal temperature.
Figure 3. Evolution of glass transition temperature as a function of mol.% SiO2 calculated from the TVF equation of viscosity measurements and determined by DSC. Values for Ca and Mg silicate glasses with 50 mol.% of silica are from Neuville and Richet (1991); for Na, Ca and Sr silicate glasses with 60 SiO2 mol.%, the results are from Neuville (2005, 2006).
Figure 4. Unpolarized Raman spectra for lead-silicate glasses normalized in area.
Figure 5. Very low frequency part of the Raman spectra of lead-silicate glasses.
Figure 6. Deconvolution of the 850-1300 cm-1 Raman spectra of the lead-Ssilicate glasses.
Figure 7. XANES spectra at the Pb L3 edge for alamosite crystal and lead silicate glasses.
Figure 8. Variation of band and shoulder frequencies as a function of silica content.
Figure 9. Viscosity of lead silicate glasses as a function of Tg/T.
26 Figure 1 0 10 20 30 40 50 60 70 80 90 100 2 3 4 5 6 7 8 23.5 24.0 24.5 25.0 25.5 26.0 26.5 27.0 27.5 mol% SiO2
De
ns
ity, 1
0
3Kg/m
3M
ola
r Vo
lum
e, 10
-6m
3/mo
l
27
28 Figure 3:
20
30
40
50
60
70
80
90
100
600
700
800
900
1000
1100
1200
1300
1400
Na MgCa Mg Ca CaT
gvisT
g
, K
mol% SiO
2T
gDSC Sr29
30 Figure 5
50
100
150
200
250
In
te
n
si
ty
, a
.u
.
Wavenumber, cm-1
PA90.00
PA80.00
PA70.00
PA60.00
PA50.00
PA40.00
PA30.00
PA33.00
PA95.00
SiO
2-glass
31 Figure 6: 0 5x10⁻⁵ 1x10⁻⁴ 2x10⁻⁴ 2x10⁻⁴ 700 750 800 850 900 950 1000 1050 1100 1150 1200 1250 1300 -2x10⁻⁵ 0 2x10⁻⁵ 0 5x10⁻⁴ 1x10⁻³ 2x10⁻³ 2x10⁻³ 3x10⁻³ 700 750 800 850 900 950 1000 1050 1100 1150 1200 1250 1300 -5x10⁻⁵ 0 5x10⁻⁵ 0 1x10⁻³ 2x10⁻³ 3x10⁻³ 700 750 800 850 900 950 1000 1050 1100 1150 1200 1250 1300 -5x10⁻⁵ 0 5x10⁻⁵ 0,0 5,0x10⁻⁴ 1,0x10⁻³ 1,5x10⁻³ 2,0x10⁻³ 700 750 800 850 900 950 1000 1050 1100 1150 1200 1250 1300 -4x10⁻⁵ -2x10⁻⁵ 0 2x10⁻⁵ 4x10⁻⁵ 0,0 5,0x10⁻⁴ 1,0x10⁻³ 1,5x10⁻³ 700 750 800 850 900 950 1000 1050 1100 1150 1200 1250 1300 -4x10⁻⁵ -2x10⁻⁵ 0 2x10⁻⁵ 4x10⁻⁵ 0,0 2,0x10⁻⁴ 4,0x10⁻⁴ 6,0x10⁻⁴ 8,0x10⁻⁴ 1,0x10⁻³ 1,2x10⁻³ 700 750 800 850 900 950 1000 1050 1100 1150 1200 1250 1300 -2x10⁻⁵ 0 2x10⁻⁵ 0 1x10⁻³ 2x10⁻³ 3x10⁻³ 700 750 800 850 900 950 1000 1050 1100 1150 1200 1250 1300 -1x10⁻⁴ -5x10⁻⁵ 0 5x10⁻⁵ 1x10⁻⁴ 0 1x10⁻³ 2x10⁻³ 3x10⁻³ 700 750 800 850 900 950 1000 1050 1100 1150 1200 1250 1300 -5x10⁻⁵ 0 5x10⁻⁵ 0,0 2,0x10⁻⁴ 4,0x10⁻⁴ 6,0x10⁻⁴ 8,0x10⁻⁴ 1,0x10⁻³ 700 750 800 850 900 950 1000 1050 1100 1150 1200 1250 1300 -2x10⁻⁵ 0 2x10⁻⁵ 0 2x10⁻⁴ 4x10⁻⁴ 6x10⁻⁴ 700 750 800 850 900 950 1000 1050 1100 1150 1200 1250 1300 -4x10⁻⁵ -2x10⁻⁵ 0 2x10⁻⁵ 4x10⁻⁵ SiO2 In te n si ty , a .u . T2s Q4,II Q 4,I Residues Wavenumber, cm-1 PA95.00 Q1 PA90.00 In te n si ty , a .u . Q4,I Q4,II T2s Q3 Q2 Residues Wavenumber, cm-1 PA60.00 In te n si ty , a .u . Q4,II T2s Q3 Q2 Q1 T2b Residues Wavenumber, cm-1 Q0 PA50.00 In te n si ty , a .u . Q4,II T2s Q3 Q2 Q1 T2b Residues Wavenumber, cm-1 PA40.00 In te n si ty , a .u . Q0 Q1 Q2 Q3 T2s Residues Wavenumber, cm-1 PA33.00 In te n si ty , a .u . Q0 Q1 Q2 T2s Residues Wavenumber, cm-1 T2b PA80.00 In te n si ty , a .u . Q1 Q2 Q3 T2s Q 4,II Residues Wavenumber, cm-1 PA70.00 In te n si ty , a .u . T2b Q1 Q2 Q3 T2s Q4,II Residues Wavenumber, cm-1 PA30.00 In te n si ty , a .u . Q0 Q1 Q2 T2s Residues Wavenumber, cm-1 In te n si ty , a .u . Q4,I Q4,II T2s Q3 Q2 Residues Wavenumber, cm-1
32
33 Figure 8:
700
800
900
1000
1100
1200
20
30
40
50
60
70
80
90
100
F
re
q
u
en
cy
, c
m
-1mol % SiO
2Q
4IQ
3Q
2Q
1Q
0T
2bT
2sQ
4II34 Figure 9: 0.858 0.90 0.95 1.00 1.05 9 10 11 12 13 PA30.00 PA40.00 PA50.00 PA60.00 PA70.00 PA80.00 PA90.00
Visco
sity
, log
Pa.s
T
g/T
35 Figure 10: