Creating custom ETFs and exploring performance versus peers and the iBoxx index
By
MASSACHUSETTS INSTITUTE
OF TECHNOLOGY
Vineet Khattar
JUN 0 8 2016
Post Graduate Program in Management
LIBRARIES
Indian School of Business, 2013
ARCHIVES
SUBMITTED TO THE MIT SLOAN SCHOOL OF MANAGEMENT
IN PARTIAL FULFILLMENT OF THE REQUIREMENTS FOR THE
DEGREE OF
MASTER OF SCIENCE IN MANAGEMENT STUDIES
AT THE
MASSACHUSETTS INSTITUTE OF TECHNOLOGY
June 2016
C2016 Vineet Khattar. All Rights Reserved.
The author hereby grants to MIT permission to reproduce and to
distribute publicly paper and electronic copies of this thesis document in
whole or in part in any medium now known or hereafter created.
Signature of Author:
Signature redacted
MIT Sloan School of Management
May 06, 2016
Certified By:
Signature redacted
Professor Deborah LLucas
Sloan Distinguished Professor of Finance
Director of MIT Center for Finance and Policy
Thesis Supervisor
Accepted By:
Signature redacted
Professor Rodrigo S. Verdi
Program Director, MS in Management Studies
MIT Sloan School of Management
MITLibraries
77 Massachusetts Avenue
Cambridge, MA 02139
http://Ilibraries.mit.edu/ask
DISCLAIMER NOTICE
Due to the condition of the original material, there are unavoidable
flaws in this reproduction. We have made every effort possible to
provide you with the best copy available.
Thank you.
The images contained in this document are of the
Creating custom ETFs and exploring performance versus peers and the iBoxx index
By
Vineet Khattar
Submitted to the MIT Sloan School of Management on May 06, 2016 in partial fulfillment of the
requirements for the degree of Master of Science in Management Studies
ABSTRACT
The global financial crisis and following bond buyback actions and quantitative easing announcements
by the ECB have led to strong demand for fixed income investments, particularly in Europe. This has
increased demand for both active and passive fixed income funds. In this thesis, I review the Markit EUR
Corporate Index, iShares (a passive index tracker fund) and several actively managed European
investment grade-focused commercial bond funds. I propose new custom bond funds based on
quantitative strategies using the bond constituents of Markit iBoxx index. I then compare the
performance of these custom bond funds with the benchmark Markit EUR Corporate index, the passive
tracker fund and the active bond funds. I highlight the strength of simple strategies which often perform
at least as well as the index and the active bond funds.
Thesis Supervisor:
Professor Deborah
Lucas
Title:
Sloan Distinguished Professor of Finance
Director of MIT Center for Finance and Policy
MIT Sloan School of Management
ACKNOWLEDGEMENTS
I will like to thank Professor Deborah Lucas for mentoring me for this thesis. She helped me in narrowing
the thesis scope and deciding on the issues that I want to address. I am very grateful for her incredible
support and very kind words. I will also like to thank Senior Lecturer Walter Torous for providing
valuable feedback on my thesis.
Additionally, I will like to thank my wife whose love, care and kindness has supported me during the past
one year at MIT. Lastly, I will like to thank my parents for inspiring me to keep working towards
achieving my dream and never settling for anything less.
Table of Contents
ACKNOW LEDGEM ENTS... 4
OVERVIEW ... 9
1.
Introduction...9
II.
Thesis Significance ...
9
Ill.
Organization of Thesis ... 10INTRODUCTION TO THE BENCHMARK INDEX, TRACKER FUND AND ACTIVE BOND FUNDS ... 11
1.
Benchm ark Index...1111.
Benchm ark Tracker...12Ill. Active Bond Funds...12
IV. Returns calculation...14
DATA AND M ETHODOLOGY ... 16
1.
Data Source ... 16II.
Data Cleaning...16111.
Index Construction M ethodologies ... 16CUSTOM INDEX FROM RANDOM SELECTION OF TWO HUNDRED BONDS...19
. Introduction...19
11.
R a tio n a le ... 1 9 IlIl. M ethodology for data selection and index construction ... 19IV. Comparison of the monthly return performance of custom indices vs the monthly return perform a nce
of
all indices ... 20V. Additional observations... 22
SELECTING UNDERPERFORMING BONDS FOR INDEX CONSTRUCTION ... 25
1.
Introduction:...25II.
R a tio n ale
:...2 5 Ill. M ethodology for bond selection ... 25IV. Comparison of the monthly return performance of custom indices vs the monthly return perform a nce
of
all indices ... 26V. Additional observations... 28
SELECTING THE CHEAPEST BONDS RELATIVE TO DURATION FOR INDEX CONSTRUCTION...33
1.
Introduction:...33II.
R a tio n ale
... 3 3Ill. M ethodology for data selection and index construction ... 33
IV. Comparison of the monthly return performance of custom indices vs the monthly return performance
of
all indices ... 34V. Additional observations... 35
SELECTING M OST LIQUID BONDS FOR INDEX CONSTRUCTION ... 41
. Intro d u ctio n :...4 1
II.
R atio n ale
:...4 1 Ill. M ethodology for bond selection... 41IV. Comparison of the monthly return performance of custom indices vs the monthly return performa nce
of
allindices
... 42V. Additional observations... 44
SELECTING CHEAPEST BONDS RELATIVE TO DEFAULT PROBABILITY FOR INDEX CONSTRUCTION...50
1.
In tro d u ctio n :...5 0II.
R atio n ale
:...5 0 Ill. M ethodology for bond selection... 50IV. Comparison of the monthly return performance of custom indices vs the monthly return performa nce
of
allindices
... 51V. Additional observations... 57
CONCLUSIONS... 62
I. Active bond funds do not statistically outperform ... 62
I.
Returns for active bond funds - highly correlated with the returns of the benchmark index ... 62Ill. Notional weighted indices (Spread-Duration strategy) outperform the iShares index ... 62
LIM IT A T IO N S ... 6 2 N EX T ST E P
S
... 6 3 APPENDIX A: LIST OF TABLES ... 65APPENDIX B: LIST OF CHARTS ... 66
APPENDIX C: M ARKITC FINANCIALS INDEX DE0006301591] ... 68
APPENDIX D: REFERENCES ... 69
APPENDIX E: NORM ALITY CHARTS...70
APPENDIX F: RANDOM SELECTION STRATEGY: PAIRED T-TESTS...77
APPENDIX G: ONE MONTH UNDERPERFORMING SELECTION STRATEGY: PAIRED T-TESTS...85
APPENDIX
I:
LIQUID BOND SELECTION STRATEGY: PAIRED T-TESTS ... 101 APPENDIX J: SPREAD-PD SELECTION STRATEGY: PAIRED T-TESTS... 109CHAPTER
1
OVERVIEW
1.
Introduction
Over the past few years, there has been significant growth in demand for fixed income and fixed
income related investment products in Europe. Many factors have fueled this growth, including
and not limited to the financial crisis, the Greek debt crisis, and the consequent recession which
have forced investors into a capital preservation mode. These factors, coupled with the
European Central Bank's actions on reducing interest rates and consecutive bond buying
announcements for both sovereign and corporate bonds, have pushed sovereign yields into
negative territory and have brought corporate yields to all-time lows across the credit and the
duration curves. These actions have further pushed up both the demand for and issuance of
fixed income products in Europe, but overall have resulted in significantly lower liquidity.
Against this backdrop of increased demand and reduced liquidity, a number of fixed income
ETFs and active bond funds have been created which aim to provide investors with exposure to
European credit with increased liquidity. We examine some of these commercial products which
are geared towards the European investment grade sector, and propose quantitative
investment strategies that may have the potential to produce superior investment results.
11.
Thesis Significance
In this thesis, I have studied various approaches for constructing fixed income indices from
publicly available information. I have done this with the aim of comparing their returns and risk
with those of benchmark index and actively managed funds, and evaluating whether there is
value added by actively managed funds. Hence this thesis provides information on the
IlL
Organization of Thesis
The thesis is divided into a number of chapters. Chapter 2 describes the benchmark index, the
index tracker and the active bond funds which are used for comparison with our proposed
investment strategies. Chapter 3 discusses the data sourcing, cleaning and methodology of
index construction and returns calculations. Chapter 4 proposes a custom bond index based on
random selection. Chapter 5 analyzes the performance of a bond index based on selection of
underperforming bonds on a monthly basis. Chapter 6 analyzes the performance of a bond
index based on selecting cheapest bonds relative to their duration. Chapter
7
analyzes the
performance of a fixed income index based on selection of the most liquid bonds. Chapter 8
analyzes the performance of an index based on selection of cheapest bonds relative to their
probability of default. Chapter 9 summarizes the results across all of the proposed indices.
Chapter 10 discusses the limitations and future direction of this project, while the last Chapter
11 includes appendices and a list of tables and figures.
CHAPTER
2
INTRODUCTION TO THE BENCHMARK INDEX, TRACKER FUND AND
ACTIVE BOND FUNDS
My custom indices will be compared with the Markit EUR benchmark index, benchmark tracker iShares
EUR index and several active bond funds, all of which are briefly described in this Chapter:
1.
Benchmark Index
I
take the Markit EUR Corporate iBoxx (ISIN: DE0006301161) as the benchmark index. I also use
the index constituents as the source of the bonds selected for all tested strategies. The index
consists of European investment grade bonds chosen using index selection rules prescribed by
Markit and rebalanced on a monthly basis. The typical number of bonds in the index ranges
from 1250 to more than 1700 every month.
A variety of fixed rate bonds with cash flow denominated in Euros are eligible for selection for
the benchmark index. However sinking funds, amortizing bonds, FRNs and fixed-to-floater
bonds, convertibles, CDOs, retail bonds, private placements, subordinated bank or insurance
debt with mandatory contingent conversion features or with any conversion options before the
first call date are excluded from selection.
Eligible bonds are then further shortlisted for the index construction based on set of
pre-determined rules including consideration for bond type, credit rating, time to maturity, amount
outstanding and industry and country concentration levels among other factors. For example, all
bonds selected for the iBoxx EUR index have an internal investment grade rating which is linked
to the rating of the Standard & Poor rating, Fitch rating and Moody's rating. All of these bonds
also have at least a year to maturity at the rebalancing date and amount outstanding of at least
EUR500m.
The selected bonds are weighted on a market capitalization basis to construct the index and the
index is rebalanced at the beginning of every month. Cash from coupon payments and from
liquidated bonds that could not be used to buy other bonds is invested in money market
instruments at the end of each month until the following month at which point it is reinvested
back into the index.
IL.
Benchmark Tracker
Corporate iShares Euro Corporate Bond Large Cap UCITS ETF is an open-end, UCITS compliant
exchange traded fund incorporated in Ireland. The Fund aims to track the performance of the
Markit iBoxx EUR Liquid Corporates Large Cap Index. The index offers exposure to the most
liquid, Euro denominated, investment grade corporate bonds. The fund has the following
objectives:
*
Diversified exposure to corporate bonds issued in Euros
"
Direct investment in corporate bonds across sectors (industrials, utilities and financial
companies)
*
Euro denominated investment grade bond exposure
Fund performance data is taken from Bloomberg (IBCS GY Equity) and is gross of dividends. Fund
performance is observed from January 2011 to December 2015.
*Source: Bloomberg
III.
Active
Bond Funds
I
compare the following three funds with the Tracker and the indices that I construct below:
L&G Euro Corporate
Blond
Fund
The L&G Euro Corporate Bond Fund (BBG symbol: LGECBDA LN Equity) targets investors who
are seeking a broad European investment grade credit strategy along with the flexibility to
invest in global markets to improve diversification and enhance returns. The fund invests in
12
variety of Euro denominated fixed-interest instruments such as bonds, other fixed or
floating-rate debt securities and short-term debt securities. The fund is managed by Legal &
General Investment Management (LGIM) and is an open-end fund incorporated in the UK. It
aims to produce a return from capital and income. The fund is benchmarked to Markit iBoxx
Euro Corporate Index.
*Source: LGIM fund jact sheet/ Bloomberg
e
-RoweEuro CBrpora
Bond
FundT Rowe Price Funds SICAV - Euro Corporate Bond Fund is a SICAV incorporated in
Luxembourg. The fund's objective is a maximum total return and it invests primarily in a
diversified portfolio of Euro-denominated corporate bonds. The fund is allowed to invest in
securities denominated in other European currencies.
Included
below is a snapshot of fund'scharacteristics versus the benchmark (Barclays Euro-Aggregate: Corporates Bond Index),
which is similar to the Markit Euro IG benchmark.
Table 1: T.Rowe Euro Corporate Bond Fund
2.64% 2A54X S.49 years 5.51lyears 4.75
years
4.94 years2.38%
2.76% 1 __1.74%
1.06%
BBB+
A-M,173 1,706Source: T. Rowe Price/ Data as of 31 March 2016; Benchmark: Barclays Euro-Aggregate: Corporates Bond Index
e
StandArdLfe Eur-o Corpiorate
Bond Fund
"This fund's stated aim is to provide long term growth from capital gains and the
reinvestment of income generated by investing predominantly in European investment
grade bonds. The fund is actively managed and permitted to invest in a wide range of bonds
(e.g. corporate bonds including high yield bonds, government backed securities, overseas
and/or money market instruments). Non-euro denominated assets held in the fund are
generally hedged back to euros". The fund is benchmarked to iBoxx Euro Corporate All
Stocks Index. I have also included below a snapshot of the fund characteristics as of 31
March 2016.
* Source: Standard Life Fund Fact Sheet; iBoxx EUR Corp All Stocks index is the iBoxx EUR Corp index (benchmark index)
Table 2: Standard Life Euro Corporate Bond Fund
I. &2 AMA',
~
x<AAA 2.4% 0-5yrs 51.0% Corporates 48.9%
AA _6.1% _5-1yrs 4a2% Financials 47.2%
A 34 4% 10-15yrs 6.6% Sovereigns 2.2%
I
BBB
48.3% '___15-2Oyrs 1.7% Collateralized 0.8%BB 7.6% 20-25yrs 0.2% Not Classified 0.7%
B
0.5%
25+yrs
___0.3%
Sub-Sovereigns
_ 0.2%N/R
0.7%
Yield to Maturity 1.6 Modified 5.2
Duration
Source; Standard Life Investmentsl Data as of 31 March 2016
IV.
Returns calculation
Custom
indices
Returns for the custom indices that I construct are calculated using the Bloomberg total
return calculator available on the Bloomberg terminal. The calculator essentially allows for
the investor to include the bond security with the trade dates and any financing and
reinvestment rates so as to calculate the holding period return for the duration of the
investment. The calculated returns include any currency impact, and incorporate the chosen
bid-ask spread. The calculator also accounts for cash flows during the period of the
investment.
To calculate monthly returns I take the trade prices, i.e., the mid-spread price for each bond,
and take the beginning and ending working day of each month as the trading days, with
settlement occurring typically 3 days afterwards. Since all bonds are Euro currency
denominated there is no impact from currency translation.
SRivail
indices
For returns calculation of the benchmark, benchmark tracker index and the active bond
funds, I rely on the reported total return index information available from Bloomberg. This
data is collected gross of interest distribution. Monthly returns for all the indices including
the benchmark are calculated as below:
ReturnMonth
i
= (Total Return LevelMonthI) /(Total Return LevelMnthi-1
~ 1For the Markit benchmark, all returns data is based on a bid-to-bid price comparison. Hence,
Markit index return performance does not account for trading costs.
For the tracker and the active bond funds, the total return levels are net of transactions
costs and management expenses. Hence the returns are net of transaction and
management costs.
CHAPTER
3
DATA AND METHODOLOGY
1
Data Source
I
use the Markit iBoxx EUR index (ISIN: DE0006301161) as the benchmark index. The index is
published by Markit and rebalanced every month. I select all bonds for every month from
January 2011 to December 2015.
I
then select a subset of these bonds for every month
according to specific set of rules (strategies) to form my investable index. The rules are
described in the following chapters. I collect data for all the bonds in each month using
Bloomberg as a source. The data is further described in the individual chapters along with the
strategy considered.
IL
Data Cleaning
The available data is incomplete for multiple fields. This is especially true for data fields such as
OAS spreads, effective duration and 1 year probability of default measures. The problem
applies to multiple bonds each month. I also observed implausibly wide spreads for some bonds.
This may be because of lack of trading at end-of-the-month dates. To address these problems, I
did not consider the bonds for which I did not have the required data or where I had
incorrect/stale spread information.
111.
Index Construction Methodologies
I
select 200 bonds to construct my indices. 200 bonds are enough to minimize the effect of
idiosyncratic risk while allowing for tangible impact of an investment strategy. I construct the
index using three methodologies:
To create a notional weighted index, I select bonds for every month that are consistent with
the strategy under consideration. I also obtain the notional amount issued for these bonds. I
then weight each bond selected in the custom index using the notional amount issued. For
example to obtain the index weight of a particular bond in a given month, notional value of
the shortlisted bond is divided by sum of the notional amounts of all of the 200 shortlisted
bonds in the index. Because we are weighting the bonds by their notional issued, large
issues will get over-weighted relative to smaller sized issues. Generally, mature companies
tend to do relatively big issues and also repeatedly tap into capital markets. Hence their
bonds are more liquid and incur lower trading costs, and also exhibit lower price volatility.
This implies similar characteristics for the notional constructed index. However it also means
potentially higher concentration of mature, stable companies in the index. Please refer to
the working example below.
Table 3: Notional weighted index weighting
9,; 750,000,000
0.41%
1000,000,000 0.55%200,000,000
0.11%
181,883,597,740
100.00%
r ice weightedTo create a price weighted index, I weight each bond in the index relative to its market price
per dollar of face value. Given the method of index creation, higher priced bonds are
over-weighted in the index. Please refer to a working example in Table 4:
Table 4: Price weighted index weighting
% . 99.286 (A) 0A-,. (AD
98.233 (B) 0.45% (B/D)
4~
~21618.55
(D) 100.00%For constructing an index using this methodology, I collect duration and price for every bond
for every month at the beginning of the month. I then weight each bond by the product
of
the duration and price. Please refer to the example below. Typically in this method longer
duration and higher priced bonds will be over-weighted. This means potentially the index
will be relatively more volatile and earn a higher term premium.
Tahl ;:
Duration-Price
wei2hted index2.8 99.3 279.0 0.0015%
3.0 98.2 294.7 0.0016%
2.8 97.4 276.6 0.0015%
18,600,326.7
100.0000%CHAPTER 4
CUSTOM INDEX FROM RANDOM SELECTION OF TWO HUNDRED BONDS
1.
Introduction
The iBoxx EUR Corporate index rebalances every month with a new selection of bonds. I select
two hundred bonds every month from this new selection of bonds and then use it to form
custom indices. I form the indices in the three different ways described in the previous chapter. I
then track the total return performance of these indices against the performance of
commercially available indices over a five year period.
II.
Rationale
The intent behind selecting random bonds for index construction is to examine whether a
randomly constructed index with no regard for constituent bond selection can match or
outperform active index construction i.e. whether there is value added from actively selecting
bonds. This helps us understand the value added by active managers and to assess whether the
bond market is informationally efficient.
Ill
Methodology for data selection and
index
construction
*
Data selection
The number of constituent bonds in the lBoxx EUR Corporate index each month ranges from
1253 to 1734. From this set of bonds, I randomly select 200 bonds for index construction.
To ensure bonds are indeed randomly selected, I number each bond starting from 1 for
every month. I then use a uniform random generator series in Excel to pick a serial number
between 1 and the maximum of bonds for the month. I repeat this process if the generated
output number is 0 or if a duplicate serial number within the same month is generated.
After selecting the serial numbers of all two hundred bonds, I then match these to the
corresponding ISIN (International Securities Identification Number) details of the bond. The
ISIN
details are then used to identify price and spread data for each bond. I discard anybonds for which I am unable to obtain spread, pricing or returns data. An example of
selecting a bond using random number is included below:
Table 6: Selecting random bond
Step 1 Random number generated 102
Step 2
ISIN
of bond number 102:81224283739525
Step 3 IfISIN
is repeated then discard and redo processSource: Morkit
IV.
Comparison of the monthly return
performance
of custom indices vs the
monthly
return
performance
of all indices
I
calculate the monthly returns of the custom bond indices, the iBoxx index, benchmark tracker fund and commercial actively managed bond funds over a five year period. The mean monthlyreturn of the Duration-Price weighted index exceeds the mean monthly return of the
benchmark which is weighted by market capitalization. It also exceeds the mean monthly return
of the benchmark tracker, and is comparable to the mean monthly returns of the active bond
funds. The historical mean monthly returns for Notional and the Price weighted indices are
comparable with the mean monthly returns of the benchmark and the benchmark tracker but
below those of the active bond funds.
-.20%
ii\
N
49% nei.i - - - --
- - -
-a a'
, ,, Noiionfl Pfim wt Drli/P r e siuuos lboxx &U Euro IRow. Sd ift
na El -- P.of fiEt R it Corp
Rfturn Corp Furo Corp turn Corp
-... = T ;o fu Corp ti Ie Eo or p m Moan mornthly returns
Source: Bloomberg, Morkit iBoxx EUR index
*All custom indices ore penalized by 0.2% in portfolio VGIue every month to account for troding costs.
20
f--Despite differing means of the monthly returns of the custom indices, the commercial funds and
the benchmark, I note that the means are statistically comparable. I confirm this result using
paired t-tests to prove the null hypothesis of no difference in the mean of monthly returns
between custom indices and the commercial indices. Please refer to the paired t-test results in
Appendix F. Prior to running this analysis; I also confirmed that the returns for all indices are
normal or nearly normal. Please refer to Appendix E for confirmation on the normality of the
returns for all indices including the custom indices.
This is a very important result because despite penalizing the monthly returns of the custom
indices by 0.2% of portfolio value per month i.e. cumulative 2.4% of portfolio value per annum,
the monthly returns of the custom indices are statistically comparable to the returns of the
active bond funds and the benchmark. There is no statistical outperformance in the returns of
an active bond funds relative to the returns of a randomly constructed index.
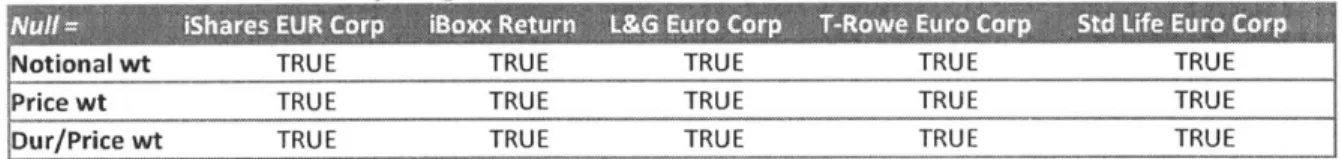
Table 7: Paired t-test for comparing difference of mean returns of custom indices vs commercial funds
Notional
wt TRUE TRUE TRUE TRUE TRUEPrice wt
TRUE
TRUE
TRUE
TRUE TRUEDur/Price wt TRUE TRUE TRUE TRUE TRUE
Null hypothesis: Difference in means is 0.; 95% confidence interval Please refer to Appendix Ffor detailed charts on t-test comparisons
I also observe the active bond funds and the iShares index to have outliers. My custom indices
do not contain outliers. Additionally the Notional and Price weighted indices are narrower in
Although the means of the monthly returns for the custom indices are lower than means of the
monthly returns of the commercial indices, I note that these are statistically comparable. I again
confirm this result using paired t-tests to prove the null hypothesis of zero difference between
the mean of monthly returns between custom indices and the commercial indices. Please refer
to the paired t-test results in Appendix G which includes verification of the paired t-tests for all
combinations of the custom indices with the commercial bond funds including the benchmark
index.
Prior to running this analysis, I also confirmed that the returns for all indices are normal. Please
refer to Appendix E for confirmation on the normality of the returns for all indices including the
custom indices.
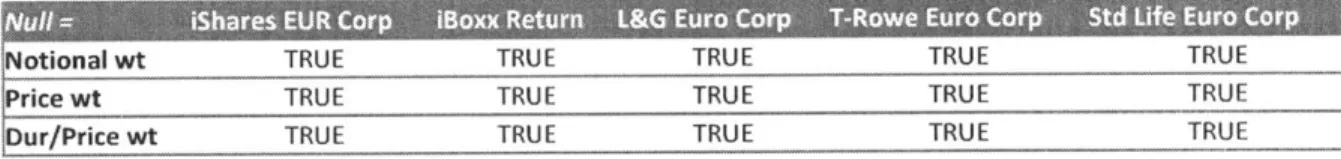
Table 10: Paired t-test for comparing difference of mean returns of custom indices vs commercial funds
Notional wt TRUE TRUE TRUE TRUE TRUE
Price wt TRUE TRUE TRUE TRUE TRUE
Our/Price wt TRUE TRUE TRUE TRUE TRUE
Null hypothesis: Difference in means is '0'
Please refer to Appendix Gfor detailed charts on t-test comparisons
Additionally, on observing the box plots for this index, I see a wider dispersion of monthly returns with
outliers for all three custom indices. It implies higher historical volatilities of the custom indices (I discuss
this later in detail).
4 #% 3.0% 2.0%
1.0%--0.0%
-1.0%1 -3.0% -4 0%Notional wt Price wt Dur/Price wt Ishares EU Min Cutier
Source: Bloomberg, Morkit iBoxx EUR index
*All custom indices except for active bond funds are penalized by 0.2
-- S 5
R lboxx Return L&G Euro T-Rowe Euro Std Dfe Euro
Max Oxtlier Corp Corp Corp
% in portfolio value every month to account for trading costs.
V.
Additional
observations
*
Ex p
.ringpoirt-oio duration and
vehLrns
The duration-price weighted index reflects higher and more volatile duration relative to the
iBoxx and other custom indices. The Notional and Price weighted indices maintain lower
duration than the
iBoxx
index. The custom indices also show more volatile returns per unitduration relative to the iBoxx.
7.5 7.0 6,5 60O .. .... ... ----5.0 4.5 3.5 3.0
ci r-J i- n c-a c n i i-f 'xt U-t '5 z~ l n fLn 4i
-7i 7' '7 -7i
~
-7i 4 -4 -7i 7i -7i -7 -7i -7i 74Duration (Price wt) - Duration iBoxx
Duration (Notional wt) - Duration (DUr-Price)
0(.5% <1.0%
>-.5% - -l-
--1Ztlb M gf ,W n m ' a, C3 M) 3j o1 f) C3) L, 0
Returns (Price wt)/Duration [rhs] -- iBoxx retur ns/Duration [rhs]
Returns (Notional wt)/Duration - Returns (Dur-Price wt)/Duration
Source: Morkit/Bloornberg
* I did not have access to time series
of
duration values for commercially available indicesI observe lower volatility in annual returns for the Price weighted and Notional weighted
indices relative to volatility of all other indices and active funds. The Duration-Price
weighted index exhibits comparable volatility versus the volatility of the active funds, and
higher volatility relative to volatility of the benchmark index and index tracker. Additionally,
I also observe mean of the monthly returns to volatility of the three custom indices to be
comparable to the mean of the monthly returns per unit of volatility of the active bond
funds and exceeding similar measures of the benchmark and benchmark index.
a :uasa~siss--aa) 0_12x 0.1)X2 (ISl 0A%. O l 1 0.10X 0,10 0 .1 8 0 01
~i
A.0 014 I0 %is t 0.0.No onsl wt Price wt Dur/Price wt Ish es FOR lbixx Return KG Furo T-Rowe uro Std I ifE E ur
Corp ('01P C Irp (_I rp
a Nealn monthlly letum i Std Dtev Monthly ReturwC A Mca ioniutly retui n/sttd Dev
Source: Bloomberg, Markit iBoxx EUR index; *All custom indices except for active bondfunds are penalized by 0.2% in portfolio
value every month to occount for trading costs.
23
1 0%
0%)
Table 8: 5-year mean monthly returns and standard deviation
Mean Monthly
0.40%
0.38%
0.47% 0.37% 0.40% 0.49% 0.45% 0.42%Std Dev
0.033
0.033
0.043
0.039
0.037
0.039
0.046
0.043
Mean Monthly
0. 12x
0.12x
C lx
0.1Ox
0.llx
0.13x
0
lox
0.lox
iReturn/Std Dev __ __ __ __________
*Ali custom indices are penalized by 0.2% in portfolio value every month to account for trading costs.
v I t. i In a 2 -retu ii
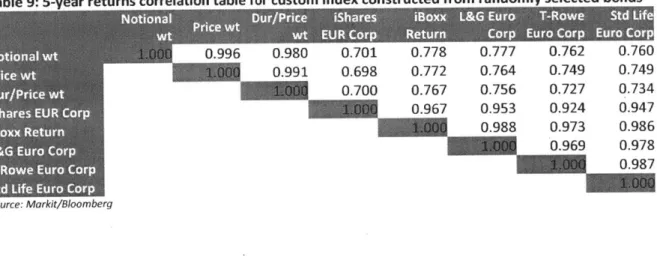
I also calculate the correlations between the monthly returns for all the indices. Since the
custom indices are formed using same set of bonds hence there is a strong correlation
between them. Correlation of the returns of custom indices with the returns of the
remaining commercial indices including the benchmark stays around 0.7. This high
correlation is because the constituent bonds for the custom indices are a subset of the iBoxx
constituent list. The surprising observation is that despite the mandate for active
management, there is high correlation of monthly returns of the active bonds funds with the
monthly returns of the iBoxx index and the index tracker.
Table 9: 5-year returns correlation table for custom index constructed from randomly selected bonds
0.996
0.980
0.701
0.778
0.777
0.762
0.760
1.W@Q-0.991
0.698
0.772
0.764
0.749
0.749
0.700
0.767
0.756
0.727
0.734
1000
0.967
0.953
0.924
0.947
0.988 0.973 0.9860.969
0.978
0.987
imllii
Source: Markit/BloombergCHAPTER
5
SELECTING UNDERPERFORMING BONDS FOR INDEX CONSTRUCTION
1.
Introduction:
The iBoxx EUR Corporate index rebalances every month with a new selection of bonds. I select
two hundred bonds every month from the selection of bonds in the previous month, which have
underperformed the most on a Z-spread basis during the month, i.e., bonds which have widened
the most on a Z-spread basis. I use these bonds to form custom indices using my three different
weightings. I then track the performance of these indices against the performance of
commercial indices over a five year period.
11.
Rationale:
The intent behind this approach is to test whether an index constructed of previously
underperforming bonds can match or outperform active bond funds. The hypothesis behind this
approach is that bonds which have underperformed in a given month will outperform in the
next month as they are cheap relative to the universe of comparable bonds. Further as fund
managers chase yield when deploying cash, it is reasonable to expect underperforming bonds to
outperform in the following period.
Ill.
Methodology for bond selection
The number of constituent bonds in the lBoxx EUR Corporate index each month ranges from
1253 to 1734. Each month, I select the top 200 most underperforming bonds from this set of
bonds to form my custom indices.
To obtain the top underperforming bonds every month, I obtain the Z spread (bid) for each bond
at the beginning of the current month and 30 days prior. I ensure that prior 30 days date is a
workday which helps in obtaining the Z spreads. I do not consider bonds for which I am unable
to obtain Z-spreads. I then calculate the change in the Z-spreads for each bond. The bonds are
then ranked according to their performance i.e. bonds which reflect the most widened spreads
have underperformed and are ranked near the top. This process is done for each month.
IV.
Comparison of the monthly return
performina
e of custom indices vs the
ionthly
return performance of all indices
I
observe the monthly returns of the custom bond indices, the iBoxx index, benchmark tracker fund and commercial actively managed bond funds over a five year period. After accounting foran assumed penalty of 0.2% of portfolio value per month representing trading costs on the
custom indices, I observe the 5 year mean monthly return of all the custom indices to be lower
than the mean monthly returns of the active bond funds and the iBoxx benchmark index. This
suggests that bonds that have declined in value tend to continue to perform relatively poorly. I
repeat this process by selecting bonds which have shown both lower month-on-month pricing
and also by selecting bonds which have shown higher month-on-month
OAS
spreads. These twomethods are analogous to selecting underperforming bonds. I again observe similar historical
performance relative to the mean monthly returns of the iBoxx EUR index, index tracker and the
active bond funds. Essentially a contrarian view on the market would not have resulted in
outperformance over the past five years.
0. GO'.. .* 0 - ---- -- - - --.- - - - - . . 4 iN" 0.42% 040% 0T 0.4o% GJ36%% 0.0%
i 'Noind Prim wt Dur/Pio khat es Iboxx &G fur o T Rowe YOd Life
w! ww EUR Cor p Return Corp Euro Corp Euro Corp Mi verri irioiily ietnirns
Source: Bloomberg, Markit
iBoxx
EUR index6.0% 4.0% 2.0%
0.0
20% -6.0% -80%Notional wt Price wt Dur!Price wt Ishares E UR lboxx Return L&G Euro T-Rowe Euro Std Life Euro
Mmn Cattier Max Ctier Corp Corp Corp
Source: Bloomberg, Markit iBoxx EUR index
*All custom indices except for active bond funds are penalized by 0.2% in portfolio value every month to account for troding costs.
V,
Additional observations
Ex poring portfolio
duration and
retursI observe the portfolio duration and other portfolio characteristics for both the custom
indices and the iBoxx index to determine if any source of diverging performance was due to
higher duration risk or concentration risk. I see Dur-Price weighted index consistently
reflecting higher duration while the duration for the Price weighted index remains volatile.
7 M
5.0
3.0
2.0
N f J C 44 0_ ,~ fn It U nLO
Duration (Price - at) - Duration iBoxx
Duration (Notional wt) - Duration (Dur-Price)
28
Retltumrs (Price wl)/Duratian [rhs- iBoxx returns/Duration [rhsj
Returns (Notional wt)/Duration Returns (Dur Price wtl/Duration
Source: Markit/Bloomberg
* I did not have access to time series of duration values for commercially available indices
The return per unit duration for the Price weighted index is also consistently more volatile
than the returns per unit duration for the iBoxx, and the custom indices.
Svolaotility
of
historica) r-eturnsI observe higher return volatility of the monthly returns for all of the custom indices relative
to the volatilities of the monthly returns of all the remaining indices. This is also expected as
a momentum driven strategy i.e. of buying underperforming bonds will likely have higher
volatility. Consequentially, the custom indices reflect poor return to risk ratios relative to
the active bond funds and the benchmark indices.
0.5% 0. )
OAU
0.3%No i rnai w t Price wt Dur/Price wit WshArte' FUR IhOXX Rehturn (Orp
a Mean mnonthly fe"Iurfns -SWd Dev Menthly ROurNS
A
1 x
P&G rEur TRuwe FEurn 1 t Fe rn
Corp Corp Corp
A Mean monthly feuielr/,td Dev
2.0% 1. 5% -10%
2.0%
A1 1.0%F
4
0.5
...
.
.
...
.
..
..
..
.
..
.
.
..
..
.
.
.
.
().14 0-12 0.-10 0.08 0.06 0.04 0.02 0.00 - - -~ ~a a .ISource: Bloomberg, Morkit iBoxx EUR index; *All custom indices except for active bond funds are penalized by 0.2% in portfolio
value every month to account for trading costs.
Table 11: 5-year mean monthly returns and standard deviation
Mean Monthly 0.34% 0.31% 0.36% 0.37% 0.40% 0.49% 0.45% 0.42%
Return
Std Dev
0.063
0.061
0.071
0.039
0.037
0.039
0.046
0.043
Mean Monthly
0.05x
0.05x
0.05x
0.1Ox
0.lix
0.13x
0. lox
0.lox
:Return/Std
Dev*All custom
indices
are
penalized by0.2 in
portfolio value every month to uccouiit for trading costsSCorrIelation amlong retur-ns
I observe lower correlations of the historical returns for the custom indices with the returns
of the benchmark and benchmark tracker. The correlation is relatively higher with the
returns of the active bond funds.
Table 12: 5-year returns correlation table for custom index constructed from randomly selected bonds
00
0.998
0.986
0.626
0.709
0.697
0.773
0.742
0.990
0.626
0.710
0.695
0.770
0.742
0.662
0.742
0.730
0.786
0.764
0.967 0.953 0.924 0.947C
..0.988
0.973
0.986
~.
0.969
0.978
U
MR
Source: Markit/Bloomberg I Industr-y/Geographv concentrationMacro news can differentially impact returns for particular sectors. This can lead to higher
concentration levels for particular sectors in the proposed custom indices. I examine
whether the source of returns for the proposed custom indices are due to potential
concentration in particular industries, issuer names or countries or other similar factors.
30
U
- N N N r4 N N
Te 0irf~I~ TH, Z'e
I Ni-rj- r - c - -urn-r si *-*~ - - -io-- o o -
-Source: Mcrkt/Bloornberg
Inooo
oa
thea above grph Ioo
obsrehg
n
fluctuatng cocentatio
levels ofthesecto
c
- c - >Fiacialsin the
a
cusoinex
Duigte pod::
o
201-.2015
,Europan
Financials
e ae
weoa
result
an
a
cotnigpo
economiceviroment.
Conseuentl, a
m
a om: as
Mispropoumrticonsa
umbeers
of
ethosreisue
expeienced wikdenisnspreands arid ter
veforeHa
ndustres
&igher
eee
nt
gyaio
mnkine
Mths
cso
index.t Because
f&nGas cials
have
comntously
N N1N N N N Nj'un
b
cotta
eai
the meoc r
hFistrialsperfo rman etforhtheyprops custom indi.
Dies
or thispi od (herase
Eurefd
t
remained under significant pressure for a host
of
reasons including ECB and ratings actions,weak results and a continuing poor economic environment. Consequently, a disproportionate number of those issues experienced widening spreads and therefore higher representation in this Custom
index.
Because financials have continuouslyunderperformed on a total return basis, and this can potentially explain the mediocre historical performance for the proposed custom indices
over
this period (Please refer toAppendix C for benchmark and returns performance of iBoxx Financials index versus iBoxx
EUR Corp).
This is in contrast to the iBoxx index, which has upper concentration ceiling levels for
individual issuer names, countries, industry segments and other similar factors. Additionally,
index trackers tend to diversify, as do active bond fund managers to limit risk taking.
Credit IRtings brkdown
I
check the credit ratings breakdown for the custom indices. I observe that credit ratingsswing between A and BBB credit rating segments while the proportion of AAA and AA single
credits remain relatively small.
100% 60% 20% 0% SAAA a AA A BBB Source: Morkit/Bloonberg 32
CHAPTER 6
SELECTING THE CHEAPEST BONDS RELATIVE TO DURATION FOR INDEX
CONSTRUCTION
I.
Introduction:
The iBoxx EUR Corporate index rebalances every month with a new selection of bonds. I select
two hundred bonds every month from this new selection of bonds, which have the widest
OAS
spreads relative to their duration and then use it to form custom indices. I form the indices in
three different ways. I then track the total return performance of these indices against the
performance of commercially available indices over a five year period.
1H.
Rationale
Many fund managers use duration as one of the key factors in managing the risk of their
portfolio. Hence when I select the bonds with the widest
OAS
spreads relative to their duration
for index construction, I am essentially imitating a fund manager who is trying to add to the
least duration risk of the portfolio per unit of spread.
Il.
Methodology for data selection and index construction
The number of constituent bonds in the lBoxx EUR Corporate index each month ranges from
1253 to 1734. From this set of bonds, I select the top 200 bonds with the cheapest
OAS
spread
to duration for constructing my custom indices. To select these bonds, I first obtain the
OAS
spread (bid) and the effective duration for each bond at the beginning of the month from
Bloomberg. I do not consider the bonds for which there is no spread or duration data. For the
remaining bonds, I divide the
OAS
spread by the duration values and then rank them the bonds
based on the output. I then select the top two hundred bonds for each month which have the
highest spread to duration values to form my custom indices.
IV.
Conparison
of[the uontily return performance of custom
indices
vs tie
monthly return performance of ail indices
I
observe the historical monthly returns of the custom bond indices, the iBoxx index, benchmark tracker fund and commercial actively managed bond funds over a five year period. Afteraccounting for an assumed penalty of 0.2% of portfolio value per month representing trading
costs on the returns of the custom indices, I observe the 5 year mean monthly returns of the
Notional and Price weighted indices to be comparable with the mean monthly returns of the
benchmark and benchmark tracker indices. The mean monthly return of the Duration-Price
weighted index is comparable with the active bond funds and exceeds the mean monthly
returns of the iBoxx benchmark index.
10% 000%0.)% 0.2 \0.35 0,0 0. 10%y 000%
2 z Notional Pricewt Dir/Price 1shares Ioaxx t&GE1rc Rowe It Ithr
wIm w i -E it "A RHWurorp H e r r rrrp E ur C)rr p III, Crfrp
wo f: itvr r~ f, i-O N: ra I .paMeanr monthly rtrur ns
Source: Bloomberg, Markit iBoxx EUR index
*All custom indices except for active bond funds are penalized by 0.2% in portfolio value every month to occount for trading costs.
Although the mean of the monthly returns of the custom indices and the commercial funds
including the benchmark index are different, I again note that they are statistically comparable. I
confirm this result using paired t-tests to prove the null hypothesis of no difference in the mean
of monthly returns between custom indices and the commercial indices. Please refer to the
paired t-test results in Appendix H.
Prior to running this analysis, I confirmed that the returns for all indices are normal or nearly
normal. Please refer to Appendix E for confirmation on the normality of the returns for all
indices including the custom indices formed using the spread-duration strategy.
-~ -~ S
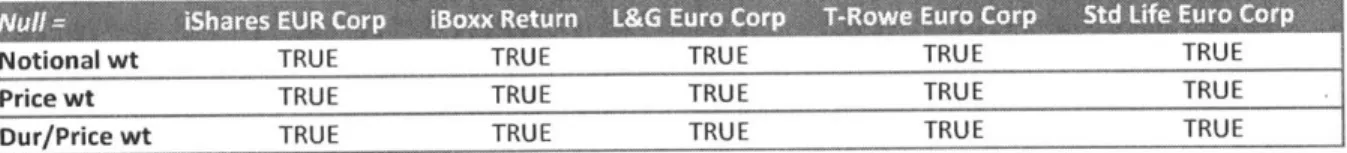
Table 13: Paired t-test for comparing difference of mean returns of custom indices vs commercial funds
Notional wt TRUE TRUE TRUE TRUE TRUE
Price wt TRUE TRUE TRUE TRUE TRUE
Dur/Price wt TRUE TRUE TRUE TRUE TRUE
Null hypothesis: Difference in means is '0'
Please refer to Appendix H for detailed charts on t-test comparisons
I also observe that the custom indices have significantly wide outliers which is in contrast with
the active bond funds and benchmark indices which reflect narrower outliers.
40% 2 0% 2.0% 4.0% -80% 8.0%
Notional wt Pnce wt Dur/Price wt
Ishares
E URlboxx
Return L&G Euro T-Rowe Euro Std Life EuroCorp Corp Corp
Min Outlier Max autlher
Source: Bloomberg. Markit iBoxx EUR
index
*All custom indices except for active bond funds ore penalized by 0.2% in portfolio value every month to account for trading costs.
'V
A dditionaI
observatiotis
S Exploring portfolio duration and returis
I also check for whether the historical performance of the custom indices is due to adding
duration risk or concentration risk to the portfolio. To do this,
I observe
the portfolio duration and other portfolio characteristics for the custom indices and the iBoxx index.5.0 4.0 -1.0 3.0% 1.0% -1.0% CI - - -r-4 r4 (4 r-j r-4 r) rC) CCI CC) 1 t -t -l fL CC -1 e 4-1 . -' .- H .4 ' 4 -V - - 7- ' -
~
a -_ -= r. a -. -= -a -5 -C 0 0 , 0 , <c- 3"-Duration (Price wt) Duration Doxx
Duration_(Notional wt) --_ Duration (Dur-Price)
71 '71 7 '74 %E 4
--
~
~
~
~
~
0 -- --- ----2.0%
- Returns (Price wt)/Duraton [rhs] - iBoxx returns/Duration [rhs]
Returns (Notional wt)/Duration Returns (Dur-Price Mt)/Duration
Source: Markit/Bloomberg
* I did not have access to time series of duration values for coinmercially available indices
From the above chart, I observe the duration of the custom indices to be lower than the
duration of the iBoxx index. This is probably because shorter duration bonds are more likely
to have a high spread-duration ratio, leading to overall lower duration of the portfolio.
Despite lower duration, I find the returns per unit of duration to be significantly ahead of
the returns per duration of iBoxx index especially during the time period of Oct 2011 to Oct
2012. This time period of higher returns significantly pushes up performance over the five
year period. Returns per unit of duration for the proposed custom index continued to stay
ahead of returns per unit duration for the iBoxx index for most of the remaining years.
0
Vfcolatility
f
istWi
ca1 r-etuns
I
observe lower returns volatility for the Price weighted and Notional weighted indices relative to volatility of all other indices and active funds. The Duration-Price weighted indexexhibits modestly higher volatility relative to the volatility of the active funds, and higher
volatility relative to volatility of the benchmark index and index tracker.
Additionally, I also observe mean monthly returns to volatility of the three custom indices to
be comparable to the mean monthly returns per unit of volatility of the active bond funds
and exceeding similar measures of the benchmark and benchmark index. Only L&G Euro
Corp fund outperforms on this measure.
0,14 01~1 1x 0 14 0. 50% fu 1 .1Ox 0.10X 0.10Y A A o 0>1 % 0. 40% A 0.30% 0. 06
Notional wt Price wt Duir/Price wtishares EUR fboxx Return L&G Euro T-RGWC: Euro Std Life Eurn,
CIrp 1orp Corp Corp
'a Mean monthly returns 1 00 Dcv Monthly Re turns A Mean monthly re'turn/Std Dev
Source: Bloomberg, Morkit iBoxx EUR index; *All custom indices except for active bond funds are penalized by 0.2% in portfolio
value every month to account for trading costs.
Table 14: 5-year mean monthly returns and standard deviation
Mean Monthly 0.35% 0.33% 0.47% 0.37% 0.40% 0.49% 0.45% 0.42%
Return
Std Dev
0.034
0.033
0.047
0.039
0.037
0.039
0.046
0.043
Mean Monthly
Olox
0.Ox
0.
10x
Olox
Olix
0.13x
0lox
-lox*eturn/Std Dev pn b. p.vr h c rr s
Correlation amnong
retunsI observe lower correlations of the historical monthly returns of the custom indices with the
monthly returns of the benchmark and benchmark tracker. The correlation is relativelyhigher with the returns of the active bond funds.
Table 15: 5-year returns correlation table for custom index constructed from randomly selected bonds
0.998
0.994
0.588
0.692
0.700
0.731
0.708
I
0
0.994
0.588
0.693
0.698
0.729
0.708
0.595
0.703
0.713
0.744
0.721
0.967 0.953 0.924 0.9470.988
0.973
0.986
.0dF0-
0.969
0.978
0.987
Source: Morkit/BloombergInd usty/Geogr-apy
analysis:The downside of buying cheap bonds relative to their duration is that this strategy can lead
to excess concentration in particular industry segments. Macro news periodically can lead to
wider spreads for issuers from particular industry sector relative to their duration.
Consequentially this will lead to a build of concentration levels for the particular industry
sector in our custom index. I explore if the source of returns for the proposed custom
indices is due to any build-up of concentration in particular industries, issuer names or
countries or other similar factors.
W
'M AR
'a
o
5.oeoeoo
_j 4 H;n
0 0 0 - Q 0 Z) C sc rF N 11 , N N~ 1 ,A 4 N N N N -4 N 14 N ri N N N N -- N -a y e -y c a y-a . > C - -5 a > 75 .> c : >= e a o o a 4 m , o o o " , , Z , z , 2 2 z , 2 T Z - 2 A Zds &Ga ed e e mmwn Acws Ulft s Ouaih A o & Gg -e d-mukgy Jt lfemuuln nties If-..
,am,, =
m
i&, 2n z
,a >
3f fh u w Frenan k E e an;ey n-sm Id A- oon Nehdad -'re w s f1 -P dMr
m Iy n- a nb - f ZA ft Ai gp - A
.r . M .rk .. /---...er Sourc: Marit/Blomber
in the above graphs, I observe high concentration levels of the sector 'Financials' in our
index and a high concentration for Spanish and Italian issuers. This is also expected as
'Financial' issuers from these countries have constantly faced poor economic news and their
credit spreads have remained under stress. Hence they are over represented in our custom
index and this can be a potential explanation for higher returns. This is in contrast to the
iBoxx index, which has upper concentration ceiling levels for individual issuer names,
countries, industry segments and other similar factors. Additionally, index trackers also tend
to diversify so as to track the index and active bond fund managers also tend to diversify to
*
:Cdit
Ratigp
breakdowi
I
further observe the evolution of the credit rating breakdown for the custom index portfolio over time. I observe significant buildup of BBB credits at the expense of A and AA creditswhich leads to lower portfolio diversification. This is also expected as the yields collapsed
across all the credit grades over the past five years and hence the lower rated BBBs with
relatively higher spreads dominate the index at the expense of the AA and A credits. Note
that the method nearly filters out the AAA credits which have extremely tight and
historically low spreads near to zero yields.
40% 20% 0% (D e CD C1 _) (D r D CD ID C - -' C -< 0 < ,C2 mAAA a AA A m BBB Source: Markit/Bloomberg <, -