Science Arts & Métiers (SAM)
is an open access repository that collects the work of Arts et Métiers Institute of
Technology researchers and makes it freely available over the web where possible.
This is an author-deposited version published in:
https://sam.ensam.eu
Handle ID: .
http://hdl.handle.net/10985/17970
To cite this version :
T. GU, J. R. MEDY, Vincent KLOSEK, Olivier CASTELNAU, Samuel FOREST, Eveline
HERVÉ-LUANCO, F. LECOUTURIER-DUPOUY, Henry PROUDHON, Pierre Olivier RENAULT, Ludovic
THILLY, Patrick VILLECHAISE - Multiscale modeling of the elasto-plastic behavior of
architectured and nanostructured Cu-Nb composite wires and comparison with neutron diffraction
experiments - International Journal of Plasticity - Vol. 122, p.1-30 - 2019
Any correspondence concerning this service should be sent to the repository
Administrator :
archiveouverte@ensam.eu
Multiscale modeling of the elasto-plastic behavior of architectured
and nanostructured Cu-Nb composite wires and comparison with
neutron diffraction experiments
T. Gu
a,b, J.-R. Medy
e, V. Klosek
f, O. Castelnau
a, S. Forest
b,∗, E. Hervé-Luanco
c,b,
F. Lecouturier–Dupouy
d, H. Proudhon
b, P.-O. Renault
e, L. Thilly
e, P. Villechaise
eaPIMM, CNRS UMR 8006, Arts et Métiers ParisTech, CNAM, 151 Bd de l’Hôpital, 75013 Paris, France
bMINES ParisTech, PSL Research University, MAT-Centre des matériaux, CNRS UMR 7633, BP 87, 91003 Evry, France cUniversité de Versailles, Saint-Quentin en Yvelines, 45 Avenue des Etats-Unis, 78035 Versailles Cedex, France
dLaboratoire National des Champs Magnétiques Intenses, EMFL, UPR 3228 CNRS-INSA-UGA-UPS, Grenoble & Toulouse, France
eInstitut Pprime, UPR 3346, CNRS, University of Poitiers, ISAE-ENSMA, SP2MI, Boulevard Marie et Pierre Curie, BP 30179, 86692 Futuroscope
Chasseneuil Cedex, France
fLaboratoire Léon Brillouin, CEA-Saclay, 91191 Gif-sur-Yvette Cedex, France
A R T I C L E I N F O Keywords:
Multiscale modeling Copper niobium wire Elasto-plasticity Homogenization Polycrystalline material Neutron diffraction
A B S T R A C T
Nanostructured and architectured copper niobium composite wires are excellent candidates for the generation of intense pulsed magnetic fields ( 100T) as they combine both high strength and high electrical conductivity. Multi-scaled Cu-Nb wires are fabricated by accumulative drawing and bundling (a severe plastic deformation technique), leading to a multiscale, architectured, and nanostructured microstructure exhibiting a strong fiber crystallographic texture and elongated grain shape along the wire axis. This paper presents a comprehensive study of the effective elasto-plastic behavior of this composite material by using two different approaches to model the mi-crostructural features: full-field finite elements and mean-field modeling. As the material exhibits several characteristic scales, an original hierarchical strategy is proposed based on iterative scale transition steps from the nanometric grain scale to the millimetric macro-scale. The best mod-eling strategy is selected to estimate reliably the effective elasto-plastic behavior of Cu-Nb wires with minimum computational time. Finally, for the first time, the models are confronted to tensile tests and in-situ neutron diffraction experimental data with a good agreement.
1. Introduction
In recent years, two types of filamentary and multilayered composites composed of copper and niobium (i.e. Cu-Nb nano-composite wires and laminates) have been highlighted thanks to their special properties (Misra and Thilly, 2010). These two Cu-Nb nano-composites are fabricated respectively by two different severe plastic deformation techniques: Accumulative Drawing and Bundling (Dupouy et al., 1996; Thilly, 2000;Vidal, 2006;Dubois, 2010;Medy, 2016) and Accumulated Roll Bonding (Lim and Rollett, 2009;Beyerlein et al., 2014).
A typical cross section of a Cu-Nb nano-composite wire is illustrated inFig. 1, referred to as “Filamentary” structure inThilly (2000);Thilly et al. (2002): a multiscale Cu matrix embedding parallel Nb nano-filaments. These nano-composite conductors are
∗Corresponding author.
E-mail address:samuel.forest@mines-paristech.fr(S. Forest).
excellent candidates for generation of intense pulsed magnetic fields ( 100T). The intense magnetic field offers valuable opportunity to carry out many of the essential experiments (e.g. in the field of particle physics), and become promising industrial tools (such as controlled nuclear fusion) (Spencer et al., 2004;Jaime et al., 2012;Béard et al., 2013,2018;Halperin et al., 2013;Debray and Frings, 2013;Zherlitsyn et al., 2013;Frydman, 2014;Peng et al., 2014;Nguyen et al., 2016). To generate them, the conductors for the winding coils must combine both high mechanical strength (due to large Lorentz forces) and high electrical conductivity. InThilly (2000);Vidal et al. (2007), a conductor presenting an ultimate tensile strength as large as 1.9 GPa at 77 K has been obtained, together with an electrical conductivity of1.72µ 1cm 1.
Predicting the elasto-plastic behavior of polycrystalline nano-composites with respect to their nano/micro-structure is a complex matter, particularly if they are fabricated by severe plastic deformations leading to:
(1) specific crystallographic/morphological textures;
(2) microstructural features which exhibit anisotropy and induce size effects; (3) initial residual stresses.
In this field, combining material characterization and multiscale modeling is mandatory. Previous studies on the Cu-Nb nano-composite wires and laminates have focused on textures and their evolution (Lim and Rollett, 2009;Dubois, 2010;Lee et al., 2012;
Hansen et al., 2013;Medy, 2016), elasticity (Gu et al., 2017a), dislocation glide (Thilly et al., 2001;Misra and Hoagland, 2007), grain size dependent yield stress/yield criterion (Misra and Hoagland, 2007;Thilly et al., 2009;Nizolek et al., 2015), Bauschinger effect (Thilly et al., 2007;Badinier et al., 2014), hardness (Thilly et al., 2002), ultimate tensile strength (Vidal et al., 2007), Cu-Nb in-terfaces (Mayeur et al., 2013,2015;Beyerlein et al., 2014), and thermal stability and internal stresses (Vidal, 2006;Dubois et al., 2010;Beyerlein et al., 2014). The electrical behavior of Cu-Nb composites was studied byGu et al. (2015,2017b).
The present work concentrates on the multiscale modeling of the anisotropic elasto-plastic behavior of architectured and nanos-tructured Cu-Nb composite wires. Two multi-scale methods will be introduced: a full-field Finite Element Method (FEM, seeTable 1
for the abbreviations) with periodic boundary conditions (denoted PH, for Periodic Homogenization) and a mean-field homo-genization model, i.e. the so-called “β-models” afterCailletaud (1992);Pilvin (1996). These models essentially differ by the mi-crostructural information they are based on for the estimation of effective behavior. Here, FEM PH assumes a periodic microstructure adapted for polycrystalline aggregates and for hexagonal fiber assemblies (present at different scales inFig. 1). On the other hand,
β-Fig. 1. Successive section views of the Cu-Nb nano-composite wires containing 852elementary Cu/Nb long fibers. The diameter of specimen (c) is reduced from actual 4.50 mm to two smaller diameters by supplementary cold-drawing: 2.10 mm for in-situ neutron diffraction experiments and 0.29 mmfor macroscopic tensile tests in this work. The smaller scale for pure polycrystalline Cu or Nb (i.e. scale H0) is not shown in this figure. See Section2.3for scale conventions and notations.
models will be used to describe the elasto-plastic behavior of polycrystals made of Cu or Nb grains, but also for the estimation of a random mixture of Cu and Nb phases. The results provided by FEM are also regarded as benchmarks to identify parameters of the β-model.
Taking into account dislocation movements for strain hardening of a single crystal, dislocation-based constitutive formulations have been proposed in the literature, e.g.Asaro (1983);Tabourot et al. (1997);Hoc and Forest (2001);Kubin et al. (2008);Devincre et al. (2008); Groh et al. (2009)for BCC (Body-Centered Cubic) and FCC (Face-Centered Cubic) crystals. In these models, all parameters have a physical meaning which can be determined by experiments or other theoretical analysis, such as dislocation dynamics (Tabourot et al., 1997;Groh et al., 2009). The Méric-Cailletaud's model is more phenomenological in nature and uses an original combination of kinematic and isotropic hardening for each slip system (Méric et al., 1991;Besson et al., 2009). This model was used for the crystal plastic predictions of metallic alloys, particularly for FCC Cu polycrystals (Méric et al., 1994;Šiška et al., 2006;Musienko et al., 2007;Gérard, 2008;Šiška et al., 2009). Here, the Méric-Cailletaud model will be used to describe the visco-plastic constitutive law for single Cu crystals.
Full-field methods (e.g. based on FEM) applied to a Representative Volume Element (RVE) can integrate the detailed experimental microstructure and provide the complex stress/strain fields inside the different phases. The elasto-(visco-)plastic effective behavior of FCC and BCC polycrystalline aggregates can be studied by FEM in many aspects, as shown inBarbe et al. (2001a,b);Fritzen and Böhlke (2011). In addition, in order to save computational time, another full-field method, using Fast Fourier Transform (FFT) to solve the mechanical equilibrium, has been developed for both linear and nonlinear polycrystalline behavior (Moulinec and Suquet, 1995; Suquet et al., 2012;Lebensohn et al., 2012). Furthermore, for heterogeneous materials with a random or complex micro-structure, e.g. the hexagonal fiber assembly, the elasto-(visco-)plastic scale transition is a challenge for homogenization models. In this regard, the following attempts are worth mentioning: the above-mentioned full-field FEM (Williams and Pindera, 1997), mac-roscopic model with phenomenological parameters identified from field measurements (Haddadi et al., 2006), FE2multiscale ap-proach (Feyel and Chaboche, 2000;Geers et al., 2010), and TFA (Transformation Field Analysis)/NTFA (Nonuniform Transformation Field Analysis) (Michel and Suquet, 2003,2004;2016;Franciosi and Berbenni, 2008;Fritzen and Böhlke, 2011). The latter method represents a transition from full field to mean field models.
The mean-field method relying on homogenization theory is well adapted to estimate the mechanical behavior of polycrystals. Unlike full-field approaches, the mean-field method is based on a statistical description of the microstructure of polycrystalline aggregates leading to reduced computational time. These methods were initially developed for heterogeneous linear thermal-elas-ticity, such as the Standard Self-Consistent scheme (denoted SSC), see the original references quoted inFrançois et al. (1998);Qu and Cherkaoui (2006);Nemat-Nasser and Hori (2013). Later on, they have been extended to (i) visco-plastic, (ii) elasto-plastic and (iii) elasto-visco-plastic nonlinear properties (Ponte-Castañeda and Suquet, 1998). For nonlinear homogenization, the main difficulty relies on a carefully chosen linearization for the material properties. Use is made of a “linear comparison material” which exhibits a thermo-elastic like behavior defined at each strain value or increment. For (i) visco-plastic materials, one can perform a secant linearization (Hutchinson, 1976), a tangent one (Molinari et al., 1987;Lebensohn and Tomé, 1994) and an affine one (Masson and Zaoui, 1999). These approaches have been improved by using stress/strain heterogeneities inside the phases leading to so-called second-order moments (Castañeda, 1991,2002). For (ii) elasto-plastic materials,Kröner (1978)proposed an incremental approach in which the interaction between the grain and the effective medium is purely elastic. This leads to an overestimation of the effective stress (Berveiller and Zaoui, 1978;Masson and Zaoui, 1999). In order to (at least partly) figure out this issue, many later works, e.g.
Berveiller and Zaoui (1978);Turner and Tomé (1994);Masson et al. (2000);Neil et al. (2010);Doghri et al. (2011);Wu et al. (2013);
Zecevic and Knezevic (2015)have considered an elasto-plastic interaction law instead of an elastic one. Based on theBerveiller and Zaoui (1978)model for isotropic nonlinear behavior of equiaxed polycrystals, the β-models were proposed for anisotropic behavior of multi-axial polycrystals (Cailletaud, 1992;Forest and Pilvin, 1996;Sai et al., 2006;Martin et al., 2014;Cailletaud and Coudon, 2016;
Coudon, 2017;Coudon et al., 2018). For (iii) elasto-visco-plastic behavior, one specific difficulty is the “long term memory effect” leading to a time delay of the interphase mechanical interactions. Different solutions have also been proposed, such asMasson and Zaoui (1999);Paquin et al. (1999,2001);Brenner et al. (2002);Vu et al. (2012).
Despite a wealth of literature works on elasto-(visco-)plasticity of crystals, we have found that the following three points are still missing:
(1) A systematic analysis of the anisotropic behavior for Cu/Nb polycrystals by elasto-plastic homogenization models, especially for the specific crystallographic/morphological textures encountered in Cu-Nb wires;
(2) An iterative scale transition homogenization approach accounting for elasto-plasticity adapted for the recent Cu-Nb wires with a complex architecture (i.e. the multi-scaled hexagonal fiber assemblies), and including the effect of initial residual stresses; (3) An interpretation of recent experimental mechanical test data of Cu-Nb wires, particularly the in-situ neutron diffraction data in
Table 1
The abbreviations used in this work.
FEM Finite Element Method PH Periodic Homogenization
SSC Standard Self-Consistent scheme RVE Representative Volume Element
OFHC Cu Oxygen-Free High Conductivity Cu CRSS Critical Resolved Shear Stress
LT Longitudinal Tensile test TT Transverse Tensile test
Medy (2016). It should be noted that only tensile tests can be performed in-situ with such thin wires. Therefore, the objectives of the present work are threefold:
(1) Provide a homogenization model for individual Cu and Nb polycrystals present in the composite wires taking into account the crystallographic and morphological textures;
(2) Provide a multi-scale homogenization procedure to model the architectured and nanostructured Cu-Nb composite wires, ac-counting for initial residual stresses and grain size effects;
(3) Provide a quantitative understanding of the load dependency of crystal lattice evolution during neutron diffraction uniaxial loading test for Cu-Nb wires.
Accordingly, the outline of the article is as follows. The architecture/microstructure of Cu-Nb wires and the induced mechanical properties are described in Section2. In order to reproduce the effective elasto-plastic behavior of this material, two multi-scale methods, i.e. full-field periodic models and the β-models are presented in Section3. In Section4, the elasto-plastic Cu polycrystals are isolated and homogenized. Then in Section5, several scale transitions of architectured Cu-Nb composites are performed to determine the effective elasto-plastic behavior of Cu-Nb wires up to macro-scale. The uncertainties of scale transition are discussed and the best-suited modeling strategy is selected. Finally, in Section6, the model results are validated by comparison with macroscopic me-chanical data from tensile tests and lattice strains from neutron diffraction.
Throughout this work, the following notation is used: x for scalars, x for vectors,x
˜for 2nd-order tensors, x for 4th-order tensors,
for single contraction, : for double contraction, for tensor product, x˜ for effective (or homogenized) property andx¯= x for volume average.
2. Material description
2.1. Fabrication process
Cu-Nb nano-composite wires are fabricated via a severe plastic deformation process, based on ADB (series of hot extrusion, cold drawing and bundling stages) according to (Dupouy et al., 1996;Thilly, 2000;Vidal, 2006;Dubois, 2010;Medy, 2016):
•
A Nb wire is initially inserted into a Cu tube. The used Cu is Oxygen-Free High Conductivity (OFHC).•
The structure is extruded and drawn, then cut into 85 smaller pieces with hexagonal cross section.•
These pieces are then bundled and inserted into a new Cu tube.•
The new composite structure is again extruded and drawn. And so on.In the present work, ADB is repeated twice, leading to copper based architectured and nanostructured composite wires which are composed of a multi-scale Cu matrix embedding 852Nb nanofibers (so-called N = 852type of “Cu-Nb Filamentary” wires, as illu-strated inFig. 1): Nb fibers are separated by the finest Cu-0 copper channels; groups of 85 Nb/Cu-0 elementary long fibers are then separated by Cu-1 copper channels; the group of 852elementary patterns is finally embedded in an external Cu-2 copper jacket. It is noted that, unlike Cu, Nb fibers are introduced only at the very first fabrication stage. Therefore, Nb fibers are all deformed together during the iterative ADB process, and should exhibit the same microstructure with similar characteristic sizes. In contrast, copper is introduced at each stage so that several types of copper microstructures are present in the material. The Cu-0 regions originate from the beginning of the process, while the Cu-1 and Cu-2 are introduced successively during the two steps of ADB; different micro-structures are thus expected for the different Cu-i regions (i = 0, 1, and 2).
In this work, two Cu-Nb Filamentary wires with a final diameter1of 0.29 mm and 2.10 mm are used for macroscopic tensile testing and in-situ neutron diffraction experiments. These wires are obtained from initial specimens with a diameter of 4.50 mm by supplementary cold-drawings (Medy, 2016). The volume fractions f of each component (i.e. Nb, Cu-0, Cu-1 and Cu-2) are not altered by hot-extrusion nor cold-drawing and they can be determined from the initial dimensions of Nb cylinder and Cu jacket. The theoretical value of channel width, δ, can be estimated assuming a homogeneous deformation of the structure during the material processing (Vidal, 2006), as indicated inTable 2for the two diameters.
2.2. Crystallographic and morphological textures
The study of the elastic behavior of the wires performed by (Gu et al., 2017a) shows that the effective wire behavior critically depends on the grain morphology and texture. In particular, accounting for the crystallographic textures is of the utmost importance and will be part of the proposed multiscale modeling of elasto-plasticity in this work. The crystallographic texture of the Cu-Nb Filamentary wire of interest at a diameter of 4.50 mm has been investigated by EBSD at various scales byMedy (2016).Fig. 2
illustrates the EBSD orientation map of a the cross section perpendicular to the wire axis x1at the effective scale H1. The Cu grains 1Following (Thilly et al., 2002;Medy, 2016), all dimensions are given in the x
2x3cross section, i.e. perpendicular to the wire axis x1, seeFig. 1for the coordinate system.
exhibit a strong 111 fiber texture with a remnant 100 fiber, while a single 110 texture is observed for Nb. Due to extrusions and drawings along the wire direction in the material processing, x1is the symmetry axis of theses fibers. The crystallographic textures of each component are given inTable 2. The associated texture spread (i.e. FWHM, for Full Width at Half Maximum) is estimated to be
±
10.0 3.0, based on EBSD data. The specimens with smaller diameters 2.10 and 0.29 mm studied in this work are assumed to display very similar crystallographic texture.
Table 2
Volume fraction f, channel width δ, crystallographic textures and yield stresses yof individual component for Cu and Nb polycrystals in Cu-Nb wires, obtained experimentally inMedy (2016). The two wires with different diameters are assumed to exhibit similar crystallographic textures. Yield stresses yare >2 GPa for Nb, 350 MPa for Cu-1 and Cu-2, and 500MPa for Cu-0 with channel width = 310 nm.
Component Nb Cu-0 Cu-1 Cu-2
Volume fraction f 44.7% 15.2% 17.5% 22.6% Channel width δ wire diameter: 2.10 mm 13.74 µm 2.19 µm 21.97 µm 124.48 µm wire diameter: 0.29 mm 1.94 µm 310 nm 3.09 µm 17.65 µm Fiber textures 111 – 70% 90% 81% 100 – 30% 10% 19% 110 100% – – –
Fig. 2. EBSD map in the x2- x3transverse plane showing Cu and Nb grain orientations (Medy, 2016). Inverse pole figure (x1axis) coloring according to the cubic crystal system. Nb appears in green due to the strong 110 fiber texture and Cu in red/blue. The specimen diameter is 4.50 mm. (For interpretation of the references to color in this figure legend, the reader is referred to the Web version of this article.)
Fig. 3. EBSD map in a plane parallel to x1showing Cu and Nb grain orientations (Medy, 2016). Inverse pole figure (x1axis) coloring according to the cubic crystal system. The specimen diameter is 4.50 mm. Highly elongated grains along x1are observed for all components (e.g. Cu-1 in this figure).
In the following, is defined as the average grain length along the longitudinal wire axis x1and d as the average grain diameter in the transverse x2-x3cross section. As illustrated inFig. 3obtained by EBSD (Medy, 2016), the morphological texture exhibits highly elongated grains along x1because of iterative severe plastic extrusion and drawing, i.e. dfor both Cu and Nb components.
2.3. Scale conventions
For multiscale modeling of the effective elasto-plastic behavior of these Cu-Nb wires, the following scale conventions will be used (seeFig. 1):
•
Scale H0. Homogenization at the highest magnification scale, looking directly at each individual polycrystalline Cu or Nb agregate, is labeled as H0 (Homogenization 0). In other words, the effective stress-strain denoted( ¯˜-˜¯)H0at scale H0 of pure Cu (or
pure Nb) polycrystalline agregates will be obtained from the homogenization models.
•
Scale H1. Homogenization at the scale of a bundle unit containing 851 elementary Nb/Cu-0 long fibers is labeled as H1 (Homogenization 1).•
Scale H2. Iterative homogenization at the scale where the effective Cu-Nb composite H1 zones are embedded in the Cu-1 matrix is labeled as H2 (Homogenization 2), i.e. H2 provides the effective behavior of an assembly of 852elementary patterns. The effective behavior is labeled as( ¯˜-˜¯)Hiat scales Hi of the bundle unit of 85i(i = 1, 2) elementary long fibers.
•
Scale S2. The macrocospic scale S2 is defined here as a single cylinder-shaped Structure with two layers: effective Cu-Nb com-posite H2 core zone surrounded by the external Cu-2 jacket. The structural problem S2 will be solved by FEM to compute the macroscopic behavior( ¯˜-˜¯)S2. Then, this effective behavior will be compared with available experimental data.
In addition, the effective elastic stiffness tensors are noted as C˜ Hi
and C˜ S2
at scales Hi (i = 0,1,2) and S2 respectively as in (Gu et al., 2017a). Finally, due to the combination of the axisymmetric morphological and crystallographic textures of Cu and Nb agregates with the successive quasi-hexagonal arrangements of fibers or bundles, the effective behavior is expected to exhibit
transverse isotropy with respect to x1at all scales H0 to S2.
2.4. Grain size dependent yield stress
Different types of copper matrix channels are present (Thilly et al., 2009), due to the multi-scale microstructures: (1) Cu channels with δ larger than a few micrometers (i.e. the so-called “large” Cu channels) which are composed of grains with a transverse size
d 1 mµ together with remaining smaller grains with d = 200–400 nm (a typical grain size in cold-worked Cu); (2) The “fine” Cu-0 channels lie in the sub-micrometer range, with only a few grains located between the Cu/Nb interfaces: in this case, the grain width d varies from /3 to δ.
According toVidal et al. (2007);Thilly et al. (2009), the yield stress yof the highly cold worked large Cu channels can be
estimated as 350 MPa. Furthermore, it was observed unambiguously that plastic deformation proceeds in the fine Cu-0 channels by emission of individual dislocation loops at one Cu-Nb interface, then gliding in the Cu-0 grain interior and absorption in the neighbouring Cu-Nb interface (Thilly et al., 2001). As a result, edge segments are absorbed in the Cu/Nb interfaces and screw segments bow out between two interfaces, eventually propagating by further bowing and deposition of dislocation debris at inter-faces. Such a “single dislocation” regime is usually related to the Orowan-type behavior where the enhanced yield stress ycan be
related to the channel width δ as: =y y0+ µ b( / ) ( / )ln b where μ = 42.5 GPa,bCu= 0.256 nm and α = 0.6 denotes respectively shear modulus, norm of Burgers vector and a material constant depending on the dislocation character together with the Taylor factor (Thilly et al., 2009). In addition, y0is 350 MPa corresponding to the yield stress of “coarse grain” in large Cu channels. By using this
grain size effect formula, the finest Cu-0 channels with δ = 310 nm are expected to display a higher yup to500 MPa. In contrast,
Cu-0 channels with δ =2.19 mµ still display a yof 350 MPa, when wire diameter takes 2.10 mm.
The bulk specimens of cold worked polycrystalline Nb display a y 1.4 GPa(Dupouy et al., 1995). On the other hand, Nb grain sizedNbis comparable with the fiber diameter (Thilly et al., 2009). Due to size effects,Dubois et al. (2012)argued that yof Nb fibers
is much higher (>2 GPa) than yof Cu channels. Several ex-situ/in-situ tensile tests of Cu-Nb wires were performed along the wire
direction x1up to macroscopic material failure, and plastic strain has not been observed in the Nb fibers (Vidal, 2006;Dubois, 2010). Therefore, Nb is assumed to remain elastic for the small-strain mechanical tests considered in this work. All yield stress values yof
the various components considered in this work are summarized in the legend ofTable 2.
2.5. Initial residual stresses
Due to the material processing, residual stresses, denoted by˜res, are initially introduced in composite Cu-Nb wires, as observed by X-ray diffraction (Vidal, 2006). The longitudinal initial residual stresses(res 11) along the wire axis x1have been determined in a Cu-Nb wire containing N =554elementary Cu/Nb fibers (specimen diameter 1.49 mm): Axial compression -100 MPa for the large Cu channels ( 1 mµ ) and axial tension +250 MPa in the Nb phase. However,˜rescould not be determined accurately, and have not been reported for the Cu-Nb Filamentary wires N = 852studied in this work. The identification of
˜reswill be discussed later in Section6.2.
3. Hierarchical homogenization strategy
The homogenization strategy used in this work, including the corresponding scales, models used, results obtained and identifi-cation of initial residual stresses, is illustrated inFig. 4.
3.1. Constitutive equations for the single crystal
The Cu-Nb wires are made of FCC Cu and BCC Nb grains. Nb exhibits a high yield stress and therefore only the elastic behavior will be considered, i.e. no plastic strain assumed (Section2.4). This section presents the elasto-visco-plastic single crystal model used for the Cu components. The Méric-Cailletaud model has been developed in the framework of crystal plasticity theory following (Méric et al., 1991) and used for several metallic alloys. It is presented here in its small perturbation version, which uses an additive decomposition of the total strain rate into elastic and viscoplastic parts.
The resolved shear stress sacting on a particular slip system s() is given by Schmid's law:
= m
˜ : ˜
s ( )r s (1)
where˜( )r is the stress tensor in a crystal phase( )r andm
˜sis the orientation tensor attributed to the slip system s():
= + m l n n l ˜ 1 2(¯ ¯ ¯ ¯ ) s s s s s (2) with unit vectorsn
¯s and¯ls being the “slip plane” normal and the “slip direction”, respectively. Here, 12 octahedral systems are
considered for FCC Cu. The resolved shear stress s is related to the corresponding viscoplastic shear rate s via a power law
expression:
=
{
X R}
=K sign( X), with { }a max( , 0) .a
s s s s n s s
(3)
Fig. 4. Overview chart of the iterative scale transition steps and experimental comparison. The considered scales and scale transition models are
mentioned, together with the obtained effective behavior. The identification of initial residual stresses is also shown. The same parameter com-bination of Dijis used for all the βi-model (i = 0,1,2), once identified at scale H0.
For each slip system, internal variables are introduced to describe the hardening of the material: isotropic hardening variablesRs
and kinematic hardening variablesXs. In addition, n and K are the parameters controlling viscosity. The non-linear evolution rule for
isotropic hardening involves a 12×12 interaction matrixhwhich includes self-hardening and latent hardening:
= + = Rs R Q h [1 exp( bv )], withv , u su u u u 0 (4) wherehcontains six independent parameters: one diagonal term (noted ash1) for the self-hardening and five other non-diagonal terms (i.e.h2,h3,h4,h5and h6) for the latent hardening. Also, R0denotes the initial critical resolved shear stress (CRSS). The following non-linear kinematic hardening is also adopted:
= =
Xs C s, with s s D s s. (5)
Here, before loading,Xs= 0, thus sis initialized as 0. Note thatXstends to the saturated value C D/ for large values of slip. The
material parameters Q, b, C, D in the above equations must be identified for isotropic and kinematic hardening. The parameter identification for the single crystal model of Cu will be discussed in Section4.1. Finally, plastic deformation˜ r
p( )in a crystal phase( )r is the result of slip processes on all slip systems:
= = m ˜ ˜ . r s s s p( ) 1 12 (6)
3.2. Full-field periodic models
In the present work, a full-field FEM PH is proposed to compute the effective elasto-plastic behavior of Cu-Nb wires at the various scales. An elementary volume V made of heterogeneous materials is considered for polycrystalline aggregates (scale H0) in Section
3.2.1and for hexagonal fiber assemblies (scales H1 and H2) in Section3.2.2. Periodic boundary conditions are prescribed at the boundary V . The displacement fieldu
¯ in V, then takes the following form:
= +
u x x v x x V
¯(¯) ˜ ¯ ¯(¯) ¯ (7)
where the fluctuation v¯ is periodic, i.e. it takes the same values at two homologous points on opposite faces of V. Furthermore, the traction vector n
˜ ¯takes opposite values at two homologous points on V (n¯ is the outwards normal vector to V ). The finite element
code used in this work (Z–set package, 2013) allows to prescribe the averaged strain components of˜ , or conjugate mean stress components (Besson et al., 2009).
3.2.1. Full-field model for polycrystalline aggregates
As illustrated inFig. 3, Cu grains are highly elongated along x1due to material processing, i.e. d/ . In order to take this
Fig. 5. FE meshes for columnar polycrystals: (a) The overall (mean) shape of a single grain elongated along direction x1with dimensions × ×d d; (b) Parallelepipedic tessellation of 225 grains (=15×15) with the aspect ratio d/ (periodic boundary conditions, denoted #, are considered); (c) Orientation distribution in the tessellation mesh (b), blue stands for 111 fiber texture and red for 100 ; (d) {100} Pole Figure and x1axis Inverse Pole Figure of Cu-0. Grain orientations are generated by the software LaboTex based on experimental EBSD textures. (For interpretation of the references to color in this figure legend, the reader is referred to the Web version of this article.)
morphological texture into account, a slice-shaped parallelepipedic tessellation (finite element mesh using c3d20r elements, i.e. quadratic brick element with 20 nodes and reduced integration with 8 Gauss points) was proposed inGu et al. (2017a), as shown in
Fig. 5. This tessellation is composed of15×15(=225) regularly arranged square grains, and it is subjected to periodic boundary conditions (Eq.(7)), thus taking advantage of a smaller RVE size than the one with homogeneous boundary conditions according to (Kanit et al., 2003). Furthermore, these 225 grain orientations obey the Orientation Distribution Function described in Section2.2, and the discrete orientations are spatially randomly distributed among the grains of the parallelepipedic tessellation.Fig. 5indicates the 111 and 100 fiber texture distributions, which are close to the EBSD orientation map ofFig. 2. The mesh density has also been selected as a compromise between numerical accuracy and computational time.
3.2.2. Full-field models for hexagonal fiber assemblies
The effective elasto-plastic behavior will be predicted for the hexagonal fiber assemblies of Cu-Nb composites at scales H1 and H2. As the specimens exhibit several characteristic scales, one of the modelling challenge is to account for the nonlinear behavior in the different scale transitions. This scale transition can be performed for elasto-(visco-)plastic heterogeneous materials with a complex and random microstructure in various ways, as mentioned Section1. In this regard, macroscopic models, e.g.Haddadi et al. (2006)
can provide an accurate homogenized behavior, however phenomenological parameter calibrations need to be repeated when the information at scale H0 changes. The FE2approach, e.g. (Feyel and Chaboche, 2000;Geers et al., 2010), required long CPU time despite applying parallel computational techniques. TFA/NTFA are promising models, e.g. (Michel and Suquet, 2016), and represent an alternative to the Finite Element method used in this work.
In the present work, in order to account for the elasto-(visco-)plastic behavior of hexagonal fiber assemblies of H1/H2 with a reasonable CPU time, a combination of the full-field FEM PH and the mean-field β-models is proposed, labeled as “PHi-β model”
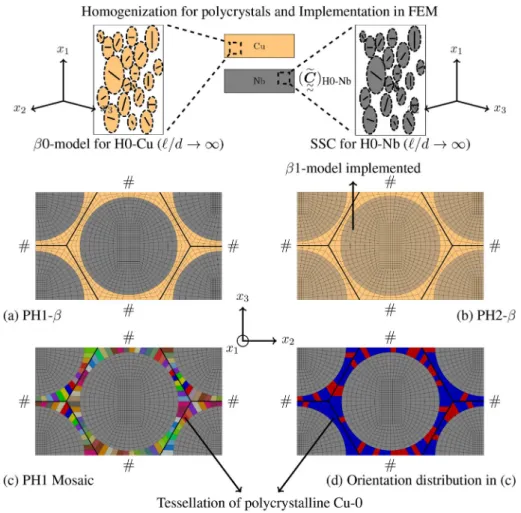
Fig. 6. Multiscale modeling of effective elasto-plastic behavior of Cu-Nb wires (Orange stands for Cu, gray for Nb, light gray for Cu-Nb composite):
(a) Using the PH1-β at scale H1, a periodic distribution of Nb fibers is assumed (# denotes periodic boundary conditions). The polycrystalline Nb and Cu-0 agregates are described by an effective elastic stiffness obtained by the SSC scheme and an elasto-plastic behavior provided by the β0-model, respectively (see the inset). (b) Using the PH2-β at scale H2, the behavior of the Cu-Nb composite H1 zone is provided by the β1-model, while that of the polycrystalline Cu-1 agregate is given by a β0-model accounting for the microstructure of Cu-1. (c) Using the PH1 Mosaic at scale H1, poly-crystalline Cu-0 surrounding the elastic Nb is described by a tessellation of polypoly-crystalline aggregates. (d) Orientation distribution in the tessellation of (c), blue stands for the 111 fiber texture and red for 100 .
(i = 1,2 for scales H1 and H2 respectively). The section views of the unit cell at H1 and H2, with their meshes, are respectively indicated inFig. 6(a) andFig. 6(b). Inspired from the parallelepipedic tessellation of FEM for polycrystals, another “PH1 Mosaic” model is introduced, as shown inFig. 6(c). These unit cells are subjected to periodic boundary conditions. They are composed of two equivalent long fibers (1 + 4×1/4 fibers) which are arranged in a hexagonal lattice, and they represent the (idealized) multi-scaled experimental microstructure of Cu-Nb wires. They contain all information about the morphological RVE at the effective scales H1 and H2.
Detailed descriptions of the above-mentioned models are as follows:
•
In the PH1-β model, Nb fibers are endowed with elastic properties with the effective stiffness tensor (denoted C˜ H0 Nb) de-termined by the SSC scheme applied to pure Nb polycrystalline agregate. These properties are taken from (Gu et al., 2017a). On the other hand, the mean-field β0-model is used to estimate the effective elasto-plastic behavior of the pure polycrystalline Cu-0 agregate with local nonlinear constitutive behavior described above, as illustrated in the upper insets ofFig. 6.
•
Similarly, for the PH2-β model at scale H2, the behavior of the H1 zone and of the Cu-1 surrounding matrix are provided to the β1-model (random mix of Cu-0 and Nb grains) and β0-β1-model (agregate of Cu-1 grains) respectively, as illustrated inFig. 6(b). The β-models will be presented in Section3.3and their reliability will be demonstrated in Sections4and5.•
The PH1 Mosaic model at H1 is composed of elastic Nb fibers and elasto-plastic Cu-0 channels. In these Cu-0 channels, individual grains are considered by a heterogeneous tessellation of polycrystalline aggregates, instead of a homogeneous medium used in the PH1-β approach. Based on experimental observations as inFig. 2, the transverse size d of Cu-0 grains varies from /3 to δ where δ denotes channel width of Cu. Here, d = /2is chosen to construct the mesh. The experimental 111 and 100 fibers textures are taken into account. Therefore, the tessellation of polycrystalline Cu-0 is able to account for the accurate information of crystal-lographic/morphological textures. In this work, we regard the responses of the PH1 Mosaic model as benchmarks at scale H1. Note that FEM PH models describe an infinite periodic honeycomb microstructure. However, the real architecture of Cu-Nb wires at all scales contains only a finite number (i.e. 85) of long fibers. Simulations of a larger hexagonal structure without periodic boundary conditions have been performed to check that the hypothetical periodicity does not significantly affect the results. Furthermore, the mesh density for the models at H1/H2 will receive further attention in Section5.2, due to strain localization phenomena occurring in the Cu matrix. Finally, it is noted that the calculations (including all the full-field approaches in this work) require a 2D analysis with generalized plane strain conditions in order to allow for homogeneous strain in the third direction and out of plane shearing. For that purpose, a 3D mesh with one single element in the thickness is used, together with suitable boundary conditions to keep flat upper and lower planes.3.3. Mean-field β-model
The full-field PH1-β model for hexagonal fiber assemblies at scale H1 requires a local constitutive law to describe the elasto-plastic behavior of polycrystalline Cu-0 matrix (similarly for PH2-β). In this regard, the mean-field method is used to estimate the effective behavior of polycrystalline materials at H0 and the found model is implemented in FEM as a polycrystalline constitutive law at H1. The mean-field approaches are often advocated to be CPU time saving models for polycrystalline aggregates, compared with FEM (Prakash and Lebensohn, 2009). Among a wealth of literature references for the mean-field schemes mentioned in Section1, the β-models (Cailletaud and Coudon, 2016;Coudon et al., 2018) are chosen in the present work, due to (1) its higher computational efficiency compared to other semi-analytical schemes, e.g.Turner and Tomé (1994)and (2) its suitability for the anisotropic behavior of multi-axial polycrystals. (1) is particularly beneficial for the iterative scale transition processes, as the PHi-β (i = 1,2) like models consume a lot of computational resources (Geers et al., 2010). Concerning (2), this model is suited for both Cu and Nb grains exhibiting highly elongated grains (i.e. d).
In this work, the β-models are categorized into two types, accounting for the various scales (seeappendix Afor the detailed formulation of the β-model):
•
β0-model. At scale H0, β-model can be used to describe the elasto-plastic behavior of polycrystalline agregates made of pure Cugrains. In this work, the β0-model takes into account three different Cu components, labeled “β0-model for H0-(Cu-i) (i = 0,1,2)”.
•
βi-model (i = 1,2). The β1-model constructs a fictitious material in which Cu and Nb grains are randomly mixed together, with thevolume fractions, textures, grain size dependent yield stress yand initial residual stresses˜resat H1 accounted for, but without considering the periodic architecture. In this way, the β1-model predicts the elasto-plastic behavior at scale H1. Similarly, the β2-model takes into account the microstructural information at H2, however without considering anymore the specific architecture (i.e. hexagonal fiber assemblies) of Cu-Nb wires. The predictive capability and computational efficiency of the proposed βi-models (i = 1,2) will be discussed in Section5. The proposition of such a model is based on findings ofGu et al. (2017a)in which it has been shown that the mean-field SSC scheme reliably estimates the effective elastic behavior of Cu-Nb wires not only at scale H0, but also at scales H1/H2 assuming a sole random mixture of Cu/Nb grains.
Hereafter, a mechanical phase (r) denotes the set of all grains in the microstructure that exhibit the same crystal orientation with a given precision; those grains have however different shapes and environment. The scale transition interaction equation of β-models is
the following (seeAppendix Afor the detailed derivation and corresponding assumptions): =B +L + ˜( )r ( )r: ¯˜ C: (˜ ˜r) ˜ r * ( ) res( ) (8) where B( )r and ˜ r
res( )denote respectively the stress concentration tensor (estimated according to the elastic SSC scheme) and the initial residual stress in phase (r). It provides the mean stress in each phase( )r as a function of the overall stress ¯
˜ and of the plastic
accommodation variables
˜
r
( ). The stress heterogeneity from phase to phase results from the deviation of the β-variables
˜
r
( )from their effective value
˜ (seeAppendix A). The accommodation tensor LC
*is expressed as: = L C˜: I S C * Esh (9)
with I the fourth order identity tensor and SEshthe Eshelby tensor for spheroidal inclusions with ratio d/ . Here, SEshdepends on the effective stiffness tensorC (instead of the elasto-plastic tensor L as in Hill's proposition) and on the morphological texture d/ . In order to correct the errors caused by the assumption of using only the elastic behavior for determining LC*, the variables
˜introduce a
plastic accommodation associated with plastic strain tensors˜ r
p( )in each phase. The evolution equation for the β-variables reads:
= D ˜ ˜ :˜ ˜ r r r r ( ) p( ) ( ) p( ) (10) where˜ r
p( )denotes the von Mises equivalent plastic strain rate. Analogous to˜p( )r,
˜
r
( )variables are initialized as 0
˜ before loading. The evolution equation(10)is similar to a nonlinear kinematic hardening rule (Besson et al., 2009). In this equation, D denotes a fourth order phenomenological constant tensor to be calibrated, in such a way that the β-model responses fit the stress-strain curve obtained by the benchmark FEM (as indicated in the algorithm ofFig. 4). It means that the FEM unit cell simulations serve as input data for the calibration of some parameters of the β-models. These models can therefore be seen as reduced order models driven by explicit evolution equations, instead of integral differential equations very often encountered in more classical homogenization methods. This model feature contributes to CPU time saving, the price to pay being the calibration of the scale transition coefficients. In this work, the tensor D is assumed to have constant values irrespective of the phase( )r . It admits x1as a symmetry axis and takes the form:
= D D D D D D D D D D D D D . 11 12 12 12 33 23 12 23 33 44 55 55 (11)
which is similar to the form also used in (Sai et al., 2006;Martin et al., 2014) for columnar grain morphology. In the material frame, assuming the deviatoric property of the accommodation variable, i.e. trace(
˜
r
( )) = 0, the following additional condition is enforced according to Eq.(10)(Sai et al., 2006):
= +
D11 D33 D23 D .12 (12)
Therefore, there are five independent coefficients Dij to be determined, see Section4.3 for the corresponding identification
strategy.
Finally, the definition of the overall variable
˜ in Eq.(8)is derived from the homogenization condition =˜ ˜( )r , which gives
= L B L ˜ : : :˜ . r r C * 1 ( ) C * ( ) (13)
3.4. Statistical representative volume element
When a single realization over the elementary volume V (e.g. polycrystalline aggregates at H0) is used, a relatively limited number of grain orientations and grain neighborhoods are accounted for. This leads to a bias in the estimation of the effective properties, as explained in (Kanit et al., 2003). The RVE must contain a sufficiently large number of heterogeneities (e.g., grains, inclusions, fibers etc.) for the macroscopic properties to be independent of the boundary conditions applied to this volume.Kanit et al. (2003)proposed a statistical strategy to determine the RVE size for elastic moduli.
In this work, this approach is extended to elasto-plasticity by considering n realizations of the microstructure in a volume with given size. This volume size is then increased to investigate the asymptotic elasto-plastic stress (or strain):
= = = = Z t n n Z t D t n n Z t Z t ¯ ( ) 1 ˜ ( ), ( ) 1 [ ˜ ( ) ¯ ( )] i i Z i i 1 2 1 2 (14) where Z t˜ ( )i is an apparent elasto-plastic stress (or strain) obtained for one realization, andZ t¯ ( )is its mean value over n realizations at
obtained mean valueZ t¯ ( )does not vary any longer up to a given precision when n is increased. This precision (i.e. relative error
t
( )
rela ) of the estimation of the effective propertyZ t¯ ( )is related to the standard deviation D t()Z and the number of realizations n by: = t D t n Z t ( ) 2 ( ) ¯ ( ) . Z rela (15) Conventionally, if at any time t during the loading path, rela( )t 1.5%, we consider that the RVE size is reached. The overall effective elasto-plastic response is then defined by the mean value over n realizations,Z t¯ ( )and the 95% confidence interval is given by[ ¯ ( )Z t 2D t Z tZ( ), ¯ ( )+2D tZ( )].
From the Orientation Distribution Function described in Section2.2, four sets of 10000 discrete orientations (for Cu-0, Cu-1, Cu-2 and Nb) are created by LaboTex .2They are used to generate the microstructures for the full-field/mean-field scale transition models. At scale H0, for the FEM for polycrystalline aggregates, 20 realizations were performed and found to fulfill the statistical require-ments for all the loading conditions considered in this work. This corresponds to a total of 4500 (20×225) crystallographic or-ientations chosen randomly from the full data set. In addition, 95% confidence intervals for the average stress˜ (and average strain ˜ ) deduced from these realizations will be plotted hereafter by error bars. Note that strain intervals will only be shown at the ultimateloading stage for the sake of clarity. At scale H1, the statistical RVE still requires 20 realizations for the PH1 Mosaic model, i.e. 2400 ( ×20 120) crystallographic orientations of Cu-0. For the PH1-β model, as a compromise between precision and CPU time, 120 grain orientations are considered in a single realization for the β0-model which serves as the local constitutive behavior of H0-(Cu-0). Here, 20 realizations are required for the PH1-β model, the same as in the PH1 Mosaic model. At H2, 20 realizations are also performed for the PH2-β model in which the β1-model and β0-model take into account 240 orientations (120 for Cu-0, 120 for Nb) and 120 orientations (for Cu-1) respectively. Furthermore, the same number of orientations (RVE size) is used in the mean-field β-models at all scales as in the corresponding full-field models. It turns out that, in contrast to the full-field simulations, the results of β-models display negligible scatter, probably due to the large number of grain orientations considered. For example, at H0, the β0-model includes for 4500 orientations, the same as the total number of grains considered in FEM for polycrystalline aggregates. The un-certainty related to statistical RVE size (i.e. the error bars in the homogenized stress-strain curves) will be shown in Section4and Section5for the model responses at H0 and at H1/H2 respectively.
4. Homogenization at scale H0
4.1. Parameter identification for the single crystal plasticity model
This section is devoted to the homogenization at scale H0, i.e. to the estimation of effective behavior of polycrystalline Cu and Nb agregates separately.Table 3provides the cubic elastic constants C (Voigt convention) of Cu and Nb single crystals. Previously,Gu et al. (2017a)has already predicted the effective elastic properties of Cu-Nb wires at various scales via SSC homogenization scheme, accounting for the specific morphological/crystallographic textures. Theses model results were validated systematically by both macroscopic tensile tests and in-situ diffraction data with a good agreement. For the polycrystalline Nb at H0, its five effective elastic moduli in the transverse isotropic stiffness C
H0 Nb
are reported inTable 3, based onGu et al. (2017a). These elastic properties are used as the local behavior of Nb fibers in PH1-β and PH1 Mosaic models.
We now proceed to the estimation of the effective elasto-plastic behavior of Cu polycrystals. At first, the model parameters for the single crystal plasticity will be identified, then these parameters will be used for Cu-Nb composite wires. In this work, the experi-mental stress-strain curve of a pure highly hardened OFHC Cu wire is chosen as the reference copper behavior. These pure Cu wires were obtained by severe cold-drawing at room temperature, the diameter of cylindrical sample was reduced from15 mmto 0.29 mm. It should be noticed that, at the end of fabrication steps, Cu-Nb wires experience a similar process, i.e. supplementary cold-drawing. Thus, it is believed that the pure highly hardened OFHC Cu exhibits a mechanical behavior similar to the Cu components in Cu-Nb wires.
Both EBSD and tension experiments for the pure Cu wires were carried out at Centre des Matériaux Mines ParisTech. It was found that the pure Cu wires exhibit a 111-100 (50% for each) double fiber texture and elongated grain shape with respect to x1axis, which is similar to the crystallographic/morphological textures of Cu components in Cu-Nb wires. Monotonic tensile tests along x1 were performed with a strain rate 5× 10 s5 1at 293K. In an effort to determine the total specimen strain with a high accuracy during the tensile test on the wire, the Digital Image Correlation (DIC) technique was used, see e.g.Pan et al. (2009).Fig. 7shows the experimental results of the tensile test. The data processing of 2D DIC leads to an uncertainty < ± 0.02% for the longitudinal strain. The stress values are computed from the tensile force and the corresponding uncertainty is estimated as ± 15 MPa due to stress relaxation during image acquisition. Moreover, the macroscopic longitudinal Young's modulusE1and yield stress y(with a
con-ventional criterion of 0.02% plastic strain) along the wire direction x1are found respectively to be 130 GPa and 350 MPa. Thus, the pure Cu wires display a similar yield stress compared with the Cu components in Cu-Nb wires estimated in Section2.4. Finally, the specimen breaks at an applied strain 1.2%.
Several authors have identified some parameters of the single crystal Méric-Cailletaud model for recrystallized OFHC copper, generally with grain size 100 mµ , in various situations: Cu bicrystals under cyclic tension-compression with ¯min,max= ± 0.1% and
± 0.5% (Méric et al., 1994); Cu polycrystals under monotonic tension with ¯max up to 10% and under cyclic loading with ¯min,max= ± 0.5% (Šiška et al., 2006;Musienko et al., 2007); Textured Cu polycrystals under cyclic loading with ¯min,max= ± 1.0% (Gérard, 2008;Gérard et al., 2013). In the present work, the values Q, b, C, D andhij(interaction matrix) found byMusienko et al.
(2007)are chosen as initial estimation. In fact, the combination of parameters byGérard (2008)leads to similar results. In the case of quasi-static mechanical tests (strain rate < 10 s2 1) at293 K, strain rate sensitivity of OFHC Cu is negligible (Meyers et al., 1995;Lu
et al., 2001). Viscosity parameters K and n are assigned to 2.0 MPa s1/nand 15.0 respectively. Recrystallized OFHC copper studied in
Musienko et al. (2007)exhibits a yield stress y 10 MPa much smaller than the one estimated in our case ( yup to 350 MPa). In this
work, R0is identified as 118.0 MPa by fitting the model responses of FE polycrystals to the tensile test data, with a satisfactory match, seeFig. 7. As for Cu-0 (δ = 310 nm), an even higher yield stress of 500 MPa is estimated, due to the grain size effects. This requires a
Table 3
Model parameters used in this work for elasticity, single crystal plasticity and the β-models. The notations and values for the independent moduli of the transverse isotropic H0-Nb material are taken fromGu et al. (2017a). The same parameter combination of Dijis chosen for all the β-models at all scales. The CRSS R0is 118.0 MPa for Cu-1 and Cu-2 polycrystalline agregates but rises to 170 MPa for Cu-0 due to size effects (δ =310 nm).
Elasticity
C11(GPa) C12(GPa) C44(GPa)
Cu 167.2 120.7 75.7
Nb 245.6 138.7 29.3
E˜1(GPa) ˜12 K˜23(GPa) µ˜12(GPa) µ˜23(GPa)
C
H0 Nb
95.9 0.408 185.7 39.5 37.0
Single crystal plasticity
Isotropic hardening Kinematic hardening Viscosity
Q (MPa) b R (MPa)0 C (MPa) D K (MPa 1/n) n
6.0 15.0 118.0 or 170.0 4500.0 600.0 2.0 15.0
h1 h2 h3 h4 h5 h6
1.0 4.4 4.75 4.75 4.75 5.0
Din β-models (D11=D33+D23 D12, other components are zero)
D11 D12 D23 D33 D44 D55
200 200 185 215 70 240
Fig. 7. Identification of phenomenological parameters for single crystal plasticity: FEM results are compared to experimental data for the pure
CRSS R0of 170 MPa. All the model parameters of single crystal plasticity are summarized inTable 3. Except for R0, Cu-0, Cu-1 and Cu-2 in Cu-Nb wires will share the same parameter combination.
4.2. Results of FEM for polycrystals
In this section, the simulation results obtained by FEM for Cu polycrystals are provided. They will be served as references for the parameter identification of the β-model. Results are provided considering the crystallographic texture of Cu-0 indicated inTable 2
and single crystal parameters indicated inTable 3withR0=118 MPa(i.e. y=350 MPa corresponding to δ =2.19 mµ ). Taking into
account the expected transverse anisotropic behavior, the four following loading conditions of the RVE are successively considered:
•
¯11= 2% for the Longitudinal Tensile test (denoted LT hereafter);•
¯22= 2% or ¯33= 2% for the Transverse Tensile tests (TT);•
¯23= 1.5% for the Transverse Shear test (TS);•
¯12= 1.5% or ¯31= 1.5% for the Longitudinal Shear test (LS).Fig. 8shows successively the volume average stress-strain curves at scale H0-(Cu-0) for the four loading conditions. In TT loaded along x2orx3, the model responses are similar. For a single microstructure realization, the deviation relais not negligible ( 5%) due to the limited number of crystallographic orientations considered. Therefore, 225 grains are not sufficient to constitute an accurate RVE. TT results are thus determined by the average model responses along x2andx3directions. A similar procedure is used for LS tests. Furthermore, in order to investigate the heterogeneities of model response at H0-(Cu-0),Fig. 9shows the average stress-strain
Fig. 8. Effective elasto-plastic behavior of the polycrystalline Cu-0, i.e. at scale H0-(Cu-0), obtained by the FEM for polycrystals and the β0-model.
Various loading conditions are presented: (a) Longitudinal Tensile (LT) test, (b) Transverse Tensile (TT) test, (c) Tranverse Shear (TS) test and (d) Longitudinal Shear (LS) test. See Section4.2for the conventions of loading conditions.
of 100 and 111 fiber components separately (denoted (˜ ˜)H0 ( 100 Cu 0)and (
˜ ˜)H0 ( 111 Cu 0)respectively).
As shown inFig. 8(a) and (b), an anisotropic response at H0-(Cu-0) is observed, the effective behavior in LT displaying a stronger response than the one in TT. Yield stresses of LT and TT are about 355 MPa and 300 MPa respectively.Fig. 9(a) and (b) reveal that the 111 fiber exhibits higher stress levels than the 100 fiber in LT. Conversely, 100 fibers tend to be stronger than 111 ones in TT. Also, the anisotropic effective Young's moduli of polycrystals Cu and the ones of individual fiber texture components can be found inGu et al. (2017a). In LT, all the grains experience the same axial strain so that plastic activity occurs in 100 oriented grains at a higher strain ¯11(also, at a higher applied stress ¯11) than in 111 ones, as illustrated inFig. 9(a). On the other hand, the yield stress of
111 is higher than 100, displaying about 420 MPa and 270 MPa respectively. This phenomenon will receive further attention for analyzing experimental data in Section6.4.
4.3. Parameter identification for the β-models
The previous FEM full-field results at H0-(Cu-0) for polycrystals now serve as references for the identification of the mean-field
β0-model. The parameters to be identified are limited to the components of the phenomenological tensor D appearing in Eq.(10). All the test responses LT, TT, TS and LS discussed in the previous section are used for the identification process of the β0-model. It is found that the parameters D11, D12,D23and D33can be calibrated from the LT and TT overall responses. Moreover,D44andD55control respectively the responses for TS and LS. Optimal values forD44andD55can be found, but the combination of D11, D12,D23and D33is not unique, despite additional constraints have been introduced with Eq.(12). Here, a value D11is chosen to have a similar magnitude thanD55. All the non-zero components in D are reported inTable 3.
As illustrated inFigs. 8and9, it is remarkable that the FEM for polycrystals and the β0-model responses at H0-(Cu-0) are in a
Fig. 9. Effective behavior of the individual 111 and 100 fiber textures at scale H0-(Cu-0), obtained by the FEM for polycrystals and the β0-model.
Various loading conditions are considered: (a) LT, (b) TT, (c) TS and (d) LS tests. Blue stands for the 111 fiber texture and red for 100 . (For interpretation of the references to color in this figure legend, the reader is referred to the Web version of this article.)
general good agreement, not only for the effective behavior, but also for the average behavior of each individual fiber texture components. These results demonstrate that the fast computing β0-model is an efficient homogenization tool for polycrystals at H0. However, an overestimation of hardening by the β0-model is observed inFig. 9compared with the reference, especially for the 100
fiber, with differences up to 15%, in TT, TS and LS. Conversely, the deviation between the FEM and the β0-model responses in LT is rather small, 5%. We have checked that differentDijcombinations will not reduce this deviation, showing that the found set of
parameters is a compromise with respect to the quality of stress prediction for the various tests. The limitations of β-model must be related to simplicity of the explicit scale transition rule Eq.(8). In particular, it is believed that the observed error is mainly caused by the fact that the considered elastic interaction (as in Kröner's approach) is not fully corrected by the introduction of internal variables
β. This feature is amplified by the high contrast between the stress responses of the individual fiber textures.
The β0-model is also used to describe the elasto-plastic behavior of Cu-1 and Cu-2 which have different textures. Based on the values calibrated for Cu-0, the parameters D can still be slightly modified for various Cu components. However, very limited im-provement is found by using D calibrated specially for Cu-1 or Cu-2. Similarly, D can also be slightly modified for the β1-model and
β2-model, with again limited improvement. Thus, for the sake of simplicity, the same parameter combinationDijis chosen for all the β-models at all scales.
5. Scale transitions up to H1 and H2 for architectured Cu-Nb composites
Iterative scale transition steps are now performed up to H1 and H2 scales for the Cu-Nb wires arranged in multiscale hexagonal fiber assemblies. In Section5.1, the results at scale H1 obtained by full-field PH1-β and PH1 Mosaic models and mean-field β1-model are provided. The comparison of model responses reveals a good agreement, however differences between these models are still observed, up to 15% in some cases. In Section5.2, the main factors that contribute to these deviations are analyzed. In Section5.3, based on the models at scale H1, scale transition steps up to H2 accounting for elasto-plasticity are proposed (i.e. PH2-β and β2-model). Finally, in Section5.4, the error propagation within a hierarchical multiscale modeling approach is discussed. This leads to the selection of the best-suited modeling strategy for Cu-Nb composite wires.
5.1. Results at scale H1
The mean-field β0-model has been demonstrated to be an efficient homogenization tool to describe the effective elasto-plastic behavior of pure polycrystalline Cu, in Section4.3. Now, we proceed to the homogenization of the assembly of 851elementary long fibers, i.e. scale H1. The PH1-β approach takes the β0-model as local constitutive law for the Cu-0 matrix in the FE computation. In addition, an alternative PH1 Mosaic model is proposed which takes the copper matrix as a grain microstructure directly. Both full-field PH1-β and PH1 Mosaic models account for a periodic Cu-Nb hexagonal fiber distribution. Besides, in order to save CPU time and to perform the scale transitions from H1 to H2, the simple mean-field β1-model will be used assuming a microstructure consisting of the sole random mixture of Cu and Nb phases (Section3.3).
InFig. 10, the effective elasto-plastic behavior at H1 is predicted by these three homogenization approaches for the LT, TT, TS and LS tests. A good agreement is seen among the model responses at H1, even though deviations are observed, e.g. the β1-model displays a flatter plastic behavior in TS and LS, compared with the other two full-field model responses. In order to investigate the origins of these discrepancies and to study the heterogeneities of model responses among the phases, stress-strain curves of each individual component at H1, i.e. Nb and Cu-0, are plotted inFig. 11. It is remarkable that all these three models provide generally close results for both the effective behavior at H1 and the “local” behavior of each individual component. The deviations among models will receive further attention in Section5.2.
For the LT test, the effective longitudinal Young's modulus is found to be 110 GPa (97 GPa for Nb and 149 GPa for Cu-0). Once plastic activity occurs in Cu-0, the effective tangent modulus at H1 becomes 73 GPa. The tensile stress of Nb component is as large as 2 GPa when (¯ )11 H1 Nb= 2% is imposed. In addition for LT, all components are subjected to a uniform longitudinal strain, i.e.
(¯ )11 H1 = (¯ )11 H1 Nb = (¯ )11 H1 (Cu 0). This is because the microstructure is made of elongated Nb fibers/Cu-0 tubes, and these ponents are deformed in parallel along the longitudinal direction. On the other hand, in TT, TS and LS, strains in Nb/Cu-0 com-ponents are not uniform due to the heterogeneous architecture at H1, and also due to the property contrast between elastic Nb and elasto-plastic Cu-0. At the ultimate loading stage, Cu-0 undergoes an average strain up to 5%; in contrast, average strain in Nb is as small as 1% for TT and 0.5% for TS and LS.
5.2. Strain localization phenomena for shear loading conditions
The largest discrepancy between the responses of the H1 of PH1 Mosaic, PH1-β and β1-models is found for transverse shear loading (TS), as it can be seen fromFig. 10(c) andFig. 11(c). Both full-field PH1 Mosaic and PH1-β models predict a softening behavior of Cu-0 at H1. In contrast, the β1-model predicts a slowly hardening response. The reason for this softening behavior is the formation of intense shear bands in the Cu-0 matrix, as shown by the distribution of shear strain component 23predicted by PH1-β and PH1 Mosaic inFig. 12(a) andFig. 12(b), respectively. The observed localization bands tend to avoid the stiff Nb fibers. The highest strain localization (local shear strain up to 15% and 10% for PH1-β and PH1 Mosaic respectively) occurs at the intersection points of localization bands and Nb fibers. According toIdiart et al. (2006), this phenomenon is often observed in full-field model responses due to the localization of strain field into bands running through the composite, along certain preferred orientations
determined by the loading conditions. Moreover, note that the homogeneous β0-model in PH1-β leads to a stronger strain localization and a softer plastic behavior, compared with the heterogeneous tessellation of PH1 Mosaic. This is due to the fact that grain boundaries represent obstacle to the shear band propagation, such grain boundaries being absent in the β0-model in PH1-β. In addition, we have also verified that higher mesh density will also lead to a stronger strain localization, without changing the con-stitutive law of pure copper. Similar strain localization phenomena also occurs for TT and LS tests. In contrast, this phenomenon is rather negligible in LT test due to the uniform longitudinal strain prescribed in Cu and Nb.
On the other hand, the responses of mean-field β1-model does not display a softening at H1, as strain localization only occurs in full-field models. As explained in Section4.3, the β-models tend to overestimate hardening due to the model assumptions. Mean field homogenization models are not designed for capturing localization effects. Furthermore, disregarding the hexagonal fiber assembly morphology at H1 in the β-models is believed to be another factor contributing to the model response deviations.
5.3. Iterative scale transition process up to H2
At scale H2, we suppose that 85 continuum cylinders are composed of two distinct zones: (1) the effective Cu-Nb composite zones containing 851elementary long fibers (i.e. H1 zone); (2) the embedding matrix Cu-1. At this scale, the full-field PH2-β and mean-field
β2-models are introduced. It has been proved previously that the β1-model and β0-model predict reliably the elasto-plastic behavior
of H1 zone and polycrystalline Cu, respectively. Thus, the PH2-β model takes these β-models as the local constitutive behavior of H1 zone and Cu-1. In addition, a three-phase (i.e. Nb, Cu-0 and Cu-1) β2-model can also be defined to predict the elasto-plasticity at H2 without considering anymore the specific architecture.
The results of both models are reported here. The effective behavior and the average “local” behavior of each individual com-ponent are plotted inFig. 13andFig. 14, respectively. In the captions, homogenization of the individual H1 zone and Cu-1 at H2 are
Fig. 10. Effective elasto-plastic behavior at scale H1, obtained by the PH1 Mosaic, PH1-β, and β1-model. Various loading conditions are presented:
Fig. 11. Effective behavior of the individual Cu-0 and Nb components at scale H1, obtained by the PH1 Mosaic, PH1-β, and β1-model approaches.
Various loading conditions are presented: (a) LT, (b) TT, (c) TS and (d) LS tests.
Fig. 12. Shear strain 23distribution predicted by the (a) PH1-β and (b) PH1 Mosaic models at scale H1 with an overall effective transverse shear (¯ )23 H1=1.5% imposed in the TS test.