Development of Techniques to Determine Temperature Coefficient of MASSACHUSETTS INSTITUTE OF TECHNOLOGY
JUL 16 2019
LIBRARIES
ARCHIVES
Resistance by Scott Y. Seo Submitted to theDepartment of Mechanical Engineering
in Partial Fulfillment of the Requirements for the Degree of Bachelor of Science in Mechanical Engineering
at the
Massachusetts Institute of Technology
June 2019
C 2019 Massachusetts Institute of Technology. All rights reserved.
Signature of Author:
Signature redacted
Department of Mechanical Engineering May 22, 2019
Signature redacted
Certified by: Director o'Signature redacted
Dr. John G. Brisson f MIT/SUTD Collaboration Office Thesis SupervisorAccepted by:
Maria Yang Professor of Mechanical Engineering Undergraduate Officer
Development of Techniques to Determine Temperature Coefficient of
Resistance
by Scott Y. Seo
Submitted to the Department of Mechanical Engineering on May 22, 2019 in Partial Fulfillment of the
Requirements for the Degree of
Bachelor of Science in Mechanical Engineering
ABSTRACT
The focus of this thesis was to develop a simple, repeatable method for characterizing the relationship of different materials' electrical resistance with respect to temperature. A measurement of this relationship is the temperature coefficient of resistance (TCR). Determining the TCR allows a material to be used as a temperature probe and can be utilized in thermal conductivity measurements. The test apparatus and measurement setup proved capable of determining the temperature coefficients of resistance of a copper-alloy wire and a carbon film resistor, giving TCR values of 0.0036 1/K and -0.00014 1/K, which was consistent with their published values. The work of this project aims to aid in the development of a micro-cooling system, which uses polycarbonate for its heat exchanger at cryogenic temperatures. A potential carbon film temperature probe was tested, but was found to be unfit for the intended use as a temperature probe on a polycarbonate surface due to catastrophic failures in the film, most likely caused by the different thermal expansion rates of the carbon and polycarbonate. Further research should be conducted to first find a more suitable temperature probe for polycarbonate and then conduct tests at cryogenic temperatures.
Thesis Supervisor: Dr. John G. Brisson
Title: Director of MIT/SUTD Collaboration Office
Acknowledgments
The author would like to thank Dr. John G. Brisson and Jacob Lazer Adams for giving the opportunity to conduct the thesis research in their lab and for their continual guidance throughout the process.
Table of Contents Abstract 2 Acknowledgements 3 Table of Contents 4 List of Figures 5 1. Introduction 6 2. Background
2.1 Determining the remperature roefficient of resistance 7 2.2 Temperature coefficient of resistance for thermal conductivity measurements 7 2.3 Choosing resistive materials to use as temperature probes 9 3. Experimental Setup
3.1 Box setup for room temperature tests 11
3.2 Copper plate setup 13
3.2.1 Copper-alloy wire setup 14
3.2.2 Carbon film resistor setup 15
3.2.3 Carbon film line setup 16
3.3 Electrical measurement setup 18
3.4 Data analysis techniques 19
4. Results and Discussion
4.1 Copper-ally wire results 20
4.2 Carbon film resistor results 21
4.3 Carbon film line results 22
5. Conclusion 24
6. Appendices
Appendix A: Procedure for Measurement Taking 25
Appendix B: Measurement Computation USB-2404-UI Resistance and
Voltage Connections 26
7. References 27
List of Figures
Figure 1: Diagram of 30) method setup. 7
Figure 2: Graph of resistance versus temperature of various materials 9 Figure 3: Diagram of insulate box setup for room temperature tests 11
Figure 4: Picture of the physical box setup 12
Figure 5: Setup of the copper plate 13
Figure 6: Setup of the copper-alloy wire connections 14
Figure 7: Copper plate setup for the copper-alloy wire 15
Figure 8: Electrical connection setup for the carbon film line 16 Figure 9: Setup of the polycarbonate-carbon-film block on the copper plate 17
Figure 10: Setup of the electrical measurement system 18
Figure 11: Results from the copper-alloy wire test 20
Figure 12: Results from the carbon film resistor test 21
1. Introduction
The focus of this thesis is to develop a method for measuring the electrical resistance of materials as a function of temperature. An apparatus was fabricated to control the heating of the materials and to digitally collect the resistance and temperature data. The relationship between the resistance and temperature can be used to find the temperature coefficient of resistance [1]. Knowing the resistance-temperature relationship allows the resistive material to be used as a thermometer.
Ultimately, the thermometers characterized here are intended to be used to measure thermal properties of polycarbonate at low temperature. The properties will then be used to help design and characterize cryogenic heat exchangers made from polycarbonate material. The process of making these heat exchangers is to heat and draw down a premade block of polycarbonate (with heat exchange channels) to a small diameter. Transverse measurements of the thermal conductivity of this structure are not easily made using standard constant-temperature-gradient techniques, but rather, are more easily done with oscillating heat load ("3o") techniques [2][3][4].
The 3o method uses a thin resistive wire that is embedded in, or film deposited on the material whose thermal properties are to be measured [2][3][4]. This resistive material wire or film (with known temperature coefficient of resistance) is then heated with a sinusoidal current. The heating of the film results in temperature oscillation of the film that can be directly measured as a change of resistance of the heater. From the measurements, the thermal properties of the substrate can be deduced [2][3][4].
This work focuses on developing methods to characterize and identify potential resistive film materials that can be used to measure the thermal properties of stretched polycarbonate at low temperature. A film thermometer made from PELCO* High Temperature Carbon Paste is tested in this work, but first a copper-alloy wire and carbon film resistor are tested to gain confidence in the measurement methods. In addition, the tests presented in this work are at temperatures around room temperature to validate the methods before testing at cryogenic temperatures.
2. Background
2.1 Determining the temperature coefficient of resistance
The given resistivity of any material is generally given at its room temperature value (20-25 *C) [1]. However, every material will change its resistance depending on the temperature. To find the temperature coefficient of resistance (TCR), the resistance of a material must be related to its temperature. The equation to calculate the TCR, denoted as 0, is
1
=
dR
(1)
Rref dT'
where Rref is the reference resistance measured at room temperature (Q) and dR/dT is the temperature derivative of the resistance-temperature curve (/K).
p
(1/K) indicates how much a material's resistance will change due to a certain temperature change. If the temperature coefficient of resistance does not vary greatly, Equation 1 can be approximated as a linear relationship1 AR
= -Rref AT' AT' (2)
where AR is the change in resistance (f2) and AT is the change in temperature (K).
2.2 Temperature coefficient of resistance for thermal conductivity measurements The temperature coefficient of resistance,
p,
is integral for the calculation of the thermal conductivity of a substrate using the 3o method. The 3O method puts a resistive line in contact with the material of interest and uses the line as both a heater and temperature probe [2] [3] [4].R,..
z
Figure 1. Diagram of 3o method setup. An AC current is driven through a resistive line with known resistance, R, and
1,
which induces heat generation. The heat is dissipated across the thickness of the substrate, which induces temperature oscillations in the resistive line. These oscillations are directly related to the thermal diffusivity, a, and can be directly measured by the change in resistance of the resistive line. The thermal diffusivity can be related to thermal conductivity through the substrate's density and specific heat capacity.i sin
ot-J
Figure 1 shows the general setup of the 3o method. Heat is generated in the resistive line with a known resistance, R, and temperature coefficient of resistance,
P,
by inputting a known driving AC current. The heat conducts into the substrate, causing variations in temperature of the resistive line. The temperature oscillations, in turn, induce variations in the resistance of the line. This relationship is derived from Equation 2:AR = RrefI3lAT. (3)
The calculated temperature oscillations can then be used to determine the thermal
k
diffusivity, a, of the substrate. Thermal diffusivity is defined as -, where k is the thermal
conductivity, p is the density of the substrate, and cp is the specific heat capacity of the substrate. If the density and specific heat capacity of the substrate are known, then the thermal conductivity can be calculated.
2.3 Choosing resistive materials to use as temperature probes 100000 10000 1 000 100 10 I 10 T (K) 100 1000 -.- Pt 100 --- RhFe Allen Bradley 100 Cemox CX1050 N
0
Figure 2. Graph of resistance versus temperature of various materials. The black curves correspond to metallic sensors and the grey curves correspond to semiconductor sensors. The slopes of the resistance-temperature curves of the metals at cryogenic temperatures (<123 K) are much smaller than those of the semiconductors curve [5]. This makes the semiconductor sensors more suitable as temperature sensors at low temperature ranges. [6]
As mentioned before, different materials have different resistance-temperature relationships. In general, temperature probes directly use the resistance-temperature relationship to determine temperature. The 3o method measures the amplitude of small temperature oscillations about a mean temperature. The temperature change measured by thermometer is directly proportional to its resistance change, AR = Rrejf AT. This equation shows that having a
larger temperature coefficient of resistance allows for more sensitive temperature oscillation readings. Every material's temperature coefficient of resistance varies with temperature, so the resistive material must be chosen based on its
p
value for the expected testing temperature. The end application for this work's findings is characterizing a heat exchanger material at cryogenic temperatures, therefore, the resistive material chosen for the 3o method must have a significantp
at low temperatures.Figure 2 shows several materials' resistance-temperature curves for temperatures between 1 and 300 K [6]. The graph shows the resistance-temperature curves for various sensors made out of different materials. The grey curves correspond to semiconductor materials, while the black curves correspond to metals. One difference between the metals and the semiconductors is the sign of their slopes. Metals and semiconductors react differently on an atomic level with temperature
variation, so that in general, it is expected that a metal should have a positive resistance-temperature relationship, whereas the semiconductors should have a negative relationship. However, the sign of the slope does not affect the material's ability to serve as a temperature probe. The most important factor is the magnitude of the slope. The semiconductors have steeper slopes in the lower temperature ranges than the metals which makes them the preferred material for temperature sensing at cryogenic temperature ranges (<123 K).
The carbon film being tested in this project was chosen due to carbon's semiconductor-like property behavior which should follow a resistance-temperature trend that is similar to the grey traces of Figure 2. A carbon film can be applied in very thin lines, making it ideal for testing the micro-cooler's heat exchanger structure. While the final tests will look to determine polycarbonate's thermal conductivity at cryogenic temperatures, the carbon film, along with the other resistive materials in this project, will be tested at room temperature to verify the measurement method's capabilities.
3. Experimental Design
3.1 Box setup for room temperature tests
Figure 3 shows a diagram of the setup used for the isolation box intended for room temperature testing. The box itself is aluminum lined with fiberglass insulation. In the box, the resistive material is placed on a plate of copper, which is heated using a flexible Kapton heater. The resistance and temperature of the sample are monitored through the use of a data acquisition (DAQ) device. The resistive sample has two ports for the option of conducting a four-wire measurement (as shown in Figure 3). The temperature probe used was a LakeShore Cryotronics, Inc. Model DT-470-SD- 13. Depending on the sample's thermal mass, the temperature probe can either be put on the copper plate or directly on the sample itself. If the thermal mass of the sample is too large, the sample's temperature must be directly measured. An electrical insulator was placed between the copper plate and the sample to ensure there was no risk of electrical shorting. The BNC port for the temperature probe needs to have a BNC T-union to separate the power supply to the temperature probe and the voltage readout from the probe, shown in Figure 4.
Aluminum Box Electrical Insulator (plastic film) Copper_ Plate Specimen -Temperature , Probe Insulation --4 ,-5 Floating BNC ports:
. 1 for additional temperature
probe (optional) * 1 for temperature probe * 1 for Resistance readout from
specimen
- 1 for Current into resistor
specimen (for 4-wire)
- 1 for power to heat copper
plate
Heater
Figure 3. Diagram of the insulated box setup for room temperature tests. The box is aluminum and insulated using fiberglass. The heater is on the bottom of the copper plate (although pictured differently). The temperature probe is placed close to the specimen on the top of the plate. A very thin plastic film (-0.03 mm thick) was placed between the copper plate and the specimen to ensure no electrical shorting could occur. The temperature across the copper plate is assumed to be uniform across the whole area. The BNC ports are floating and are connected to pin head female connectors to allow for easy interchangeability of components. A more in-depth view of the copper plate setup can be found in Figure 5.
- j
Figure 4. Picture of the physical box setup. In the red box is the BNC T-Union used for the temperature probe. One side supplies the current to power the probe, the other gives the voltage readings to the DAQ. In the blue box are the pinhead connectors used to connect the copper plate setup to the power supplies and DAQ.
Figure 4 shows the actual physical box (without the copper plate) with the pinhead connectors in blue and the BNC union on the temperature probe port, in red. One side of the T-union is for the power supply, while the other side goes to the DAQ's voltage readout.
The copper plate setup is placed in the box, while the sensors and heater are connected to the pinhead connectors. The copper plate is expected to provide a uniform temperature environment
to the test sample. The copper plate was heated using the Kapton flexible heater and the sample is connected to the resistance port (and if 4-wire resistance is required, is also connected to the current supply port).
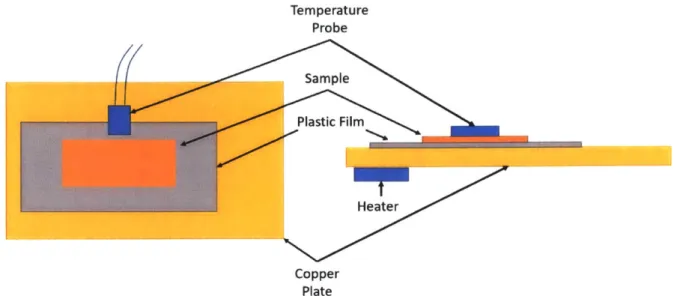
3.2 Copper plate setup U a) Top view Temperature Probe SampUe P astic FRlm Heater Copper Plate a) Side view
Figure 5. Setup of the copper plate assembly. The heater is on the bottom of the plate and the temperature probe is set on the surface of the testing area, near the sample. The plastic film is placed between the sample and the copper plate to prevent shorting.
Figure 5 shows the general configuration of the copper plate assembly. The heater is placed on the bottom of the copper plate, while the temperature probe is placed flush to the surface of the copper plate (or sample). The thin layer of plastic (-0.03 mm) is placed between the sample and the copper plate to prevent any electrical shorting. The plastic layer is pasted onto the copper plate using a thermal grease. Due to the thinness of the plastic layer, the thermal mass of the plastic is negligible and will not affect the heating of the sample. The sample is placed on the plastic layer aided by thermal grease. In addition, the temperature probe is placed close to, or on, the sample using thermal grease.
3.2.1 Copper-alloy wire setup
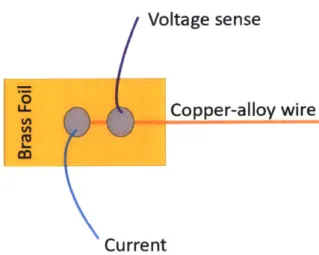
The copper-alloy wire tested was a thin, enameled wire with a diameter of 0.025 millimeters. The thinness of the wire made it difficult to connect to the pinhead connectors used in the box setup, so the wire was soldered to a piece of brass foil on either side, which connected the small wire to larger wires for interfacing with the pinhead connectors. To get a good electrical connection with the brass foil, the enamel was stripped from the ends of the wire. The ends had one solder joint for the current supply to the wire and another for the voltage sense for the resistance readout. The wire was 3.14 meters long in order to have a significant resistance and to help mitigate effects of connection resistances at the solder joints (~1.5 ohms from each connection). The wire was placed on the copper plate using thermal grease. Since the wire was 3.14 meters long and the copper plate was only 15.2 centimeters at its longest dimension, the wire had to be laid back and forth across the plate. As mentioned before, the wire was enameled (except for at the ends), so there was no risk of self-shorting when overlapping. Figure 6 shows the electrical connections to the ends of the wire and Figure 7 shows the described copper plate setup.
L.
Voltage sense
Copper-alloy wire
Current
Figure 6. Setup of the copper alloy-wire connections. The wire had a 0.025-millimeter diameter which made it difficult to connect directly to the pinhead connectors of the box, therefore it was soldered to a piece of brass foil which connected the sample to larger wires for connecting to the pinhead connectors. The current line goes to the current BNC port and the voltage sense goes to the resistance readout port.
Temperature
Probe
Cp Plastic film
Plate Copper-alloy wire
Figure 7. Copper plate setup for the copper-alloy wire. The general copper plate setup did not change from Figure 5, but it should be noted that this particular sample had to be laid back and forth over the plate in order to fit on the copper plate.
The voltage sense wires (in purple) were connected to the resistance readout BNC port, and the power supply wires (in blue) were connected to the current BNC port. A four-wire resistance measurement was used to mitigate the effects of the contact resistances. The copper-alloy wire tested had a room temperature resistance of 110 ohms.
3.2.2 Carbon film resistor setup
The carbon film resistor used for testing was a Yageo CFR-25 series, with a listed resistance of 390 ohms. The resistor was able to use the same setup as in Figure 5, with a plastic layer between the carbon film resistor and the copper plate. The resistor was placed on the plate using thermal grease. The temperature probe was placed close to the resistor using thermal grease and the heater was placed on the underside of the copper plate. Unlike the copper-alloy wire setup, the carbon film resistor used a 2-wire resistance measurement because its higher resistance made the connection resistances negligible. The resistor was able to be directly connected to the pinhead connectors of the resistance readout BNC port.
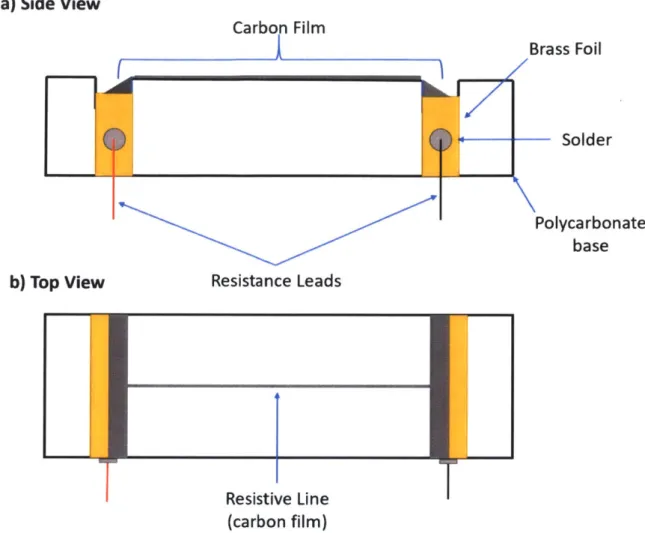
3.2.3 Carbon film line setup a) Side View Carbon Film Brass Foil Solder Polycarbonate base b) Top View Resistance Leads
Resistive Line (carbon film)
Figure 8. Electrical connection setup for the carbon film line. The carbon film was "painted" over an 80 ptm slit in a polycarbonate block made with a razor blade. The excess is pushed into the channels of the polycarbonate block where the pieces of brass foil are placed. The resistance readout leads are connected to the brass foil.
Figure 8 shows the electrical connection setup for the carbon film line. The carbon paste used to make the carbon film line was PELCO* High Temperature Carbon Paste. A block of polycarbonate had an 80 pim slit cut into the surface by a razor blade, upon which the carbon paste was "painted" into and cured until turning into a carbon film. The excess carbon paste was pushed into channels that had been filed near the ends of the block. In each channel was a piece of brass foil connected to wires with solder. This method was used to improve the electrical connections. The resistance measurement in this case used a 2-wire method because the resistance at room temperature of the carbon film was 1,331 ohms, making the contact resistances (1.5 ohms) negligible.
In the measurement process, significant temperature differences across the polycarbonate block. To mitigate this temperature effect and to ensure the resistive line is at the copper plate temperature, the block was mounted as shown in Figure 9. A thin plastic film electrically insulates the resistive line from the copper plate while maintaining good thermal contact between the resistive line and the copper plate. Figure 9 does not show the temperature probe or heater; the temperature probe is mounted near the polycarbonate block on the copper plate and the heater was placed on the underside of the copper plate (see Figure 5 for reference).
Plastic film
I
. .
I-I
Copper Plate
Figure 9. Setup of the polycarbonate-carbon-film block on the copper plate. The block was inverted so that the resistive line could be in good thermal contact with the copper plate. The plastic film prevented the carbon film line and copper plate from electrically shorting. The temperature probe and heater are not shown. The temperature probe is mounted near the polycarbonate block on the copper plate and the heater was placed on the underside of the copper plate (see Figure 5 for reference).
3.3 Electrical measurement setup Copper Plate Computer DAQ Component Legnd
Current Supply Resistive Material Heater
Voltage Sense Temperature Probe
Figure 10. Setup of the electrical measurement system (box setup not pictured). The sample resistive material, temperature probe and heater are all on the copper plate. The voltage sense of both the temperature probe and sample are connected to the DAQ. If using a 4-wire measurement for the resistance, the power supply is also connected to the DAQ (blue lines). The temperature probe is supplied with current separately. The heater is powered using another power supply. The DAQ is connected to a computer to collect the resistance data from the sample and the voltage data from the temperature probe.
Figure 10 shows the setup of the electrical circuit to run the experiments to get the temperature coefficient of resistance (box setup not pictured). The temperature probe is powered using a LakeShore 120 Current Source at 10 pA. The resistance readout from the sample resistive material and the voltage sense from the temperature probe were collected by a Measurement Computing USB-2404-UI DAQ (connection setups to the DAQ are in the Appendix). The blue line shows the added current supply line that would connect to the DAQ for a 4-wire resistance measurement. The DAQ is connected to a computer using the required softwares InstaCal and TracerDAQ to collect the data (procedure for setting up InstaCal and TracerDAQ is in the Appendix). The heater is mounted on the bottom of the copper plate and is powered using a Hewlett-Packard E363 1A power supply with a constant voltage of 10 V.
3.4 Data Analysis Techniques
After the data is collected using TracerDAQ, the saved CSV file is then imported using MATLAB to read the temperature and resistance data over the testing period. The voltage readout from the temperature probe is converted to temperature using a calibration relation provided by
LakeShore Cryotronics (4)
T = -442.95V + 532.73,
where T is in Kelvin and V is in volts [7]. The resistance is then plotted against the temperature and using the MATLAB fito function, a linear fit is modeled for the resistance versus temperature graph. Using the recorded initial resistance at room temperature and Equation 2, where AR/AT is the slope from the fit, the TCR can be found for the material.
For known materials, the calculated TCR can be compared with the published TCR values. This will allow the analysis to be tuned and make sure that the temperature coefficient of resistances of unknown materials are within a reasonable uncertainty.
4. Results and Discussion
The following data is taken from three resistive materials: a copper-alloy wire, a carbon film resistor, and a carbon film line. The copper-alloy wire and carbon film resistor were used to test the setup and make sure the measurement method was accurate enough to test unknown materials, such as the carbon film line.
4.1 Copper-alloy wire results
Figure 11 shows the collected resistance versus temperature data from the copper-alloy wire. The data showed a very clear linear trend, with a A of 0.3974 1.9x10⁻⁵ /K. Using
AiT
Equation 2, with the known Rref of 110 ohms, resulted in a temperature coefficient of resistance of 0.0036 1/K. This is very close to the tabulated value for pure copper, 0.0039 1/K [8]. This gives an error of 7.7%; however, since the copper-alloy wire is not pure copper, this calculated value
seemed reasonable.
124
122
120
E
118
116
114
112
110
I290
300
310
320
Temperature [K]
330
340
Figure 11. Results from the copper-alloy wire test. The copper plate and wire were allowed to
AR
come up to temperature over multiple hours. The slope of the line, -, was found to be 0.3974 1.9x10⁵ O/K. This resulted in a calculated 0 of 0.0036 1/K.
20
4.2 Carbon film resistor results
388.8
388.6
-388.4
.-.
388.2
u388
WW387.8
387.6
387.4
slope = -0.05264 +/- 4.4e-05 [QIK]387.2-387
300
310
320
330
Temperature [K]
Figure 12. Results from the carbon film resistor test. The resistance versus temperature of the carbon film resistor shows a slope, , of -0.05264 4.4x10⁻⁵ O/K. This resulted in a calculated
p
of -0.00014 1/K.
Figure 12 shows the resistance data versus temperature for the Yageo carbon film resistor. The calculated was -0.05264 4.4x10⁻⁵ 92/K. Using Equation 2, with a Rref of 390 ohms, the
LAT
temperature coefficient of resistance was calculated to be, -0.000 14 1/K. This value fell within the listed range of temperature coefficients of resistance for the Yageo CFR-25 (-0.000350-0.000500 1/K) [9].
4.3 Carbon film line results
After confirming the experimental setup and data analysis methods with the tests on the copper-alloy wire and the carbon film resistor, the carbon film line was tested. Since PELCO* does not provide any information about the carbon film's temperature-resistance relationship, the only expectation for the film line was that it should have a negative coefficient of resistance, since carbon should have a semiconductor-like behavior.
a C) U) U)
1480
1460
1440
1420
1400
1380
1360
1340
1320
1300'-290
300
310
320
330
340
Temperature [K]
Figure 13. Results from the carbon film line test. The first test showed a resistance versus temperature curve with three different regimes with a reference resistance of 1,331 ohms. The second test's resistance-temperature curve is completely different characteristically when compared to the first test. In addition, the reference resistance is now 1,400 ohms, whereas before it was 1,331 ohms. Ultimately, this showed that the process was not repeatable.
22
--
Test
1
- -Test
21
-
0000,0000
I
-.-0
Figure 13 shows the data from the carbon film setup tests. The data from the two tests are completely different. The measurements of the film are clearly not repeatable and suggest that there are physical changes in the film as it is thermally cycled.
Previously, a different sample of polycarbonate with a 1.3 cm carbon film line had been thermally cycled to a much higher temperature (373 K), after which cracking could be observed by eye. Cracking could not be observed by eye on the 80 pm sample tested in Figure 13, but microcracking of the carbon film line is a possible reason for these changes.
The thermal expansion coefficients of polycarbonate and carbon are substantially different
(65-70 pim/m-K and 4-8 pm/m-K, respectively) [10]. As the sample is heated the polycarbonate
expands approximately 10 times faster than the carbon film, probably cracking the brittle carbon film and irreversibly altering the resistance of the carbon film.
The PELCO® High Temperature Carbon Paste was determined to be not suitable as a temperature probe for polycarbonate. It is recommended that the physical properties of the resistive material should be checked as a prerequisite for consideration as a temperature probe for polycarbonate. Further research can be conducted on more resistive materials, particularly semiconductors, in order to find an appropriate temperature probe for the final applications of this project. In addition, the testing apparatus should be adapted to test the temperature coefficient of resistance at cryogenic states.
5. Conclusions
This work proved calculating temperature coefficients of resistance by heating metals and premade resistors to be effective. The copper-alloy wire test resulted in a temperature coefficient of resistance of 0.0036 1/K, which is very close to the published temperature coefficient of resistance value for pure copper of 0.0039 1/K, with an error of 7.7% [8]. However, since the purity of the copper-alloy wire was not known, the error calculated was deemed insignificant. The Yageo CFR-25 series resistor had a calculated
P
value of -0.00014 1/K, which fell in the range of the listed temperature coefficient of resistance values from the manufacturer (-0.000350-0.0005001/K) [9].
However, when it came to testing the PELCO* High Temperature Carbon Paste applied on a polycarbonate block, the heating test proved incapable. The carbon film line was unable to be tested multiple times and was clearly subject to physical changes after being thermally cycled. In hindsight, the lack of repeatability of the carbon film line should have been expected given the large differences in the thermal coefficients of expansion of the polycarbonate substrate and the carbon in the film line (65-70 pm/m-K and 4-8 gm/m-K, respectively) [10].
This work proved that the prospective temperature probe made from the PELCO® High Temperature Carbon Paste cannot be used for the 3o tests on polycarbonate. Currently, carbon filament-based heaters are now under consideration.
Further work will be conducted to modify the test apparatus to be able to test at cryogenic temperatures.
6. Appendices
Appendix A: Procedure for Measurement Taking 1. Connect USB-2404-UI to PC and run InstaCal program
a. Select USB-2404-UI board in pop-up window OR press ADD BOARD and select manually
b. Double click USB-2404-UI line under PC Board List
c. Go to channel port used for resistance readout, change readout to +/-10.5 kOhm d. Go to channel port for voltage readout
e. Change ADC Time Mode option to High Resolution f. Press OK
2. Run TracerDAQ program then Run Strip Chart
a. Go to EDIT and select DAQ Hardware Settings
b. Select CHO as resistance readout channel and select ohms on last dropdown c. Select CHI as voltage readout (from temperature probe), make units +/- IV in
last dropdown d. Press OK
e. Go to EDIT and select Channel Settings
f. Make 2 channels, CHO in Lane 1 and CHI to Lane 2 g. Press OK
h. Go to EDIT and select Scan Rate/Trigger Settings
i. Change to desired test duration (suggest 1+ hours) and put sample rate to desired rate
j.
Press OKk. Press START button
3. Record resistance readout at room temperature, then STOP recording 4. Close Box with additional insulation over copper plate setup
5. Turn E3 631 A power supply to 1 OV
6. Press START again on TracerDAQ
7. Once data collection has stopped, go to FILE, SAVE AS, and save file as a CSV file (make sure to leave E363 1A power supply on)
Appendix B: Measurement Computation USB-2404-UI Resistance and Voltage Connections
4-Wire Resistance
Setup
1
2
3
4
5
6
2-Wire Resistance
Setup
1
2
3
4
5
6
Voltage Readout
1
2
3
Ch-4
5
6
Here are the USB-2404-UI DAQ channel setups for resistance readouts and voltage readout. In the 4-wire resistance measurement, the Ex+ and Ex- should come from the current BNC lead, and the Ch+ and Ch- should come from the resistance BNC. For the 2-wire resistance measurement, the Ex+ and Ex- come from the resistance BNC port. The Ch+ and Ch- for the voltage readout come from the temperature probe BNC lead.
7. References
[1] "Temperature Coefficient of Resistance," from http://www.resistorguide.com/temperature-coefficient-of-resistance/
[2] Dalton, Matthew, 2014, "The 3 omega transient line method for thermal characterization of superinsulator materials developed for spacecraft thermal control," hal-01 113225, International Astronautical Federation, Toronto, Canada.
[3] de Koninck, David, 2008, "Thermal Conductivity Measurements Using the 3-Omega Technique: Application to Power Harvesting Microsystems," M.S. thesis, Department of Mechanical Engineering, McGill University.
[4] Cahill, D., and Pohl, R.O., "Thermal conductivity or amorphous solids above the plateau," 1987, Physical Review 8, Vol. 35, NUMBER 8.
[5] "Cryogenics," Encyclopaedia Britannica, from https://www.britannica.com/science/ cryogenics
[6] Duthil, P., "Material Properties at Low Temperature," IN2P3-CNRS, Institut de Physique Nucleaire, from https://arxiv.org/ftp/arxiv/papers/1501/1501.071 00.pdf.
[7] "DT-470 Series Silicone Diodes," LakeShore Cryotronics, https://www.lakeshore.com/products/categories/overview/discontinued-products/discontinued-products/dt-470-series-silicon-diodes
[8] "Resistor Temperature Dependence," HyperPhysics, Electricity and Magnetism, http://hyperphysics.phy-astr.gsu.edu/hbase/electric/restmp.html. Accessed: 21 April 2019
[9] "Carbon Film Resistors," Yageo, http://www.yageo.com/NewPortal/ yageodocoutput?fileName=/pdf/throughhole/YageoLRCFR_2013.pdf
[10] "Coefficients of Linear Thermal Expansion," Engineering Toolbox, https://www.engineeringtoolbox.com/linear-expansion-coefficients-d_95.html. Accessed: 21 April 2019