HAL Id: inserm-00132848
https://www.hal.inserm.fr/inserm-00132848
Submitted on 22 Feb 2007
HAL is a multi-disciplinary open access
archive for the deposit and dissemination of
sci-entific research documents, whether they are
pub-lished or not. The documents may come from
teaching and research institutions in France or
abroad, or from public or private research centers.
L’archive ouverte pluridisciplinaire HAL, est
destinée au dépôt et à la diffusion de documents
scientifiques de niveau recherche, publiés ou non,
émanant des établissements d’enseignement et de
recherche français ou étrangers, des laboratoires
publics ou privés.
Contrasting effects of basic fibroblast growth factor and
neurotrophin 3 on cell cycle kinetics of mouse cortical
stem cells.
Agnès Lukaszewicz, Pierre Savatier, Véronique Cortay, Henry Kennedy,
Colette Dehay
To cite this version:
Agnès Lukaszewicz, Pierre Savatier, Véronique Cortay, Henry Kennedy, Colette Dehay. Contrasting
effects of basic fibroblast growth factor and neurotrophin 3 on cell cycle kinetics of mouse cortical
stem cells.: bFGF and NT3 cell cycle control in cortigenesis. Journal of Neuroscience, Society for
Neuroscience, 2002, 22, pp.6610-22. �inserm-00132848�
Contrasting Effects of Basic Fibroblast Growth Factor and Neurotrophin 3 on
Cell Cycle Kinetics of Mouse Cortical Stem Cells
Agnès Lukaszewicz1, Pierre Savatier2, Véronique Cortay1, Henry Kennedy1, and Colette Dehay1 1 Institut National de la Santé et de la Recherche Médicale U371, Cerveau et Vision, 69675 Bron, France, and 2 Laboratoire de Biologie Moléculaire et Cellulaire, Unité Mixte de Recherche 5665, Ecole Normale Supérieure de Lyon, 69364 Lyon, France
ABSTRACT
Basic fibroblast growth factor (bFGF) exerts a mitogenic effect on cortical neuroblasts, whereas neurotrophin 3 (NT3) promotes differentiation in these cells. Here we provide evidence that both the mitogenic effect of bFGF and the differentiation-promoting effect of NT3 are linked with modifications of cell cycle kinetics in mouse cortical precursor cells. We adapted an in vitro assay, which makes it possible to evaluate (1) the speed of progression of the cortical precursors through the cell cycle, (2) the duration of individual phases of the cell cycle, (3) the proportion of proliferative versus differentiative divisions, and (4) the influence on neuroglial differentiation. Contrary to what has been claimed previously, bFGF promotes proliferation via a change in cell cycle kinetics by simultaneously decreasing G1 duration and increasing the proportion of proliferative divisions. In contrast, NT3 lengthens G1 and promotes differentiative divisions. We investigated the molecular foundations of these effects and show that bFGF downregulates p27kip1 and upregulates cyclin D2 expression. This contrasts with NT3, which upregulates p27kip1 and downregulates cyclin D2 expression. Neither bFGF nor NT3 influences the proportion of glia or neurons in short to medium term cultures. The data point to links between the length of the G1 phase and the type of division of cortical precursors: differentiative divisions are correlated with long G1 durations, whereas proliferative divisions correlate with short G1 durations. The present results suggest that concerted mechanisms control the progressive increase in the cell cycle duration and proportion of differentiative divisions that is observed as corticogenesis proceeds.
Key words: G1 phase; cell cycle; proliferation; neuroblast; time-lapse videomicroscopy; bFGF; NT3; corticogenesis
INTRODUCTION
Cortical stem cells from the ventricular zone are responsible for generating the diversity of many of the neuronal and glial cells found throughout the cerebral cortex. Cortical precursors undergo basically two types of divisions: (1) proliferative divisions giving rise to two precursors, which continue their progression in the cell cycle; and (2) differentiative divisions, in which one or both daughter cells leave the cell cycle and undergo differentiation. Cortical neurogenesis occurs according to a precise spatiotemporal schedule with early precursors giving rise to infragranular layer neurons and late precursors producing supragranular neurons. In this way, the timing of the exit of a neuron from the cell cycle is closely related to its final identity (Caviness et al., 1995; Polleux et al., 2001). It has also been shown that the laminar fate of cortical precursors is acquired during the final, differentiative round of mitosis (McConnell and Kaznowski, 1991; Polleux et al., 2001).
Two factors contribute to determining the generation of the appropriate number of neurons of a particular phenotype (Rakic, 1995): first, the control of the balance between proliferative and differentiative divisions; and second, the duration of the cell cycle. There is a progressive increase in the proportion of differentiative divisions and a slowing down of the cell cycle during corticogenesis (Caviness et al., 1995). Regional control of these two factors contributes to determining the areal variation of the neuron number (Polleux et al., 1997). This would suggest that factors controlling corticogenesis will do so via a concerted influence on both the mode of division and the duration of the cell cycle. Here, we examine how cell cycle parameters are influenced by two extracellular factors: basic fibroblast growth factor (bFGF) and neurotrophin 3 (NT3), respectively known to promote proliferation and differentiation of neuroblasts (Murphy et al., 1990; Averbuch-Heller et al., 1994; Ghosh and Greenberg, 1995, Vicario-Abejon et al., 1995; Cavanagh et al., 1997; Tao et al., 1997).
HAL author manuscript inserm-00132848, version 1
HAL author manuscript
During development, both molecules are appropriately expressed to participate in corticogenesis control. bFGF is widely expressed in the embryonic rodent brain (Nurcombe et al., 1993; Baird, 1994;Vaccarino et al., 1999), and the mRNA and protein levels increase significantly between embryonic day 14 (E14) and E18 before declining to low levels postnatally (Powell et al., 1991; Giordano et al., 1992; Weise et al., 1993). FGF receptors (FGFRs) are expressed by cortical neuroblasts (Yamaguchi et al., 1992; Orr-Urtreger et al., 1993; Peters et al., 1993; Vaccarino et al., 1999). The IIIc isoforms of high-affinity FGFR 1-3 are expressed by cortical cells between E10 and E14 (Qian et al., 1997). NT3 is expressed in the embryonic cortex (Maisonpierre et al., 1990), and its high-affinity receptor TrkC is present in the precursors of the ventricular zone (Tessarollo et al., 1993; Allendoerfer et al., 1994; Lamballe et al., 1994; Ghosh and Greenberg, 1995; Fukumitsu et al., 1998). Here, using an in vitro assay, we show that bFGF and NT3 have opposite influences on (1) the molecular regulation the cell cycle, (2) cell cycle kinetics via control of progression in G1, and (3) the mode of division of cortical precursors. Neither bFGF nor NT3 influence neuroglial differentiation significantly after 5 d in vitro.
MATERIALS AND METHODS
Dissection procedure
Embryos were removed by cesarean section from timed pregnant mice (OF1 strain; IFFA Credo, Arbresle, France). The plug date was considered E1. Fetal brains were removed under sterile conditions in iced HBSS containing 10 mM HEPES. The cerebral hemispheres were detached by a medial longitudinal section. The neopallium including the ventricular zone, the intermediate zone, and the cortical plate was isolated.
Cortical precursor cultures
Cortical cells underwent enzymatic dissociation (trypsin-EDTA 0.25%, 1:100, 3 min at 37°C). Trypsin activity was stopped by washing in Glasgow modified essential medium (GMEM; Biomedia) supplemented with 10% fetal calf serum (FCS). Cells then underwent a mechanical dissociation (up and down aspiration through a P1000 pipette) and were centrifuged for 5 min at 4°C and resuspended in GMEM and 10% FCS. Viability was estimated by means of a trypan blue exclusion assay (0.2% trypan blue was incubated for 2 min), and cells were counted under a hemocytometer. Cells were seeded at a density of 4 105 cells per 14-mm-diameter poly-L-lysine-laminin-coated glass coverslip. Cells were cultured in 500 µl of GMEM and 10% FCS. The medium was renewed every 4 d. Cells attached within 3 hr of plating. Cultures were treated with growth factors (25 or 50 ng/ml) 5-12 hr after plating. The proliferation rates were assayed after 2 or 3 d in vitro (DIV).
Cell viability: trypan blue exclusion assay
The proportion of dying cells was quantified in all experiments, for each experimental condition on sister cultures by incubating the cells with 0.2% trypan blue for 20 min. After a thorough wash, cultures were fixed with 2% paraformaldehyde. The cultures were regularly scanned with a 25 objective, and the proportion of blue cells with respect to the total number of cells was computed. After Hoechst staining, apoptotic cells can be easily visualized, because they show condensed chromatin (Wyllie et al., 1980). Such cells were very rare. Rates of cell death at 2 DIV varied from ~4 to 10% in E14-E16 control cultures. Addition of NT3 or bFGF (25-50 ng/ml) in the cultures led to a nonsignificant reduction of rates of cell death, which was of the same order in both instances.
Bromodeoxyuridine incorporation protocol
Bromodeoxyuridine (BrdU; 20 µg/ml) was added to the medium for 2-3 hr. The cultures were then washed with phosphate buffer and fixed with 70% ethanol at -20°C.
Cumulative labeling. BrdU (20 µg/ml) was added to the medium, which was partially renewed every 10 hr when long exposure periods were required. Each time point was repeated on three to four sister coverslips. Cultures were washed with phosphate buffer before being fixed with 70% ethanol at -20°C. Percentages of labeled mitotic figures. BrdU (20 µg/ml) was added to the medium for 1 hr. Cultures were rinsed twice before adding new medium. Two repeats were done at each time point. After appropriate survival periods, cultures were fixed with 70% ethanol at -20°C. Immunocytochemistry to reveal BrdU was performed as below using DAB as a chromogen. Cells were finally counterstained with Hoechst to allow the identification of mitotic figures.
Proliferating cell nuclear antigen-BrdU double immunostaining
Cultures were first incubated for 20 min in Tris-buffered saline (TBS) and 0.6% H2O2, followed by a 20 min incubation in normal goat serum (1:5). Proliferating cell nuclear antigen (PCNA) was revealed according to the following three-step procedure: mouse anti-PCNA (DAKO-PC10; Dako, Glostrup, Denmark; 1:75 in TBS) for 30 min at room temperature, biotinylated goat anti-mouse antibody (Dako; 1:400 in TBS) for 30 min at room temperature, and peroxidase-conjugated streptavidin (Dako; 1:500 in TBS). Peroxidase activity was revealed by incubating the cultures in DAB (Sigma, St. Louis, MO; 1 mg/ml in 0.05 M Tris) for 5 min and then adding 3% H2O2 for 10 min. DNA denaturation was subsequently performed by 2N HCl for 30 min at 37°C, followed by two rinses (15 min each) in borate buffer, pH 8.5. Mouse anti-BrdU (BU33; Sigma; 1:400) was incubated overnight at 4°C. Labeling was revealed by a last incubation of FITC rabbit mouse antibody (Dako; 1:100) or Cy2 rabbit anti-mouse antibody (Jackson ImmunoResearch, West Grove, PA; 1:400). Cell nuclei were counterstained with Hoechst.
Cell cycle kinetics
Cell density determination. Cultures were scanned at regular intervals, and densities were estimated by computing the total number of cells per unit area. Statistical significance between control and experimental values was assessed with a Mann-Whitney U test.
Identification of the precursor pool. Precursor cells were identified by means of PCNA labeling (Dehay et al., 2001). PCNA is an auxiliary protein of delta -DNA polymerase, which is present during all phases of the cell cycle (Bravo et al., 1981). The estimation of the growth fraction (GF; i.e., the fraction of cycling cells) was determined by computing the proportion of PCNA-positive cells with respect to the total number of cells.
Labeling index determination. Cells in S phase at the time of the pulse were BrdU-positive. The labeling index (LI) was determined as the proportion of BrdU-positive cells (cells that were in S phase during the BrdU exposure) with respect to the precursor pool, i.e., the PCNA-positive cells.
S phase and G1 + G2/M phase lengths were derived from eight different cumulative BrdU experiments (Nowakowski et al., 1989) (Table 1).
G2/M duration was determined on an E15 culture using the percentage of labeled mitoses (PLM) method (Shackney, 1974). BrdU was used as an S phase marker. Forty-eight hours after neurotrophins were added to the medium, a 1 hr BrdU exposure was given to control and bFGF- or NT3-treated sister cultures. The cultures were carefully rinsed, and fresh medium was added. Cultures were then fixed at hourly intervals (1-8 hr). After immunohistochemical labeling of BrdU-positive cells, the PLM was computed for each time point. This procedure measures the time required for cells in S phase cells to enter M phase and therefore returns the G2/M duration (Shackney, 1974; Cavanagh et al., 1997). All comparisons of the different populations of cells have been made between control and neurotrophin-treated cultures prepared from the same pool of cells.
For the PLM experiments (Quastler and Sherman, 1959), statistical significance was tested by means of an F test applied to the ascending slope of the curve. For BrdU cumulative labeling, the statistical differences between slopes were tested by means of an F test combined with bootstrap analysis (implemented with Matlab software; The MathWorks, Inc., Natick, MA) that it makes possible to determine whether the intersection of the two slopes is on the x-axis.
Immunoprecipitation
After bFGF (25 ng/ml) or NT3 (25 ng/ml) exposure for 1-3 DIV, cells were scraped off the dish in ice-cold PBS, pelleted, and frozen in liquid nitrogen until use. All the subsequent steps were performed at 4°C. Approximately 5 106 cells were lysed for 30 min in 1 ml of lysis buffer (50 mM Tris-HCl, pH 7.4, 150 mM NaCl, 0.5% Nonidet P-40, 50 mM NaF, 1 mM sodium orthovanadate, 4 mM phenylmethylsulfonyl fluoride, 25 mg/ml leupeptin, 25 mg/ml aprotinin, 10 mg/ml trypsin inhibitor, 1 mM benzamidine, and 1 mM dithiothreitol). Cellular debris were removed by centrifugation (10,000 g for 15 min). Protein content was quantified by the Coomassie blue protein assay, and 250 µg of protein lysate was used for immunoprecipitation of proteins of interest (Cyclin D2 and p27kip1). Cell lysates were used either directly for analyzing expression of cyclin-dependent kinase 2 (CDK2), CDK4, and cyclin A by immunoblotting, or the proteins of interest (cyclin D2 and p27kip1) were first
immunoprecipitated from the lysates using specific rabbit polyclonal antibodies bound to protein A-Sepharose. Polyclonal anti-cyclin D2 (M-20) and anti-p27kip1 (M-197) were purchased from Santa Cruz Biotechnology (Santa Cruz, CA). Three milligrams of purified antibody coupled to 25 µl of protein A-Sepharose were used for each milliliter of cell lysates. After incubating protein A-Sepharose-coupled antibodies with the cell lysates, immune complexes were collected before being analyzed by SDS-PAGE and immunoblotting.
Table 1. Durations of TS, TG1+G2/M, TC, and TG1 in different experimental conditions
Duration (hr) Age Duration type Experiment Control bFGF NT3
a 6.4 6.5 (+1.6) 7.0 (+9.4) TS b 9.8 10.0 (+2.0) a 23.0 16.3 (-29) 27.8 (+21) TG1+G2/M b 17.8 24.4 (+36) a 29.4 22.8 (***) 34.8 (*) TC b 27.6 34.4 (**) a 20.0 13.3 (-34) 24.8 (+24) E14 (n = 2) TG1 b 14.8 21.4 (+45) c 5.8 5.6 (-3.4) d 6.4 5.7 (-10.9) e 5.6 6.1 (+8.2) TS f 6.2 6.2 (0) c 23.5 16.0 (-32) d 18.0 11.0 (-39) e 22.8 15.1 (-34) TG1+G2/M f 19.3 23.0 (+36) c 29.3 21.6 (*) d 24.4 16.7 (***) e 28.4 21.2 (***) TC f 25.5 29.2 (*) c 20.5 13.0 (-37) d 15.0 8.0 (-47) e 19.8 12.1 (-39) E15 (n = 4) TG1 f 16.3 20.0 (+23) g 6.5 6.0 (-7.7) TS h 5.6 6.1 (+8.9) 5.7 (+1.8) g 23.5 16.0 (-32) TG1+G2/M h 22.1 16.1 (-27) 25.5 (+15) g 30.0 22.0 (*) TC h 27.7 22.2 (***) 31.2 (NS) g 20.5 13.0 (-37) E16 (n = 2) TG1 h 19.1 13.1 (-31) 22.5 (+18)
The TS, TC and TG1+G2/M values in hours are derived from BrdU cumulative labeling experiments. E14, Two experiments (a and b); E15, four experiments (c-f); E16, two experiments (g and h). G1 duration has been obtained by subtracting TG2/M values returned by the PLM technique (see Fig. 4D) from TG1+G2/M values. Numbers in parentheses refer to the percentage of variation with respect to the control values. Statistical significance has been calculated for TC values by means of an F test, combined with bootstrap analysis (implemented with MATLAB software). NS, Not significant; ***p < 0.0005; **p < 0.005; *p < 0.05.
Immunoblotting
Protein lysates were prepared exactly as described in Immunoprecipitation. 5 micrograms of protein lysates were loaded for each sample. Samples were analyzed on 10-12% SDS-polyacrylamide gels, followed by immunoblotting on nitrocellulose membranes in 12.5 mM Tris-HCl, 100 mM glycine, 0.05% SDS, and 20% methanol. Membranes were blocked in 20 mM Tris-HCl, pH 7.6, 137 mM NaCl, 0.1% Tween 20, and 5% dry milk for 1 hr to overnight. Membranes were then incubated with the first antibody (diluted at 2 µg/ml in 20 mM Tris-HCl, pH 7.6, 137 mM NaCl, 0.1% Tween 20, and 2% dry milk) for 1 hr, washed three times for 10 min each in 20 mM Tris-HCl, pH 7.6, 137 mM NaCl, and 0.1% Tween 20, and incubated 1 hr with HRP-conjugated second antibody (Amersham Biosciences, Arlington Heights, IL) diluted 1:10,000. HRP activity was revealed with the ECL detection kit (Amersham Biosciences). All incubations with antibodies were performed using Biocomp Navigator (Serlabo). Primary antibodies were as follows: rabbit polyclonal anti-CDK2 (M2), anti-CDK4 (C-22), and anti-cyclin A (H-432) were purchased from Santa Cruz Biotechnology; and mouse monoclonal
anti-cyclin D2 (14821A) and anti-p27kip1 (13231A) were purchased from PharMingen (San Diego, CA).
Cyclin D2 and p27 immunochemistry
After PCNA (see above) or MAP2 (see below) immunochemistry, cultures were rinsed three times in TBS and then incubated for 20 min in normal goat serum and rinsed three times before proceeding to primary antibody incubation as follows: rabbit anti-p27 (1:20 in Dako diluent) from Santa Cruz Biotechnology 528) or rabbit anti-D2 (1:20 in Dako diluent) from Santa Cruz Biotechnology (SC-593). Incubation was at room temperature for 1 hr. After three rinses, goat anti-rabbit Cy2 (1:200 in Dako diluent; Jackson ImmunoResearch) or goat anti-rabbit Cy3 (1:200 in Dako diluent; Jackson ImmunoResearch) was incubated for 1 hr at RT. After three rinses, cultures were counterstained with Hoechst (1 µg/ml) and mounted with 0.1% n-propylgallate (P3130; Sigma) in 0.1 M phosphate buffer and glycerol (1:1) to prevent fading on fluorescent illumination.
PCNA, GFAP, and MAP2 triple immunohistochemistry
After PCNA immunochemistry (see above), GFAP and MAP2 were revealed according to the following two-step procedure. Cultures were rinsed three times in TBS and 0.5% Triton X-100 and then incubated in a mixture of ethanol (95%) and acetic acid (5%) for 20 min. After three rinses in TBS, coverslips were incubated for 20 min in normal goat serum and rinsed three times before proceeding to primary antibody incubation as follows: rabbit anti-GFAP (1:100 in Dako diluent) from Sigma (G9269) and mouse anti-MAP2 (1:100 in Dako diluent) from Sigma (M4403) were incubated simultaneously overnight at 4°C. After three TBS rinses to reveal GFAP labeling, goat anti-rabbit Cy2 (1:400 in Dako diluent; Jackson ImmunoResearch) was incubated for 1 hr at room temperature. After three rinses, coverslips were further incubated with goat anti-rabbit Cy3 (1:400 in Dako diluent; Jackson ImmunoResearch) for 1 hr at room temperature to reveal MAP2 labeling. Coverslips were counterstained with Hoechst (1 µg/ml).
Microscopic observations and confocal analysis of the fluorescent labeling
Cultures were examined using an oil objective (25 or 63 ) under UV light to detect FITC and Cy2 (L5 filter), Cy3 (N2.1 filter), and Hoechst (A filter) on a Leica (Nussloch, Germany) DMRB fluorescence microscope. PCNA labeling revealed by DAB staining was observed under white illumination. The cultures were scanned at regular spacing with a grid corresponding to a field of 0,46 mm2. One hundred fields were observed per coverslip.
Confocal analysis of p27 and cyclin D2 expression was performed with a Leica confocal system (TCS SP) using a 63 oil objective. Quantitative analysis of Cy2 and Cy3 fluorescence in PCNA-positive or MAP2-negative cells nuclei was performed using Leica software (TCS NT). Levels of fluorescent intensity were measured individually for each cell, and three categories of labeling intensity were defined: 20-65 (low-intensity labeling), 65-110 (intermediate-intensity labeling), and >110 (high-intensity labeling).
Time-lapse videomicroscopy recording of cell division
Cortical precursors from green fluorescent protein (GFP; Okabe et al., 1997) +/- and -/- mice were seeded on poly-L-lysine- and laminin-coated glass coverslips to obtain 25% of GFP+ cells. This low proportion of GFP+ cells makes it possible to reliably monitor the behavior of individual fluorescent cells. Glass coverslips were placed in a 35 mm glass-bottom Petri dish (MatTeck Corp.) in GMEM supplemented with 10% FCS or in neurobasal medium supplemented with B27 (Invitrogen, San Diego, CA). Cultures were incubated at 37°C with 7.5% CO2 for 4-5 DIV in a Pecon incubating chamber placed on a Leica DMIRBE inverted microscope stage. Observations of the proliferative behavior of individual green fluorescent precursors were made with a 40 objective under halogen illumination. Using Metamorph software, 20 fields were scanned per coverslip per hour. Subsequent analysis of the movies allowed estimation of (1) the cell cycle length of individual cortical GFP+ cells, corresponding to the duration between two mitoses; and (2) the mode of division assessed by the proliferative behavior of the daughter cells (subsequent division or not).
RESULTS
Influence of bFGF and NT3 on the balance between proliferation and differentiation of cortical precursors.
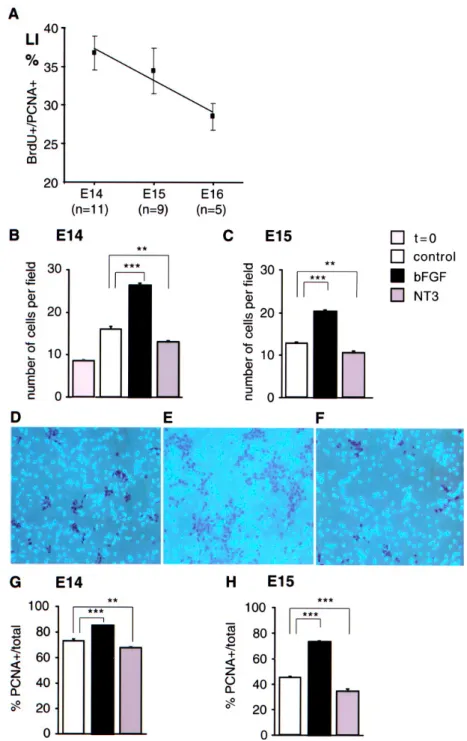
We have used an in vitro system that permits quantification of proliferation and differentiation in cortical precursor cells (Dehay et al., 2001). Dissociated cultures were prepared from the cerebral wall of the mouse on E14-E16 and therefore contained a combined population of cycling progenitors and postmitotic cells. Briefly, cells were plated in GMEM supplemented with 10% FCS to maximize proliferative activity and minimize cell death. Under these conditions, intense proliferation is observed for the first 5 DIV before progressively declining (Dehay et al., 2001). Examination of cell cycle kinetics 24-48 hr after plating in E14-E16 cultures showed a tendency for the cell cycle duration to increase with embryonic age (Fig. 1A), reflecting the slowing down of the cell cycle, which has been reported to occur in vivo (Takahashi et al., 1993, 1995). However, differences in cell cycle duration among E14-E16 progenitors tend to be smoothed out with time in vitro and are no longer detectable after 48 hr. MAP2 and GFAP immunolabeling demonstrates that cortical precursor cells are capable of giving rise to neurons and glia, suggesting that overall the signals regulating the proliferation of cortical precursor cells continue to operate during the first 5 DIV under the present culture conditions (Dehay et al., 2001). Because the cell cycle duration is influenced by factors intrinsic to making the cell culture and that can therefore slightly differ between cultures, we always use sister cultures to compare the different experimental conditions.
Dissociated cortical cells were exposed to NT3 and bFGF (25-50 ng/ml) for 1-3 d. Rates of cell death were examined in control and experimental cultures using a trypan blue assay. We failed to detect any differences in the rates of cell death (<10%), and the values obtained in the different conditions did not differ by >5%. Compared with control cultures, NT3-treated cells show a significantly decreased cell density (CD), whereas bFGF treated cultures are characterized by a large increase in CD (Fig. 1B,C). This suggests that bFGF exerts a mitogenic effect (Cavanagh et al., 1997), and that NT3 downregulates proliferation of cortical precursors.
To reveal the mitogenic influence of bFGF and NT3 on neuroblasts, we investigated the influence of NT3 and bFGF treatment on molecules known to regulate the cell cycle. Dissociated cells were exposed to either NT3 (25 ng/ml) or bFGF (25 ng/ml) for 1-3 d, and the steady-state levels of positive (cyclin A, cyclin D2, CDK2, and CDK4) and negative (p27kip1) regulators of the cell cycle were revealed by Western blotting (Fig. 2). NT3-treated cultures are characterized by a strong increase in the state level of the negative regulator p27kip1 and by a concomitant decrease of the steady-state levels of the positive regulators cdk2, cdk4, and cyclin D. In contrast, bFGF-treated cultures are characterized by an upregulation of the steady-state levels of cdk2, cdk4, and cyclin A, as well as by a strong increase in the steady-state level of cyclin D2. p27kip1 expression appears strongly downregulated in these cultures. We have used the Western blotting analysis to monitor global changes of a range of cell cycle regulatory molecules. These results show that NT3 and bFGF have opposite effects on the steady-state levels of positive and negative regulators of the cell cycle. bFGF-treated cells display increased expression of cell cycle regulators involved in promoting G1/S and G2/M transitions, whereas NT3-treated cultures display reduced expression of the same regulators. However, because these regulatory genes are differentially expressed in mitotic and postmitotic cells (Hu et al., 2001), it is possible that the observed changes in the steady-state levels of cdk2, cdk4, and cyclin A in response to bFGF or NT3 reflect the changes in the proportions of precursor and postmitotic cells in the overall population.
To explore the influence of NT3 and bFGF on the mode of division, it is necessary to monitor changes in the proportions of mitotic cells in the treated cultures. This is possible by determining PCNA expression, which is upregulated during all phases of the cell cycle and is downregulated when cells enter the G0 phase and become postmitotic (Bravo et al., 1981; Bolton et al., 1994; Teague and el-Naggar, 1994; Dehay et al., 2001). PCNA immunostaining allows precise quantification of the GF, which corresponds to the proportion of cycling precursors with respect to the total cell population. Dissociated cultures were fixed after 48-72 hr of bFGF or NT3 exposure and processed for PCNA immunohistochemistry and bisbenzimide counterstaining (Fig. 1D-F). The results show a significant decrease in GF values in NT3-treated cultures, indicating a reduced proportion of cycling cells. Opposite results are found in bFGF-treated cultures, in which increased GF values are observed (Fig. 2G,H). In agreement with the above Western blot analysis, this result shows that NT3-treated cultures are characterized by a low proportion of cycling cells and a high proportion of postmitotic cells whereas bFGF-treated cultures contain high levels of cycling precursors and low proportions of postmitotic cells.
Together, these observations indicate that the reduced proliferation rate observed in NT3-treated cultures is associated with an increased fraction of precursors undergoing differentiative divisions and exiting the cell cycle. In contrast, the higher rates of proliferation observed in bFGF-treated cultures are associated with an expansion of the precursor pool through increased proportions of proliferative divisions.
Figure 1. Effects of NT3 and bFGF on cell density and growth fraction. A, Median values of LI measured between
24 and 48 hr after plating in E14-E16 cultures. BrdU incorporation identifies the fraction of cycling precursors (PCNA-positive) in the S phase and determines the LI. Because the S phase duration is usually invariant, variations of LI reflect changes in the cell cycle duration (Schmahl, 1983). n, Number of experiments. B, C, Histograms showing the variations in CD observed after 2 DIV in the different conditions in E14 (B) and E15 (C) cultures. t = 0, Cell density measured just after plating. D-F, Microphotographs of control (D), bFGF-treated (E), and NT3-treated (F) cultures immunolabeled for PCNA and counterstained with Hoechst. PCNA immunopositive nuclei are brown. G, H, Histograms showing the GF values in the different experimental conditions at 2 DIV in E14 (G) and E15 (H) cultures. GF is determined by the proportion of PCNA-positive cells with respect to the total population. Values are averages ± SEM obtained from two to four coverslips. ***p < 0.0005; **p < 0.005; *p < 0.05 compared with control (Mann-Whitney U test). The average number of cells counted for each coverslip ranged between 5000 and 10,000.
Figure 2. Western blot analysis of CDK2, CDK4, cyclin A, cyclin D2, and p27kip1 expression on the whole
population. Just after plating (0 DIV) or after bFGF (25 ng/ml) and NT3 (25 ng/ml) exposure for 1-3 DIV, cells were harvested and analyzed for steady-state levels of CDK2, CDK4, cyclin A, cyclin D2, and p27kip1 expression. CDK2, CDK4, and cyclin A, expression was analyzed by direct Western blot using 5 µg of total protein lysates for each sample. Expression of cyclin D2 and p27kip1 was analyzed by immunoprecipitation (using 250 µg of total protein lysates for each sample) followed by Western blot analysis.
Influence of bFGF and NT3 on the neuroblast cell cycle machinery
The above results point to the activation of positive regulators of the cell cycle and repression of negative regulators in bFGF-treated cultures. Conversely, NT3-treated cultures are characterized by a upmodulation and downmodulation of, respectively, negative and positive cell cycle regulators. However, because expression of CDK2, CDK4, cyclin D, and cyclin A is usually downregulated in postmitotic cells (Hu at al., 2001), the Western blot analysis performed on the whole population does not make it possible to determine whether the changes in the level of gene expression are the consequences of changes in the proportions of precursors and postmitotic cells or whether they also indicate variations in cell cycle regulatory gene activity within the cycling precursor pool. To gain insight into the mechanisms that mediate the differentiation-promoting effect of NT3 and the proliferation-promoting effect of bFGF, it is therefore necessary to monitor the levels of gene expression within the cycling precursor pool.
In contrast to CDKs and cyclin A, which have seldom been shown to be direct targets of mitogenic or differentiation stimuli (Ando and Griffin, 1995), D-type cyclins and CDK inhibitors such as p27kip1 have been shown to be early cell cycle targets of mitogenic and antimitogenic signals and therefore to play a critical role in the decision for the cell to initiate a new division (Koff and Polyak, 1995; Kerkhoff and Rapp, 1998; Sherr and Roberts, 1999; Dey et al., 2000; Takuwa and Takuwa, 2001). This prompted us to monitor the expression levels of p27kip1 and cyclin D2 in the cycling precursors and to determine whether the regulation of these genes is altered in response to treatments with bFGF and NT3. Using confocal microscopy analysis of fluorescent immunolabeling, we quantified the levels of expression of p27kip1 and cyclin D2 in the population of cycling cells (i.e., PCNA-positive cells) (Fig. 3). We observed that, in both control and experimental conditions, all precursors express both p27kip1 and cyclin D2 (Fig. 3G,H). These results show that bFGF and NT3 treatment significantly modifies the levels of expression of these two cell cycle regulatory molecules (Fig. 3G,H,I,J). This analysis showed that bFGF-treated precursors are characterized by decreased levels of p27kip1 expression with concomitant significantly increased levels of cyclin D2 expression. Conversely, NT3-treated precursors show decreased levels of cyclin D2 expression with concomitant increased levels of p27kip1 expression. This result indicates that bFGF and NT3 signaling regulates the expression of cyclin D2 and p27kip1 in the cycling neuroblasts, thus before the decision to leave the cell cycle and to undergo terminal differentiation.
Figure 3. Level of expression of p27kip1 and cyclin D2 in cortical precursors. The fluorescent immunolabeling against p27kip1 (revealed by Cy3) and cyclin D2 (revealed by Cy2) has been quantified in nuclei of cortical precursors with confocal microscopy (see Materials and Methods). A-F, confocal photomicrographs of PCNA-positive cells (A, D) in which cyclin D2 expression has been revealed by immunolabeling (B, E) in control and bFGF-treated cortical precursors. C, F, Overlay between PCNA and cyclin D2 immunolabeling. Cyclin D2 expression levels are stronger in bFGF-treated than control precursors. Scale bar, 10 µm. G, Percentage of cortical precursors expressing different levels of cyclin D2. In control conditions, >70% of cycling precursors express low levels of cyclin D2, and conversely, low percentages of precursors are characterized by high levels of cyclin D2 expression. In bFGF-treated cultures, there is a strong increase in the percentage of cells expressing high levels of cyclin D2. NT3 treatment results in a drastic increase in the proportion of precursors expressing low levels of cyclin D2. H, Percentage of cortical precursors expressing different levels of p27kip1. In control conditions, most precursors exhibit low or intermediate levels of p27kip1. bFGF treatment results in >70% of precursors expressing low levels of p27kip1. NT3 treatment results in increased percentages of cells showing high levels of 27 kip1 expression. I, Histograms showing the mean level of cyclin D2 expression in the total precursor population, analyzed by confocal microscopy. J, Histograms showing the mean level of p27kip1 expression in the total precursor population analyzed by confocal microscopy. Statistical analysis: *p < 0.05; **p < 0.005; ***p < 0.0005, according to a Mann-Whitney nonparametric U test.
Influence of bFGF and NT3 on cell cycle duration
Ectopic expression of cyclin D2 is known to increase CDK4-associated kinase activity, which in turn stimulates phosphorylation of the retinoblastoma protein (pRB), thereby accelerating progression through G1 (Ando et al., 1993; Quelle et al., 1993; Lukas et al., 1995). Ectopic expression of p27kip1, by virtue of its ability to bind and to inhibit cyclin D-CDK4 and cyclin E-CDK2 complexes, induces the opposite effect (Vlach et al., 1996; Craig et al., 1997). Therefore, it can be anticipated that bFGF and NT3 induce alterations of the G1 phase duration in cortical progenitors. To explore the consequences
of bFGF and NT3 on cell cycle progression of cortical progenitors, we have implemented a quantitative analysis of cell cycle kinetics. bFGF or NT3 was added to culture media (50 ng/ml) for 48 hr. After a 2-3 hr exposure to BrdU, cells were fixed before being processed for PCNA and BrdU immunohistochemistry. This provides an LI (percentage of BrdU-positive cells with respect to PCNA-positive cells). Variations in the LI reflect variations in the cell cycle duration (Dehay et al., 2001): the higher the LI value, the shorter the cell cycle duration. Compared with control, NT3-treated precursors show decreased LI values. In contrast, bFGF-treated cortical precursors exhibit significantly higher LI values (Fig. 4A). The results in Figure 4A, as well as those described in Figure 1A, indicate a decrease in LI values measured between E14 and E16 precursors, reflecting the slowing down of the cell cycle during corticogenesis.
Figure 4. Cumulative S phase labeling and
determination of G1 duration. A, Variations of LI values in the PCNA-positive population in the different experimental conditions in E14-E16 cultures. Values are averages ± SEM obtained from two to four coverslips. ***p < 0.0005; **p < 0.005; *p < 0.05 compared with control (Mann-Whitney U test). B, Cumulative BrdU labeling analysis of control and bFGF-treated neuroblasts. The projection of the LI = 100% on the x-axis gives TC - TS. TS is given by the projection of LI = 0 on the x-axis. The TS value is similar in the two conditions. The TC value is reduced in bFGF-treated cultures compared with control cultures, and F test statistical analysis indicates that the two slopes differ significantly. C, Cumulative BrdU labeling analysis of control and NT3-treated neuroblasts. No change in S phase duration is detected. The TC value is significantly increased in NT3-treated cultures compared with controls. F test statistical analysis indicates that the two slopes are different. D, Duration of the G2/M phase measured by the PLM figures. As BrdU-labeled nuclei move through G2 and M phases, the proportion of labeled mitotic figures rises sharply to 100%. Statistical analysis with the F test shows that the two slopes are identical.
To better characterize the influence of NT3 and bFGF on the duration of the different phases of the cell cycle, we performed cumulative BrdU labeling (Nowakowski et al., 1989). This technique makes it possible to calculate the duration of the cell cycle (TC), the duration of S phase (TS) and the combined duration of G1, G2, and M phases (TG1+G2/M) (Fig. 4B,C). Here, we measure the duration of the cell cycle by computing the LI values within the population of cycling cells. In this system, prolonged exposure to BrdU, at least equal to TC - TS, returns LI values of 100%. This is not the case when LI is calculated with respect to the total population (cycling and postmitotic cells). This improved technique allows the accurate determination of TC value by projecting the extrapolated 100% LI value on the x-axis.
For each series of experiments, control cultures return values of total cell cycle duration in the range of 24-30 hr, with TS comprising 5.6 to 9.8 hr (Table 1). LI measurements made during the first 2 DIV indicated a progressive slowing down of the cell cycle at later embryonic stages. This contrasted with later stages of the culture (3 DIV), when we did not detect any significant variation of the cell cycle length with respect to the embryonic age when the dissection was made.
The BrdU cumulative labeling curves show significantly different slopes for control, bFGF-treated, and NT3-treated cultures, indicating different cell cycle times. Extrapolation to 100% LI values shows that the total duration of the cell cycle lengthens by 13-25% in NT3 cultures, whereas bFGF reduces the cycle by 20-32% (Fig. 4B,C, Table 1). These differences are statistically significant (F test) with the exception of NT3 treatment on E16 cortical precursors, which results in a non-statistically significant increase in cell cycle duration. Extrapolation of LI = 0 onto the x-axis defines the duration of the S phase. In all culture conditions, variations in the length of the S phase do not exceed 11% and are not statistically significant (Table 1). Hence, we conclude that bFGF- and NT3-induced changes in the cell cycle duration are attributable to variations of TG1+G2/M.
Cyclin D2 and p27kip1 are, respectively, positive and negative regulators of the G1/S transition. Alterations of their steady-state levels are therefore expected to influence the duration of the G1 phase. To check that the variations in the cell cycle duration that we observe actually result from a variation in the G1 duration, we used the PLM technique to calculate the duration of the G2/M phase, which is given by the ascending limb of the PLM curve (Quastler and Sherman, 1959). The implementation of this technique returns a value of 3 hr for the duration of the G2/M phase in both the control and the two experimental conditions (Fig. 4D). No statistical differences were observed between the three sets of values. Knowing that the duration of the G2/M phase is 3 hr, we then calculated the duration of the G1 phase for each culture condition. This returns values ranging from 16 to 21 hr in control cases. The results show a significant shortening of the G1 phase after bFGF exposure (-31 to -47%) and a significant lengthening after NT3 exposure (+18 to +45%; see Table 1). Cumulative S phase labeling provides indirect measurements of mean TC values for the overall population of precursors. Using time-lapse videomicroscopy, we monitored, in real time, the proliferative behavior of individual precursors for 4-5 d in the three different culture conditions. Time-lapse video recordings make it possible to calculate the period separating two mitoses, thereby returning the cell cycle length values at the single-cell level. The time-lapse videomicroscopy data confirmed the changes in cell cycle duration among control (28.3 hr), NT3-treated (33.2 hr), and bFGF-treated (21 hr) cultures (Fig. 5A). Average values obtained by video recordings and cumulative BrdU labeling were in close agreement (Fig. 5, compare A, C).
Figure 5. Cell cycle duration and mode of division measured by time-lapse videomicroscopy recordings. A, Mean
cell cycle times measured in time lapse videomicroscopy. Mean values: control cultures, 28.3 hr; bFGF, 21 hr; NT3 33.2 hr. B, Proportions of proliferative and differentiative divisions in control and bFGF- and NT3-treated cultures. C, Mean cell cycle times measured with cumulative S-phase labeling. Mean values are derived from Table 1: control, 27.8 hr; bFGF-treated cultures, 21.1 hr; NT3-treated cultures, 32.4 hr. ***p < 0.0005; **p < 0.005; *p < 0.05 compared with control (Mann-Whitney U test).
Influence of bFGF and NT3 on differentiation
The present results show that bFGF treatment leads to an increased pool of cycling precursors (Figs. 1G,H, 6D,E) and concomitantly to a reduction in the proportion of postmitotic cells (Fig. 6H,I). This suggests that bFGF promotes proliferative divisions of cortical neuroblasts and thereby inhibits cell cycle exit, which is a prerequisite for neuronal differentiation. In contrast, NT3 treatment results in a depletion of the precursor pool, concomitantly to an increase in the proportion of cells that exit the cell cycle (Figs. 1G,H, 6D,E,H,I), pointing to an increase in differentiative divisions. Time-lapse videomicroscopy recordings on dissociated precursors make it possible to evaluate, at the single-cell level, the influence of bFGF and NT3 on proportions of proliferative and differentiative divisions. The behavior of cortical precursors was monitored for 4-5 DIV. The mode of division was assessed as proliferative when the daughter cells underwent subsequent division and differentiative when at least one daughter cell did not undergo further mitosis. The results in Figure 5B show that the proportions of differentiative and proliferative divisions are approximately equivalent in control cultures. The situation differs in bFGF-treated cultures in which all divisions are proliferative. The converse situation is observed in NT3-treated precursors in which there is a drastic increase to 91% in the proportion of differentiative divisions.
There are apparent discrepancies in earlier reports on the effects of bFGF on neuronal and glial differentiation. It has been claimed that bFGF promotes glial differentiation of early precursors (Qian et al., 1997). However, in vivo studies suggest that the effects of bFGF on neuron and glial differentiation are critically dependent on the stage of corticogenesis: in rat, bFGF infusion in the ventricle at E15.5 leads to an increase in numbers of neurons and at E20.5 in the number of glia (Vaccarino et al., 1999). Because the in vivo studies cannot distinguish between direct effects on terminal differentiation and indirect effects attributable to changes in the dimensions of the precursor pool, we have readdressed this issue in our in vitro system. Under the present conditions, the dissociated cultures contain different proportions of premitotic and postmitotic populations. The postmitotic population, which corresponds to the PCNA-negative cells, appears somewhat homogeneous in that >80% of postmitotic cells express the neuronal marker MAP2 (Fig. 6H,I). In contrast, the precursor population is known to contain several subsets of precursors with different developmental potentials. A recent study by Hartfuss et al. (2001) has demonstrated that nearly all the cycling cortical precursors could be identified on the basis of the combined expression of glial markers. We find (data not shown) that 80% of PCNA-positive cells express the RC2 glial marker (Misson et al., 1988). However, recent data have demonstrated that 45% of RC2-positive glial precursors of E14-E16 mouse cortical precursors will eventually give rise to pure neuronal progeny, suggesting that neither the presence of the RC2 glial marker nor the radial-like morphology of precursors is predictive of glial fate (Malatesta et al., 2000). This prompted us to assess the influence of bFGF and NT3 on glial differentiation by using the astrocytic marker GFAP, which identifies terminally differentiated astrocytes.
To examine the influence of bFGF and NT3 on neuronal and glial differentiation, triple immunolabeling against PCNA, MAP2, and GFAP was performed in cultures permanently exposed to bFGF and NT3 (25 ng/ml) for 3 and 5 d (respectively, 3 and 5 DIV cultures). The results show no differences in the proportion of GFAP-positive cells in NT3-treated cultures (Fig. 6A). After bFGF treatment, no detectable difference in the proportion of GFAP-positive cells is observed after 3 d of exposure, although there is a significant increase in the percentage of GFAP-positive cells after 5 d of bFGF treatment (Fig. 6A). Under the present conditions, as illustrated in Figure 6C, all GFAP-positive cells are PCNA-positive, and all MAP2-positive cells are PCNA-negative (data not shown; Dehay et al., 2001). Therefore, there are two possible causes in the observed increase in GFAP-positive cells under bFGF treatment (Fig. 6C): (1) an increased rate of proliferation of the pool of precursors and (2) an increased differentiation into the glial lineage. To distinguish between these two possibilities, we determined the proportion of GFAP-positive cells with respect to the cycling population. This shows no statistically significant differences among control and NT3- and bFGF-treated cultures after 3 and 5 d of treatment (Fig. 6F). This shows that in the present conditions, the overall increase in the number of GFAP-positive cells observed in bFGF-treated cultures is the secondary consequence of the increased size of the precursor pool as reflected by the GF values (Figs. 1G,H, 6D). In all three conditions, the percentage of GFAP-positive cells with respect to the population of cycling cells is low (2-3% after 3 d of treatment), increases with time (12% after 5 d of treatment) (Fig. 6F), and is nearly 20% after 7DIV (Fig. 6G), paralleling the increased number of divisions in the PCNA-positive population. This increase in astrocytic differentiation with the number of divisions is in accordance with
the observations of Qian et al. (1997) and Temple (2001), which show that there is a change in the developmental competence of cortical precursors from neural to glial production over time.
Figure 6. Effects of bFGF and NT3 on
neuronal and glial differentiation. Triple labeling was performed to reveal PCNA, MAP2, and GFAP expression in control and NT3- and bFGF-treated cultures. E15 cultures were examined after 3 and 5 d of treatment with bFGF or NT3 (A, D, F, H, J) or after 2 d of treatment with a subsequent 5 d of survival (B, E, G, I, K). A, B, Percentage of GFAP-positive cells with respect to the total population. There is an augmentation of the percentage of GFAP-positive cells after 5 d of bFGF exposure (A) and after 2 d of bFGF exposure followed by 5 d in control medium (B). C, In the present culture conditions, all GFAP-positive cells are PCNA-positive, and all MAP2-positive cells are PCNA-negative. Two possibilities can account for the augmentation of GFAP-positive cells in bFGF-exposed cultures: (1) bFGF treatment results in an augmentation of the cycling population (PCNA+ cells) but does not directly promote glial differentiation. In this case, the ratio GFAP+/PCNA+ would not vary, and the increase in the percentage of GFAP-positive cells is secondary to the increase in the PCNA-positive pool. (2) bFGF promotes glial differentiation per se. In this case, the ratio GFAP+/PCNA+ significantly increases. D, E, The proportion of PCNA-positive cells with respect to the total population determines the GF value. bFGF treatment results in a significant increase in the proportion of the PCNA+ population, and NT3 leads to a reduction of the precursor pool. F, G, Percentage of GFAP-positive cells with respect to the PCNA-positive population. This percentage is low in all three conditions and increases with time in vitro. H, I, Percentage of MAP2-positive cells with respect to the total population. This shows a strong reduction in the proportion of MAP2-positive cells in the presence of bFGF. There is a significant augmentation of MAP2-positive cells in NT3-treated cultures. J, K, Percentage of MAP2-positive cells with respect to PCNA-negative population. Among the population of cells that quit the cell cycle, the MAP2-positive fraction remains constant in all three conditions. Values are mean ± SEM. ns, Not significant; ***p < 0.0005; **p < 0.005; *p < 0.05 compared with control (Mann-Whitney test).
MAP2 immunostaining has been used to examine neuronal differentiation. bFGF increases the size of the precursor pool (Figs. 1G,H, 6D), concomitant with a significant reduction of the proportion of MAP2-positive cells (Fig. 6H). NT3 treatment results in a significant decrease in the proportion of PCNA-positive cells (Figs. 1G,H, 6D), accompanied by an increase in the proportion of MAP2-positive
cells (Fig. 6H). In control cultures, 85% of the cells that quit the cell cycle (PCNA-negative) are MAP2-positive (Fig. 6J). This percentage does not vary significantly among control and NT3- and bFGF-treated cultures after 3 d of treatment, although there is a marginal increase after NT3 treatment after 5 d of treatment (Fig. 6J). This suggests that, in the present conditions, neither bFGF nor NT3 influences neuronal commitment per se and that the increase in the proportion of MAP2-positive cells in NT3-treated cultures is secondary to the cell cycle exit-promoting effect of NT3.
One possible concern is that the presence of the mitogen masks an influence on differentiation. To see whether this were the case, bFGF and NT3 were added to the culture for 48 hr and then removed, and the cultures were maintained for a further 5DIV (Fig. 6B,E,G,I,K). Under these conditions, there was a tendency for an increased rate of differentiation leading to a smaller percentage of PCNA+ cells (Fig. 6E). However, under these conditions, there was no change in the proportions of either GFAP-positive cells among the cycling population (Fig. 6G) or the fraction of noncycling cells that expressed MAP2 (Fig. 6K). These results confirm that neither bFGF nor NT3 influences neuroglial differentiation.
DISCUSSION
The present results provide evidence that bFGF and NT3 exert mitogenic and antimitogenic influences in cortical precursors by altering the expression of positive and negative regulators of G1/S transition, thereby modulating the G1 phase duration. The induction of differentiation is associated with a lengthening of G1, whereas short durations of the G1 phase are associated with high rates of proliferation. These findings have important consequences for understanding the orchestration of changing G1 duration and mode of division that occur in corticogenesis.
bFGF and NT3 effects on the expression of cell cycle regulatory molecules involved in G1/S transition and cell cycle exit
The present results showing that bFGF upregulates expression of cyclin D2 are in line with the known mechanisms that regulate expression of the cyclin D2 gene. bFGF-activated receptor type I mediates signal transduction independently by the ras/mitogen-activated protein kinase (MAPK) and src pathways (for review, see Powers et al., 2000), and the cyclin D2 gene is known to be an end point target of both pathways (Dey et al., 2000). Similarly, the p27kip1 protein level is known to be negatively regulated by ras/MAPK via stimulation of its degradation and inhibition of its synthesis (Aktas et al., 1997; Hirai et al., 1997; Kawada et al., 1997; Sheaff et al., 1997; Takuwa and Takuwa, 1997; Cheng et al., 1998; Hu et al., 1999). In contrast, the molecular mechanisms by which NT3-dependent activation of TrkC negatively regulates expression of cyclin D2 and positively regulates expression of p27kip1 are not known.
Cyclin D2 is rate-limiting for progression through the G1 phase in a number of different cell types (Ando et al., 1993; Quelle et al., 1993; Lukas et al., 1995). Conversely, ectopic expression of p27kip1 inhibits progression through G1 in a number of experimental systems, including cortical neuroblasts (Vlach et al., 1996; Craig et al., 1997; Mitsuhashi et al., 2001). Therefore, the bFGF-induced elevation of the cyclin D2 level associated with a concomitant decrease in the p27kip1 level stimulates CDK2- and CDK4-associated kinase activities, thereby facilitating the G1/S transition. Conversely, the NT3-induced elevation of p27kip1, associated with a concomitant decrease in the cyclin D2 level, is likely to antagonize the progression toward the S phase, thereby facilitating cell cycle exit.
bFGF and NT3 effects on the G1 phase duration of cortical neuroblasts
Using time-lapse video recordings and quantitative analysis of cell cycle kinetics, we demonstrate, for the first time, that the mitogenic influence of bFGF on cortical progenitor cells is also mediated by a shortening of the G1 duration. These observations stand in contrast with previous studies (Cavanagh et al., 1997; Vaccarino et al., 1999) reporting that bFGF increases the proliferative abilities of cortical precursors without altering the cell cycle kinetics. Cavanagh et al. (1997) performed an extensive clonal analysis with retroviral labeling in dissociated cultures over 72 hr and examined a total of 213 clones. After exposure to bFGF, there was a 300% mean increase in clone size. This result is therefore compatible with the present results showing that bFGF increases the proportion of proliferative divisions. However, using the PLM technique, the authors also claim that bFGF failed to influence TC and that both control and bFGF-treated cultures exhibited TC values of 12.5 hr. One possible explanation for the apparent absence of a bFGF effect on TC could come from the in vitro
conditions used, which generated excessively short G1 values of 2.5 compared with the values ranging from 5.2 to 6.9 hr reported in vivo (Waechter and Jaensch, 1972; Reznikov and van der Kooy, 1995). Presumably, the brief G1 in the study by Cavanagh et al. (1997) could not undergo further contraction under the influence of bFGF.
Vaccarino et al. (1999) examined the influence of bFGF on cortical precursors in vivo by infusion of bFGF in the ventricles of embryonic rats and by analyzing proliferation in bFGF knock-out mice. The authors' claim that bFGF increases the proportion of cortical progenitors that reenter the cell cycle without affecting the length of the cell cycle needs to be taken with caution, given the aberrant values for individual phases of the cell cycle. In both mouse and rat, the S value of 12.2 hr at E11.5 in the study by Vaccarino et al. (1999) were more than double that reported previously (Atlas and Bond 1965; Takahashi et al., 1993; Miller and Kuhn, 1995; Reznikov and van der Kooy, 1995).
G1 phase duration and the balance between proliferation and differentiation.
The observation that bFGF maintains cortical precursors in a cycling state is in accordance with in vitro (Ghosh and Greenberg, 1995; Cavanagh et al., 1997) and in vivo (Vaccarino et al., 1999) studies. Our results showing that NT3 treatment prevents the G1/S transition of cortical precursors agree with previous observations. ElShamy et al. (1998) reported that the absence of NT3 leads to an aberrant cell cycle control characterized by marked overexpression of G1 cell cycle proteins associated with an abnormal S phase reentry of sensory neuron precursors. In cortical precursors, the study of Ghosh and Greenberg (1995) is in favor of NT3 promoting cell cycle exit, although the nature of the cell cycle regulators involved was not addressed in that study.
The external signals influencing the choice between proliferation and differentiation in non-neuronal cells are known to take place mostly during the G1 phase. Our results, in agreement with studies in the hematopoietic lineage, show that the duration of the G1 phase correlates with the probability of differentiation (Johnson et al., 1993; Carroll et al., 1995). There is evidence that cyclin D2 and p27kip1 regulate the balance between proliferation and differentiation in certain experimental systems. In the N1E-115 neuroblastoma cell line, differentiation is induced by overexpression of p27kip1 in the absence of any specific differentiation inducers, suggesting that inhibition of CDK activity leading to loss of pRB phosphorylation is a critical determinant for neuronal differentiation (Kranenburg et al., 1995). In 32D myeloid cells, overexpression of cyclin D2 induces contraction of the G1 phase and prevents granulocyte differentiation (Kato and Sherr, 1993). One can hypothesize, therefore, that in cortical precursors, bFGF and NT3 signaling controls the balance between proliferation and differentiation through modulation of levels of cyclin D2 and p27kip1.
Significance of the results for corticogenesis
Given the expression of FGFRs and trk receptors in proliferating cortical precursors (Tessarollo et al., 1993; Ghosh and Greenberg, 1995), bFGF and NT3 are in a position to influence corticogenesis (Vaccarino et al., 1999; Korada et al., 2002).
During early corticogenesis, when bFGF mRNA and protein as well as FGFR2 levels are maximal in the ventricular zone (Vaccarino et al., 1999; Raballo et al., 2000), precursors are cycling rapidly through proliferative divisions, leading to an increase in the precursor pool and minimal levels of neuronal differentiation (Rakic, 1995). One can hypothesize that, by enforcing progression in the S phase, the bFGF influence might nullify certain commitment steps necessary for the proper execution of neuronal differentiation programs. Repression of terminal neuronal differentiation by bFGF could be simply a consequence of the mitogenic effect (i.e., progression into the S phase), although other repression mechanisms that are independent of cell cycling cannot be excluded. It has been shown that bFGF exerts, via the Notch pathway, a potent inhibition of neuronal differentiation in E10 cortical precursors (Faux et al., 2001). Notch effector genes are thought to antagonize basic helix-loop-helix transcription factors that are required for neuronal differentiation (for review, see Kageyama and Nakanishi, 1997). Recent evidence is accumulating in favor of direct regulation of proliferation by Notch proteins (Berry et al., 1997; Baonza and Garcia-Bellido, 2000; Solecki et al., 2001). Notch proteins have been shown to directly regulate factors involved in cell cycle control by upregulating cyclin D1, activating CDK2 and resulting in the promotion of S phase entry (Ronchini and Capobianco, 2001).
At midcorticogenesis, when both bFGF and FGFR2 levels have declined in the ventricular zone (Raballo et al., 2000), the increase in cell cycle times resulting from G1 lengthening is paralleled by an increase in the production of postmitotic cells (Caviness et al., 1995). One can hypothesize that the decrease in both bFGF and FGFR2 expression creates a permissive situation for neuronal differentiation.
Both bFGF, which extends the number of cycles of cortical progenitors, and NT3, which promotes cell cycle withdrawal, affect the timing of cell cycle exit, which has been shown to determine fate in cortical neurons (McConnell and Kaznowski, 1991; Frantz and McConnell, 1996; Polleux et al., 2001). Clonal studies have shown that the neurogenic potential of cortical precursors decline with age (Qian et al., 2000), and current models of cell lineage predict that at some point cortical precursors stop producing neurons and give rise to highly proliferative glial progenitors (Temple, 2001). Although the present results show that NT3 and bFGF in vitro do not directly influence neuroglial differentiation, bFGF, by modulating the number of cell cycles of precursors during corticogenesis, may indirectly influence glial production at later stages of corticogenesis.
In conclusion, the present findings, showing that two key regulators of corticogenesis exert a concerted action on G1 duration and mode of division, shed light on the orchestration between cell cycle regulation and neuronal generation in the cortex.
References
Aktas H, Cai H, Cooper GM (1997) Ras links growth factor signaling to the cell cycle machinery via regulation of cyclin D1 and the Cdk inhibitor p27KIP1. Mol Cell Biol 17:3850-3857.
Allendoerfer KL, Cabelli RJ, Escandon E, Kaplan DR, Nikolics K, Shatz CJ (1994) Regulation of neurotrophin receptors during the maturation of the mammalian visual system. J Neurosci 14:1795-1811.
Ando K, Griffin JD (1995) Cdk4 integrates growth stimulatory and inhibitory signals during G1 phase of hematopoietic cells. Oncogene 10:751-755.
Ando K, Ajchenbaum-Cymbalista F, Griffin JD (1993) Regulation of G1/S transition by cyclins D2 and D3 in hematopoietic cells. Proc Natl Acad Sci USA 90:9571-9575.
Atlas M, Bond VP (1965) The cell generation cycle of the eleven-day mouse embryo. J Cell Biol 26:19-24.
Averbuch-Heller L, Pruginin M, Kahane N, Tsoulfas P, Parada L, Rosenthal A, Kalcheim C (1994) Neurotrophin 3 stimulates the differentiation of motoneurons from avian neural tube progenitor cells. Proc Natl Acad Sci USA 91:3247-3251.
Baird A (1994) Potential mechanisms regulating the extracellular activities of basic fibroblast growth factor (FGF-2). Mol Reprod Dev 39:43-48.
Baonza A, Garcia-Bellido A (2000) Notch signaling directly controls cell proliferation in the Drosophila wing disc. Proc Natl Acad Sci USA 97:2609-2614.
Berry LW, Westlund B, Schedl T (1997) Germ-line tumor formation caused by activation of glp-1, a Caenorhabditis elegans member of the Notch family of receptors. Development 124:925-936.
Bolton WE, Freeman JW, Mikulka WR, Healy CG, Schmittling RJ, Kenyon NS (1994) Expression of proliferation-associated antigens (PCNA, p120, p145) during the reentry of G0 cells into the cell cycle. Cytometry 17:66-74.
Bravo R, Fey SJ, Bellatin J, Larsen PM, Arevalo J, Celis JE (1981) Identification of a nuclear and of a cytoplasmic polypeptide whose relative proportions are sensitive to changes in the rate of cell proliferation. Exp Cell Res 136:311-319.
Carroll M, Zhu Y, D'Andrea AD (1995) Erythropoietin-induced cellular differentiation requires prolongation of the G1 phase of the cell cycle. Proc Natl Acad Sci USA 92:2869-2873.
Cavanagh JF, Mione MC, Pappas IS, Parnavelas JG (1997) Basic fibroblast growth factor prolongs the proliferation of rat cortical progenitor cells in vitro without altering their cell cycle parameters. Cereb Cortex 7:293-302.
Caviness Jr VS, Takahashi T, Nowakowski RS (1995) Numbers, time and neocortical neuronogenesis: a general developmental and evolutionary model. Trends Neurosci 18:379-383. Cheng M, Sexl V, Sherr CJ, Roussel MF (1998) Assembly of cyclin D-dependent kinase and titration of p27Kip1 regulated by mitogen-activated protein kinase kinase (MEK1). Proc Natl Acad Sci USA 95:1091-1096.
Craig C, Wersto R, Kim M, Ohri E, Li Z, Katayose D, Lee SJ, Trepel J, Cowan K, Seth P (1997) A recombinant adenovirus expressing p27Kip1 induces cell cycle arrest and loss of cyclin-Cdk activity in human breast cancer cells. Oncogene 14:2283-2289.
Dehay C, Savatier P, Cortay V, Kennedy H (2001) Cell cycle kinetics of neocortical precursors are influenced by embryonic thalamic axons. J Neurosci 21:201-214.
Dey A, She H, Kim L, Boruch A, Guris DL, Carlberg K, Sebti SM, Woodley DT, Imamoto A, Li W (2000) Colony-stimulating factor-1 receptor utilizes multiple signaling pathways to induce cyclin D2 expression. Mol Biol Cell 11:3835-3848.
ElShamy WM, Fridvall LK, Ernfors P (1998) Growth arrest failure, G1 restriction point override, and S phase death of sensory precursor cells in the absence of neurotrophin-3. Neuron 21:1003-1015. Faux CH, Turnley AM, Epa R, Cappai R, Bartlett PF (2001) Interactions between fibroblast growth factors and Notch regulate neuronal differentiation. J Neurosci 21:5587-5596.
Frantz GD, McConnell SK (1996) Restriction of late cerebral cortical progenitors to an upper-layer fate. Neuron 17:55-61.
Fukumitsu H, Furukawa Y, Tsusaka M, Kinukawa H, Nitta A, Nomoto H, Mima T, Furukawa S (1998) Simultaneous expression of brain-derived neurotrophic factor and neurotrophin-3 in Cajal-Retzius, subplate and ventricular progenitor cells during early development stages of the rat cerebral cortex. Neuroscience 84:115-127.
Ghosh A, Greenberg ME (1995) Distinct roles for bFGF and NT-3 in the regulation of cortical neurogenesis. Neuron 15:89-103.
Giordano S, Sherman L, Lyman W, Morrison R (1992) Multiple molecular weight forms of basic fibroblast growth factor are developmentally regulated in the central nervous system. Dev Biol 152:293-303.
Hartfuss E, Galli R, Heins N, Gotz M (2001) Characterization of CNS precursor subtypes and radial glia. Dev Biol 229:15-30.
Hirai A, Nakamura S, Noguchi Y, Yasuda T, Kitagawa M, Tatsuno I, Oeda T, Tahara K, Terano T, Narumiya S, Kohn LD, Saito Y (1997) Geranylgeranylated rho small GTPase(s) are essential for the degradation of p27Kip1 and facilitate the progression from G1 to S phase in growth-stimulated rat FRTL-5 cells. J Biol Chem 272:13-16.
Hu W, Bellone CJ, Baldassare JJ (1999) RhoA stimulates p27(Kip) degradation through its regulation of cyclin E/CDK2 activity. J Biol Chem 274:3396-3401.
Hu X, Zhang X, Zhong Q, Fisher AB, Bryington M, Zuckerman KS (2001) Differential effects of transforming growth factor on cell cycle regulatory molecules in human myeloid leukemia cells. Oncogene 20:6840-6850.