Publisher’s version / Version de l'éditeur:
Vous avez des questions? Nous pouvons vous aider. Pour communiquer directement avec un auteur, consultez la première page de la revue dans laquelle son article a été publié afin de trouver ses coordonnées. Si vous n’arrivez pas à les repérer, communiquez avec nous à [email protected].
Questions? Contact the NRC Publications Archive team at
[email protected]. If you wish to email the authors directly, please see the first page of the publication for their contact information.
https://publications-cnrc.canada.ca/fra/droits
L’accès à ce site Web et l’utilisation de son contenu sont assujettis aux conditions présentées dans le site LISEZ CES CONDITIONS ATTENTIVEMENT AVANT D’UTILISER CE SITE WEB.
Acoustics Week in Canada 2009 (Annual Conference of the Canadian Acoustical
Association) [Proceedings], p. 2, 2009-10-14
READ THESE TERMS AND CONDITIONS CAREFULLY BEFORE USING THIS WEBSITE.
https://nrc-publications.canada.ca/eng/copyright
NRC Publications Archive Record / Notice des Archives des publications du CNRC :
https://nrc-publications.canada.ca/eng/view/object/?id=91811ede-2a78-4190-bfed-a221adbbff02 https://publications-cnrc.canada.ca/fra/voir/objet/?id=91811ede-2a78-4190-bfed-a221adbbff02
NRC Publications Archive
Archives des publications du CNRC
This publication could be one of several versions: author’s original, accepted manuscript or the publisher’s version. / La version de cette publication peut être l’une des suivantes : la version prépublication de l’auteur, la version acceptée du manuscrit ou la version de l’éditeur.
Access and use of this website and the material on it are subject to the Terms and Conditions set forth at
NRC-IRC computer controlled acoustic measurement and quality
system
http://www.nrc-cnrc.gc.ca/irc
N RC-I RC c om put e r c ont rolle d a c oust ic m e a sure m e nt a nd qua lit y
syst e m
N R C C - 5 1 3 9 2
E s t a b r o o k s , T .
O c t o b e r 2 0 0 9
A version of this document is published in / Une version de ce document se trouve dans:
Acoustics Week in Canada 2009 (Annual Conference of the Canadian Acoustical
Association), Niagara-on-the-Lake, Ontario, Canada, October 14-16, 2009, pp. 2
The material in this document is covered by the provisions of the Copyright Act, by Canadian laws, policies, regulations and international agreements. Such provisions serve to identify the information source and, in specific instances, to prohibit reproduction of materials without written permission. For more information visit http://laws.justice.gc.ca/en/showtdm/cs/C-42
Les renseignements dans ce document sont protégés par la Loi sur le droit d'auteur, par les lois, les politiques et les règlements du Canada et des accords internationaux. Ces dispositions permettent d'identifier la source de l'information et, dans certains cas, d'interdire la copie de documents sans permission écrite. Pour obtenir de plus amples renseignements : http://lois.justice.gc.ca/fr/showtdm/cs/C-42
NRC-IRC
C
OMPUTERC
ONTROLLEDA
COUSTICM
EASUREMENT ANDQ
UALITYS
YSTEMTimothy Estabrooks1
1
National Research Council, 1200 Montreal Road, Ottawa, ON, K1A 0R6 [email protected]
1.
2. INTRODUCTION
Computer measurement systems are becoming the norm for laboratory measurement of transmission loss (ASTM E90), impact sound insulation (ASTM E492), and sound absorption (ASTM C423). Such measurement systems are capable of archiving and quickly comparing current test data with those of previous measurements. This paper describes the architecture, development, and functionality of acoustics software developed at the National Research Council Canada, which is used to organize data from test specimens. The software moves beyond simple data storage and incorporates methods to formalize data verification and data approval for quality control. This is the first in a suite of five papers.
3. DATA ORGANIZTION
Test management software is used to organize specimens and test results. In very large data sets organization is critical to functionality, therefore, the software was designed to allow the user to access various data results quickly and efficiently as well as provide a quick visual reference to users. Using the software it is possible to review any test result, or the raw data from which that result was derived. All values calculated, or measured, are stored in an Oracle database while the raw unprocessed data are stored on a secure backed-up network disk system. This system enables quick and easy access to all data.
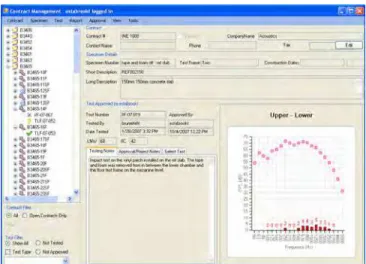
The system design includes a relational database with the capability of linking the contract, specimens and test data together. This relational database allows data to be cross-referenced quickly and efficiently. Figure 1 shows the interface that is used to access tests that have been performed. Once a test is selected, it is possible to review the data for that specimen and compare it to data from previous tests. Since research requires use of non-standard tests, the measurement system was designed so that data from other tests could be associated with the standard test results. This allows the user to spot data trends and perform basic data analysis before exporting the results for detailed analysis. This organization forms the foundation for recording all test data and using the simple tree structure it is possible to see all tests performed on a given specimen.
In Figure 1, the tree in the left of the widow depicts how the contract, specimens and test are related. The icon indicates if the test has been approved, rejected or is awaiting approval. The graph in the lower right depicts measured data. Once a test has been approved all computed data are written to the database ensuring as standards are revised and calculation requirements change, the archived data will remain true to the version of the test method used.
Figure 1: Main window of the measurement system.
4. DATA ENTRY
Defining the specimen to be tested is important for future use of the test data. The system allows the user to enter specimen specifications and to record many aspects of the specimen to be built and tested. For example, the type of material, dimensions, mass, as well as manufacturer, are recorded for all materials used to construct the specimen. For sheet materials the placement, orientation and fastener type, length and spacing, are also recorded. The specifications are used to generate and print detailed instructions that a carpenter can use to build the actual specimen to be tested. The system also records who built the specimen, when it was built, and who performed inspections at various stages of construction. During construction the carpenter records the actual measured mass and dimensions of the materials used. From these actuals it is possible to determine the total mass of the specimen. A sophisticated algorithm is used to check the mass and other metrics of each element. If the data does not match known values within a certain margin of uncertainty the system flags a possible error due to user entry, measurement of the physical quantity, or a product that deviates from the establish norm.
5. SYSTEM CHECKS AND COMPUTER
CONTROLLED MEASUREMENTS
A daily system check is conducted which involves the calibration of the measurement system and a speaker check. A calibrator is placed on each measurement channel and the
channel sensitivity is recorded and then compared to historical records. Once the system is calibrated, the speaker check is conducted by comparing each speaker measurement levels with a stored baseline for that speaker. Once the specimen has been defined, the system calibrated and system checks have been performed, a test may be conducted. Once the user selects the test to be conducted, the computer measurement system uses the information to set up and perform all operations needed to conduct the test. Some tests require user interaction and the user will be directed at the appropriate point during the test to perform the user task, such as moving the light impact hammer box to its next position.
The system records all acoustical signals to file, after which the signal can be processed multiple times allowing the user to extract as much detail from the measurement file as is needed. For example, a signal recorded from a sound source can be processed to determine levels in both octave and one-third octave bandwidths. The signal could also be exported as an audio file to be used for subjective testing or to troubleshoot a problem with a measurement.
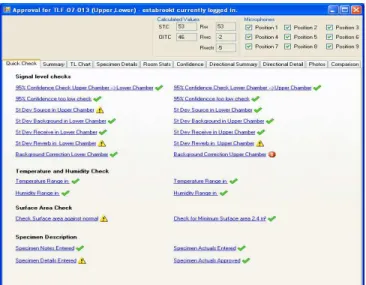
Figure 2: Quick check tab of data approval window
A graphical indication format is also provided which allows the user to quickly identify items that need closer scrutiny. A green checkmark indicates the data is acceptable, while a yellow caution symbol indicates a deviation from comparable historical data. A red exclamation point indicates requirements of the test standard are not satisfied.
6. QUALITY CONTROL
The software enables review of each piece of measured data and identifies similar specimens that can quickly be compared to the test being vetted. This gives the user the ability to spot problems that may not be due to the test data, but rather due to the specimen under test. An example would be a wall with resilient channels that have screws shorting the gypsum board directly to the framing. While the measured data would not indicate a problem; comparison of the current test with historical data would highlight a discrepancy. Upon completion of the data vetting process the user must then approve or reject the test. The software moves beyond simple data storage and
incorporates methods to formalize data verification and data approval for quality control.
The quality control method includes both automated checks, and human review and approvals.
Once specimen test information and measured data are recorded in the database, a quality control audit is performed before the test data is used in any research project or report. The system provides a systematic method to vet both the measured data and the user entered data. A number of automatic checks are performed to ensure the proper data has been entered and measured data is not corrupted. Figure 2 shows the quick-check list provided to assist the user in the quality assurance process.
7. DATA MINING
The system also incorporates sophisticated data mining capability. Using the data miner, it is possible to view historical test data filtered by various criteria. For example, the user could perform a search of all floors that have both a minimum STC and IIC, and further narrow the results by specifying construction details such as joist type, spacing, etc. This enables for quick comparison of data for quality assurance and retrieval of results for more detailed analysis. The quick-check guides the user through the vetting process.
First, the software verifies that the measured data meets the requirements of the test method used. Examples of such requirements might include minimum surface area, temperature and humidity variances. The system also performs statistical analysis on the data collected such as the
spatial variation of the sound field, and background levels.
8. CONCLUSION
The NRC-IRC created Computer Controlled Acoustic Measurement System allows standard acoustics tests to be performed with less user interaction while increasing the data quality. A rigorous quality control system gives the user confidence in the data, while enabling later reprocessing of the measured signals. The data mining capabilities allow access to all test data and the ability to create cross-references between related test sets.
The quick-check also uses previous records in the database to verify that the measured data is within historical norms. For example, the system can verify normal background levels and if the levels are higher than normal it will flag a potential problem with the measurement.