Analysis of informal communication networks - a case study
The Authors
Kai Fischbach, Peter A. Gloor, and Detlef Schoder
Dr. Kai Fischbach, Prof. Detlef Schoder University of Cologne
Seminar for Business Informatics and Information Management Pohligstr. 1
50969 Cologne, Germany
{fischbach | schoder}@wim.uni-koeln.de
Dr. Peter A. Gloor
Massachusetts Institute of Technology Center for Collective Intelligence 77 Massachusetts Avenue Cambridge, MA 0213, USA [email protected]
Analysis of informal communication networks - a case
study
Prefix
It is becoming more and more important for knowledge workers to increase their productivity. However, there is a general lack of (semi-)automated, IT-supported data collection and evaluation approaches that allow insights into the processes and structures of an enterprise's internal networks and the activities of its knowledge workers. This article presents a prototype of an IT-supported instrument ("Social Badges") that supports automatic collection of informal, personal interaction between (knowledge) workers within an enterprise. Our aim is to introduce a novel approach which improves data quality over legacy methods. Our approach uses Social Network Analysis (SNA) to make it easier for executives to analyze and manage informal communications networks. Its practical applicability is demonstrated by a case study.
Keywords:
Analysis of social networks; communications analysis; informal communications; social badges; knowledge worker; communication networks
Summary (for WWW only)
The structure and dynamics of informal communication networks are of central importance for the functionality of enterprise workflows and for performance and innovation of knowledge-centric organizations. While most executives are aware of this fact, there is a general lack of (semi-) automated, IT-supported methods and instruments to make informal communication networks measurable. Although logging of electronic communications has made considerable progress over the past few years, it is still extremely difficult to map personal interaction; manual approaches in particular are extremely error-prone. This article shows how informal communication networks can be investigated by IT-based methods. At the same time, we will be presenting an instrument ("Social Badges") that collects personal communications automatically and more precisely than legacy approaches allow. The practical applicability of our approach is evaluated through a case study.
Summary
The structure and dynamics of informal communication networks are of central importance for the functionality of enterprise workflows and for performance and innovation of knowledge-centric organizations. While most executives are aware of this fact, there is a general lack of (semi-) automated, IT-supported methods and instruments to make informal communication networks measurable. Although logging of electronic communications has made considerable progress over the past few years, it is still extremely difficult to map personal interaction; manual approaches in particular are extremely error-prone. This article shows how informal communication networks can be investigated by IT-based methods. At the same time, we will be presenting an instrument ("Social Badges") that collects personal communications automatically and more precisely than legacy approaches allow. The practical applicability of our approach is evaluated through a case study.
1 Introduction
If the formal organization is the skeleton of a company, the informal is the central nervous system driving the collective thought processes, actions, and reactions of its business units.
(Krackhardt and Hanson 1993, p. 104)
Both the volume and importance of knowledge workers are growing as industrialized countries go through structural changes towards service-oriented societies (Albach 1999; Drucker 1999; Davenport 2005). According to Apte and Nath (2004), knowledge workers already account for 70% of the labor force in the USA and for more than 60% of its added value.
Despite the importance of knowledge-intensive work, little is known about how to improve it compared to manual work processes. This is because the work performed by knowledge workers is complex and hard to measure (Aral et al. 2006; Mangelsdorf 2008; Ramírez and Nembhard 2004). It can be assumed that the way information is exchanged and distributed will have an influence on the relative productivity of groups and actors (Aral et al. 2006; Cross et al. 2003). The modern enterprise's productivity, efficiency and the ability to innovate thus all require an efficient structure and culture with respect to the exchange of knowledge between employees (Cross and Parker 2004; Cross et al. 2003; Balkundi and Harrison 2006). Knowledge is mainly exchanged via informal, social communication networks whose structures often differ greatly from the enterprise's organizational structure and workflows (Krackhardt and Hanson 1993). At the same time, these structures have a decisive influence on the ability of employees, workgroups and the whole enterprise to deliver superior performance as they determine how quickly information can be propagated across a network, or whether stake holding employees will be able to contact each other (Cross and Parker 2004). In this context Cross et al. (2003, S. 8) emphasize that "one of the most consistent findings in the social science literature is that whom you know often has a great deal to do with what you come to know“.
Within this context the management of informal communication networks between enterprise staff becomes strategically significant (Davenport and Prusak 1998; Cross et al. 2003; Berglind and Scales 1987). Knowledge management focuses on those parts of the organizational processes that are regarded as shapeable. The aim is to strength organizational competencies at all levels of the enterprise by means of an effective and efficient approach to knowledge and to create an ecosystem that promotes spontaneous and efficient processes of exchange (Borgatti and Cross 2003).
Although enterprises have invested more in projects designed to improve knowledge management in the past few years, there is still a lack of theoretical findings and proven approaches (Mangelsdorf 2008; Ramírez and Nembhard 2004; Malone et al. 2003; Aral et al. 2006). Various studies demonstrate that attempts to promote cooperation and communication in enterprises are not typically planned (Barrett et al. 2004; Davenport et al. 2002; Cross et al. 2005). Efforts to solve this problem face the challenge that informal communication networks are difficult to measure and monitor. This applies in particular if networks are large and the actors geographically dispersed (Davenport et al. 2002; Barrett et al. 2004). Furthermore, mapping personal communication networks has been difficult and error-prone in the past, as findings have typically had to be reconstructed from third party or self-observation collected by means of interviews with the subjects of the study (Hanneman und Riddle 2005; Marsden 2005).
This is the starting point for this paper. We will present the results of a research project that is currently in progress and whose aim it is to mitigate the deficits of existing approaches. To do so, we have developed a data collection and evaluation method that allows more or less exhaustive and automatic collection of informal communications processes. Besides measuring entirely virtual communications paths, our approach also covers personal communications. To this end a novel portable sensor platform - known as the Social Badge - was developed at the MIT Media Lab: the Social Badge is about the size of a cellular phone and is equipped with various sensors. It supports continuous measurement of the geographic position (Bluetooth), direction of movement and speed (tri-axial acceleration sensor), interaction (infrared sensor) and mood (microphone and speech analysis) of the person wearing it. In combination with social network analysis methods this allows us to draw conclusions about the actors' communication behavior and reconstruct the social network in an optimized way. Systematic data collection or data entry errors, which occur in legacy approaches, are thus reduced.
Our article documents the results of a collaborative study by scientific project partners and a bank (Kreissparkasse Cologne). In field trials the structure of the bank employees' informal communication networks was collected through Social Badges, and email archives. To this end, 22 bank employees wore Social Badges during working hours for the duration of one month. Additionally, the email archives of seven Kreissparkasse branches (approx. 16 million emails) were evaluated over a period of seven months. Besides this network data, data on the productivity of staff members and groups and on staff members’ personalities was collected. This was achieved by means of self-evaluation interviews and personality tests. The results of the study show how conclusions on network structure at actor, group and organizational level, on staff personalities and the way staff communicates can be derived. The content of this article is organized as follows: the next section explains the role played by the analysis of social networks in achieving organizational goals, and the motivation for this article based on deficits in the state of the art of current research. The subsequent section introduces Social Badges as a novel instrument for the analysis of informal communication networks, capable of mitigating these deficits. Our solution and its applicability in research and production use are then evaluated by means of a case study. We close the article with a discussion of the potential and research requirements.
2 State of art of research and our approach
The subject of our research is informal social networks in enterprises. The methods and techniques used in various disciplines to discover the structure of these networks and draw conclusions on their function and quality are commonly grouped under the umbrella of social network analysis, SNA (Wasserman and Faust 1994; Carrington et al. 2005). The central idea behind SNA is that of linking the statistical properties of a formal graph, which acts as a map of a social network, with the actual behavior of the physical actors. The type of interaction that it monitors, and whether or not the actors are individuals, groups or
organizations will vary depending on the discipline and the subject of the investigation. The roots of SNA lie in anthropology, sociology, psychology and organizational theory. SNA has now established itself as an interdisciplinary approach covering an advanced and rich spectrum of qualitative and quantitative methods. For a number of years, it has demonstrated its usefulness in a business context (Borgatti and Foster 2003; Cross and Parker 2004; Cross et al. 2002; Müller and Gronau 2007). Work on this topic has focused on the effect of network structures on the performance of the individual (e.g. Ahuja et al. 2003; Bulkley and Van Alstyne 2006; Cross and Cummings 2004; Gloor et al. 2008; Mehra et al. 2001; Moran 2005; Sparrowe et al. 2001), groups (Balkundi and Harrison 2006; Brass 1981; Mayo and Pastor 2005; Reagans and Zuckerman 2001; Sparrowe et al. 2001) and organizations (Ahuja 2000; Podolny and Barron 1997; Powell et al. 1996; Raz and Gloor 2007; Uzzi 1996).
Although research in this area reaches back to the early 1950s (e.g. Guetzkow and Simon 1955; Leavitt 1951), even the most recent studies lead to highly contradictory results (Balkundi and Harrison 2006). For example, authors such as Levi et al. (1954) conclude on the one hand that increasing centralization of group leaders improves the performance of the groups. In their analyses, Raz and Gloor (2007), Cross and Cummings (2004), and Balkundi and Harrison (2006) also conclude that teams that occupy a central position within the inter-group network, or which are led by a inter-group manager with a central position in the intra-inter-group network, perform better. The results of these studies could be theoretically explained by the fact that more centralization in the inter-group network provides access to relevant resources. On the other hand, authors such as Boyd and Taylor (1998) conclude that more centralization impairs the performance of the groups as more effort is required to uphold personal relationships. In line with other experimental studies performed in the 50s (Shaw 1964), Sparrowe et al. (2001) also ascertain a negative effect of "Advice Network Centrality" on group performance. Sparrowe et al. (2001) back up this effect theoretically with Molms (1994) differentiation between dependence, independence and interdependence. While actors in networks with interdependencies are responsible for collaborative output, actors in networks characterized by dependencies can benefit from the work of their subordinates without having contributed to productivity themselves. Actors in decentralized networks are typically more interdependent, which leads to an increased willingness to cooperate. With respect to the effect of group density on performance, Reagans and Zuckerman (2001) note that tighter group density leads to improved performance. This result is also confirmed by Balkundis and Harrisons (2006) meta-analysis. One theoretical argument in favor of this is that the propagation of implicit knowledge is more difficult in sparse workgroups (Hansen 1999). Additionally, a large number of interactions between team members is indicative of mutual dependencies (Sparrowe et al. 2001) which in turn promote collaboration and thus improve the group's performance (Molm 1994). However, Sparrowe et al. (2001) were unable to confirm the positive effect of the density of the "Advice Networks" on group performance, although they did substantiate the negative effect of "Hindrance Network Density" on group performance. A theoretical explanation of this could be that the cost of maintaining a higher communications density in workgroups impacts performance (Burt 1997).
Despite the valuable contribution that all of the above-mentioned studies have made in recent decades, there is still considerable need for research in this area. This is evident from contradictory results of existing research, which indicate deficits with respect to theory. Furthermore, previous research is impaired by inherent design weaknesses listed in the following which impact its validity thus possibly causing contradictory results:
• Firstly, the social network is often reconstructed from questionnaires used by researchers to ask actors about their relationships to other actors in the network. This approach can only reflect some part of the actors' communication behavior in the social network and is thus error-prone. Besides other well-documented references to issues with questionnaires, the social desirability response set, memory effects, or Hawthorne effects lead to respondents deliberately or inadvertently providing false responses and thus distorting the results (Bortz 1984; Bortz and Döring 2006;
Marsden 2005). Furthermore, the adjacency matrices aggregated from the responses are manually entered into evaluation software such as UCINET. This procedure introduces another source of error.
• Secondly, most studies only investigate small networks. Studies that investigate all communication behavior within an organization are rare in comparison; this is also due to the fact that collecting data in larger networks involves a great deal of effort and that practical limitations are quickly reached especially in personal contact networks (Hanneman and Riddle 2005).
• Thirdly, the analyses often ignore temporal aspects (Balkundi and Harrison 2006). Studies of this kind are then based on data that reflect the network structure at a given point in time. The reason for this is that data collection involves substantial effort, especially in the case of manual collection. However, social networks are not static, but subject to dynamic change. Some networks organize themselves, growing along the size and complexity axes, or are in parts disintegrating. At the same time, the roles and positions of persons and groups change over time. These changes to the network are difficult to reflect using legacy data collection approaches.
• Fourthly, many studies are restricted to a single channel of communications and draw conclusions for the whole communications network based on this. Thus far, it has been unclear whether, for example, the position of an actor in an email or telephone network corresponds to that actor's position in a network of personal contacts (Wellman 2001; Grippa et al. 2006). Isolated observation of a single communications channel is an insufficient approach to mapping the complete communications network. Due to contradictory results of previous studies and methodic deficits, further investigations and new data collection methods that are less prone to the flaw of legacy data collection approaches are necessary to achieve more precise and comprehensive data and thus higher data quality.
The aim of our work is to provide a contribution towards improving the quality of the data collection process and thus achieving more consistent research results. The following section introduces a mobile sensor platform, which - in combination with SNA - is capable of easily and automatically mapping informal communication networks even in larger organizations. Both the virtual and the personal informal communications network are continually recorded and prepared for evaluation by means of suitable software tools to avoid measurement errors. This alleviates the above mentioned methodic issues to a great extent.
We will be evaluating the applicability of this instrument in the scope of a case study in Section 4. The content is structured along the following research questions:
• Do different communication networks (email vs. personal communications network) demonstrate structural differences?
• Is there a connection between the network position of an actor and their job satisfaction with respect to the actor's subjective appraisal of their own productivity? • Is their a connection between an actor's personality and their position in the network?
3 Analysis of personal communications relationships using Social Badges
While the evaluation of email or telephone communications is comparatively simple due to the existence of log files, the observation of personal communications (in the sense of "face to face") is a major challenge, especially in large organizations. To address this problem, we used new micro computers – know as Social Badges – which were developed at the MIT Media Laboratory (Pentland 2004; Pentland 2005).
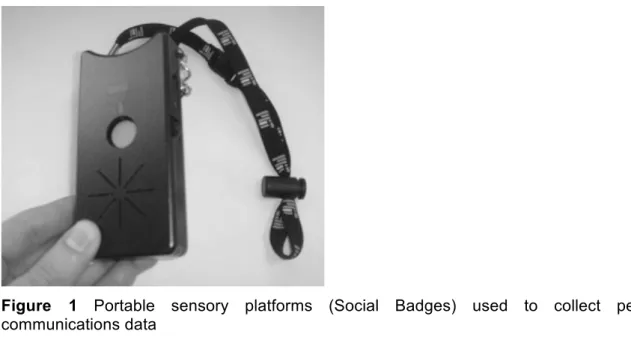
Figure 1 Portable sensory platforms (Social Badges) used to collect personal communications data
These devices measure just a few centimeters (see Figure 1), are equipped with various sensors and record the personal communication and interaction structure of the employees wearing them. Infrared sensors embedded in the Social Badges identify face to face meetings between two candidates. A Bluetooth unit evaluates the position of a person within the building and how far apart the candidates are. An acceleration sensor records movement speeds. Finally, a speech sensor evaluates who has spoken, how much they have spoken, and when. In most cases, evaluating the pitch allows conclusions on the emotionality of the conversation. (The speech sensor was not used in our study.)
Bluetooth The Social Badges used in our project use Bluetooth to transmit their badge IDs to allow them to be pinpointed by other Social Badges at a range of about 10 metres (CC2500 2.4 GHz radio antenna and 2.0 Bluetooth module). Evaluating this data allows to measure which persons are in the vicinity of other persons and thus capable of personal interaction and communication.
Infrared To ascertain personal interaction between two persons, Social Badges transmit their badge IDs every two seconds via an infrared interface (TFDU4300). This signal is logged by another Social Badge, if both Social Badges have a line of sight connection, the distance between the two candidates is less than one meter, and the speakers are looking at each other directly (±15°). If multiple signals of this kind are identified within a short period of time, it can be assumed that the actors are involved in a personal conversation.
Tri-axial acceleration sensor The Social Badges are equipped with a tri-axial acceleration sensor (ADXL330) whose signal is recorded at 250 Hz. After normalizing the signals, the signal vector magnitude, SVM, is calculated to determine the intensity of movement. To be able to distinguish between activity and idle phases, the mean SVM per minute is calculate, and then aggregated to provide the SVM per employee and day.
The use of Social Badges made it possible to mitigate the methodic problems referred to in the previous section: There is no need to reconstruct the personal network from a questionnaire, thus avoiding distortion. The approach can easily be applied to large networks. The data is collected automatically, at a high level of detail and continuously to allow for dynamic analysis of the network development.
The analysis is limited by the fact that Social Badges map only the structure of the network. Conversation content is not taken into consideration for data protection reasons. It is thus only possible to ascertain who has interacted with whom and at what time, but not what the subject of the conversation was.
4 Case Study
The Social Badges were deployed and evaluated in a collaborative case study with the Kreissparkasse Cologne (KSK). KSK is one of the biggest Sparkasse banks in Germany and has a staff of about 4000.
4.1 Data
Seven KSK facilities (branches and internal departments) with a total of 79 staff were selected for the study. To map the communications network between these facilities, the email communications network was monitored for a period of seven months (April 2006 to October 2006). The data set comprises some 16 million emails. The personal communications network of one of the seven business units was monitored using Social Badges. 22 members of this unit wore Social Badges on a daily basis during working hours for a period of one month. These employees expressed their willingness to respond to questions on satisfaction and productivity on a daily basis.
4.2 SNA Software and Data Evaluation
Condor was used to evaluate the network data. We chose Condor from the various state-of-art products available at the time of this writing (see also Huismann und Dujin 2005 and others) as it has been optimized for the evaluation of email archive files on the one hand, and was easy to modify to support evaluation of Social Badge data on the other hand. Furthermore, it is one of just a few products to support the analysis of temporal change processes in networks (Gloor and Zhao 2004; Putzke et al. 2008). Additionally, Condor is capable of determining the statistical and graph theory properties of a network. These properties include the betweenness centrality, BC, of actors, and group betweenness centrality, GBC, (Wassermann and Faust 1994) as used in the scope of the study.
When evaluating the email log files for the investigated groups, we first extracted the messages where both the sender and the recipient were members of the facility to be investigated. Emails with multiple recipients were handled in the same way as individual messages from one sender to one recipient. The data was also anonymized in this step. Only the facility and the team the person belonged to were stored. Additionally, records indicated whether or not the subject had an executive position. Based on this data, Condor calculated the network structure for each facility and each month.
As email content and subject lines were not evaluated and the email addresses were anonymized, staff privacy was respected. Additionally, care was taken to choose facilities with a sufficiently large number of staff to make it impossible to link conclusions to specific individuals. To avoid peer pressure on the candidates in the Social Badges Study, we had the ability to deploy dummy Social Badges that did not record data, but were otherwise visibly indistinguishable from the other devices. This meant that nobody was forced to take part in the study, and there was no need to justify participation, which would seem to improve the acceptance of the empiric data collection design. The whole approach was not only discussed with and monitored by the participants in the study, but also with and by a data protection officer and the staff council of KSK. Data collection did not commence until the executives and staff at the facilities in question had signaled their agreement.
4.3 Results
4.3.1 Comparison of the structures of the email and personal networks
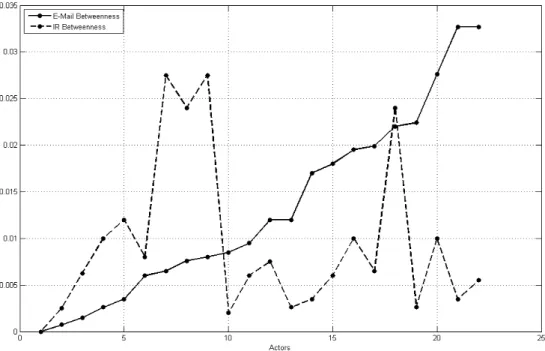
One major finding of our investigation is that the email and personal networks demonstrate different structures. Figure 2 provides evidence of this based on the BC values for the individual employs in the email and personal networks.
Regression analysis performed on the basis of our data and with our participation provides further substantiation for this claim (Ara et al. 2008). The analysis demonstrates that there is a negative relationship between proximity, as determined by geographical position (same office, same corridor) and by team membership, and the number of emails that the members exchange (r = -0.55, p < 0.01).
These results demonstrate that observation of the email network does not truly reflect the entire communications network and thus conceivably provides the enterprise with insufficient information. The results contradict the findings of previous research which view the email network as a useful approximation of the total, informal communications network.
Figure 3 The BC values for staff differ in a persona network (dashed line) and an email network (continuous line) (22 persons). The network structures are thus not identical.
4.3.2 Network Position and Personality
In further analysis we checked whether information on personality characteristics of the individual employees allowed conclusions to be drawn on their individual positions within the network and the constellation of the network. In this part of the investigation we used the NEO five factor inventory (NEO-FFI), an internationally recognised personality test developed by Costa and McCrae (1992). The NEO-FFI allowed us to ascertain the five main dimensions of a person’s personality: neuroticism (emotional stability: resilient vs. sensitive), extraversion (introverted vs. extraverted), openness for experiences (conservative vs. explorative), compatibility (antagonistic vs. compliable) and diligence (flexible inattentive vs. focused-pedantic).
Of the 22 persons who took part in the Social Badges experiment, 16 agreed to take part in the NEO-FFI test. Evaluating the results and mapping them with the structure of the informal network confirmed the following five hypotheses (Gloor et al. 2009): (1) Extraversion correlates positively with active participation in personal interaction (r = 0.52; p < 0.05). (2) There is a negative correlation between neuroticism and the intensity of personal interaction (r = -0.75, p < 0.01). (3) The degree of extraversion - in combination with the individual assessment of productivity – is a predictor for the position in the network (r = 0.64, p = 0.02). This means that people with a high degree of extraversion consider themselves particularly productive if they are at the centre of the network, whereas people with a low level of extraversion consider themselves productive when they are geographically located at the edge of the network. (4) Openness for experiences and volatile fluctuation of individual BC correlate positively (r = 0.59, p = 0.017). (5) Individual compatibility and fluctuation of BC values correlate negatively (r = -0.54, p = 0.03).
4.3.3 Network structure and self-assessment
Further regressive analyses performed on the basis of our data indicate that coherences exist between the number of contacts and interactions on the one hand, and the subjective assessment of job satisfaction and productivity on the other. Statements on individual job satisfaction and productivity were collected by means of a survey, which was completed by the staff taking part in the Social Badge experiment at the end of each working day. The questionnaire contained the following questions; the respondents answered on a scale of 1 (very high/very much) to 5 (very low/very little): Question 1: How would you assess your productivity today? Question 2: What is your level of job satisfaction today? Question 3: What was your stress level today?
Evaluation of the personal communications network (see also Ara et al. 2008) shows that the number of different colleagues that an employee interacts with in the course of a day correlates with the response to Question 1 (r = 0.19, p = 0.001) whereas the total time an employee spends on personal communication correlates with the responses to Questions 1, 2 and 3 (r = 0.27, 0.22 and 0.31; p = 0.0008, 0.0006 and 0.0001). If we look at the network comprising the personal network and email communications, the evaluation (Olguin Olguin and Pentland (2008) demonstrates negative correlation between the volume of communications and job satisfaction (Question 2) (r = -.48, p = 0.01); this indicates that the level of satisfaction drops with the volume of messages exchanged. It also appears that a low level of activity correlates negatively with the individual perception of productivity (Question 1 (r = -0.202, p = 0.001)). A low level of activity typically indicates that an employee has mainly stayed at their desk during the day and has not interacted much with others. This status appears to correlate with a high self-assessment of the candidate’s productivity.
May we point out at this point that the informative value of the above mentioned results is impaired by the sample size. However, the investigation does show how the virtual map of personal communication relationships helps to analyze the structure of the social network and to understand staff, their positions and roles in the network. Additionally, it helps executives to better identify the strengths and weaknesses of their staff and to deploy them in line with their skills and thus use the human resources pool in a more effective way. Thus, the basis for a variety of applications where SNA can be deployed in a useful manner has been created.
5 Open Research Questions and Potentials
Understanding and successful management of communication networks is one of the objectives of knowledge-driven enterprises. Reaching this goal is made more difficult by the fact that informal communication structures are typically difficult to monitor. This applies in particular to collecting data in personal contact networks. Previous research approaches have faced various issues due to these problems and to the lack of suitable instruments: it was necessary to reconstruct the network structure by means of surveys for example. This approach led to documented distortion in many cases. Moreover, the effort involved meant that it was not typically possible to observe more than a small part of the overall network. At the same time, analysis was typically restricted to one or two statistical network states - again mainly due to the major effort that data collection involved, so that dynamic changes to the network typically went unnoticed. Finally, most investigations focused on single communications channels, such as email, which again led to incomplete information on the overall network. These methodical problems have led to previous research being unable to produce consistent results in many areas of this field.
This article shows how a mobile sensory platform and the use of SNA can help to mitigate the four deficits referred to and thus produce a more complete data basis. The use of Social Badges allows for automated collection of structure data and thus adds a further communications channel to the data basis.
To evaluate this instrument we demonstrated an initial approach to how the data collected by means of Social Badges can be combined with SNA methods to answer questions concerning the correlations between network structure and performance, self-assessment, personality and network position respectively, and concerning structural similarities between different types of informal networks.
This article also points to potential for research and real world deployment above and beyond these questions: the approach can also be used to identify weaknesses in enterprise networks and as a decision making tool in the process of group reorganisation (see Gloor et al. 2007; Putzke et al. 2008). Organisational charts often fail to reflect the actual group structures within the enterprise, as occurring due to unplanned, informal communications. Using the method presented here, it is easier to ascertain which persons and groups communicate well, and which persons interact less frequently than envisaged. This applies also to business processes. The better they reflect actual information flows within the enterprise, the more effective business processes are. The approach presented here again provides significant insights. At an individual project management level it is also important to recognize which employees are central to a group, who acts as a gatekeeper to link teams and where bottlenecks occur (due to, say, an excessive number of emails). This also facilitates the identification of experts in the enterprise: taking the content of emails into account, bi-modal networks can be generated to link staff with topics and visualise knowledge maps that show who is involved in exchanges on certain topics and with what degree of intensity. These maps also show which employees have knowledge and experience in which disciplines and fields. Knowledge maps are thus a valuable tool for quickly locating specialist knowledge, or composing project teams where a combination of staff with experience from different divisions of the enterprise is required.
Faced with the diversity and complexity of informal networks, all previous attempts to analyse these networks can only be regarded as first steps towards a robust and comprehensive understanding. Of course, the research project presented here has its own limitations. To provide more robust answers to the research questions illustrated here, more - and more extensive - investigations are required. In the interest of improving the data collected for the subject of the investigation, these investigations should not be restricted to structural information on the sender, recipient and time of the communication, but also look into the semantics of the communication. Moreover, the effort involved in collecting personal network
data can again be reduced by integrating Social Badge technology in objects of daily use, such as ID badges or cellular phones (Pentland 2008).
Acknowledgment
The authors would like to thank Sandy Pentland, Ben Waber, and Daniel Olguin Olguin for their invaluable help in developing and setting up the social tag infrastructure, and in post-processing the raw data. We are grateful for the cooperation and support we received from KSK and especially from Markus Stiefelhagen. We are also grateful to Johannes Putzke and Daniel Oster for their feedback and suggestions on an earlier version of this article. The authors also would like to thank the three anonymous reviewers for their invaluable advice and suggestions that greatly improved the article.
Literature
Ahuja, G. (2000): Collaboration Networks, Structural Holes, and Innovation: A Longitudinal
Study. In: Administrative Science Quarterly 45(3), S. 425-455.
Albach, H. (1999): Innovation und Investition (Innovation and Investment – German). Gabler,
Wiesbaden.
Apte, Uday M.; Nath, Hiranya K. (2007): Size, Structure and Growth of the U.S. Information
Economy. In: Apte, Uday; Karmarkar, Uday (Publisher): Managing in the Information Economy. Springer, New York, S. 1-28.
Ara, Koji; Kanehira, Naoto; Olguin Olgiun, Daniel; Waber, Benajmin N.; Kim, Taemie; Mohan, Akshay, Gloor, Peter; Laubacher, Robert; Oster, Daniel; Pentland, Alex; Yano, Kazuo (2008):
Sensible Organizations: Changing Our Business and Work Style through Sensor Data. In: Journal of Information Processing 16, p. 1-12.
Aral, Sinan; Brynjolfsson, Erik; Van Alstyne, Marshall (2006): Information, Technology and
Information Worker Productivity: Task Level Evidence. In: Proceedings of the 27th Annual International Conference on Information Systems, Milwaukee, Wisconsin.
Balkundi, Prasad; Harrison, David A. (2006): Ties, Leaders, and Time in Teams – Strong
Inference about Network Structure's Effects on Team Viability and Performance. In: Academy of Management Journal 49 (1), p. 49-68.
Barrett, C. L.; Eubank, S.; Kumar, V.S.; Marathe, M. V. (2004): Understanding Large-Scale
Social and Infrastructure Networks: A Simulation Based Approach. In: SIAM News 37 (4).
Berglind, B. L.; Scales, C. D. (1987): White-collar Productivity: Seeing Through the
Borgatti, Stephen P.; Cross, Robert (2003): A Relational View of Information Seeking and
Learning in Social Networks. In: Management Science 49 (4), p. 432-445.
Borgatti, Stephen P.; Foster, Pacey C. (2003): The Network Paradigm in Organizational
Research: A Review and Typology. In: Journal of Management 29 (6), p. 991–1013
Bortz, Jürgen (1984): Lehrbuch der empirischen Forschung für Sozialwissenschaftler
(Manual of Empiric Research for Social Scientists). Springer, Berlin.
Bortz, Jürgen; Döring, Nicola (2006): Forschungsmethoden und Evaluation für Human- und
Sozialwissenschaftler. (Research Methods and Evaluation for Human and Social Scientists) 4th Edition, Springer, Berlin.
Boyd, N.G.; Taylor, R.R. (1998): A Developmental Approach to the Examination of
Friendship in Leader-Follower Relationships. In: Leadership Quarterly 9, p. 1-25.
Brass, D.J. (1981): Structural Relationships, Job Characteristics, and Worker Satisfaction
and Performance. In: Administrative Science Quarterly 26 (3), p. 331-348.
Bulkley, Nathaniel and Van Alstyne, Marshall W. (2006): An Empirical Analysis of Strategies
and Efficiencies in Social Networks. MIT Sloan Research Paper No. 4682-08. http://ssrn.com/abstract=887406, Accessed 2008-04-23.
Burt, R. S. (1997): A Note on Social Capital and Network Content. In: Social Networks 19, p.
355-373.
Carrington, Peter J.; Scott, John; Wasserman, Stanley (Hrsg.) (2005): Models and Methods
in Social Network Analysis. Cambridge University Press, Cambridge.
Costa, Paul T.; McCrae, Robert R. (1992): NEO PI-R Professional Manual. Odessa, FL:
Psychological Assessment Resources, Inc.
Cross, R.; Borgatti, S. P.; Parker, A. (2002): Making Invisible Work Visible: Using Social
Network Analysis to Support Strategic Collaboration. In: California Management Review 44 (2), p. 25-46.
Cross, R.; Cummings, J.N. (2004): Tie and Network Correlates of Individual Performance in
Knowledge-Intensive Networks. In: Academy of Management Journal 47 (6), p. 928-937.
Cross, Robert; Parker, Andrew; Sasson, Lisa (2003): Networks in the Knowledge Economy,
Cross, Robert; Parker, Andrew (2004): The Hidden Power of Social Networks.
Understanding How Work Really Gets Done In Organizations. Harvard Business School Press, Boston.
Davenport, Thomas H.; Prusak, L. (1998): Working Knowledge: How Organizations Manage
What They Know. Harvard University Press, Cambridge.
Davenport, Thomas H.; Thomas, R.J.; Cantrell, S. (2002): The Mysterious Art and Science of
Knowledge-Worker Performance. In: MIT Sloan Management Review 44 (1), 23-30.
Davenport, Thomas H. (2005): Thinking for a Living: How to get better Performance and
Results from Knowledge Workers. Harvard Business School Press, Boston.
Drucker, Peter F. (1999): Knowledge-Worker Productivity: The Biggest Challenge. In:
California Management Review 41 (2), 79-94.
Enkel, E.; Heinold, P.; Hofer-Alfeis, J.; Wicki, Y. (2000): The Power of Communities. How to
Build Knowledge Management on a Corporate Level Using the Bottom Up Approach. In:
Davenport, T.; Probst, G. (Publisher): Knowledge Management Case Book. John Wiley &
Sons, New York, p. 84-103.
Gloor, Peter; Oster, Daniel; Putzke, Johannes; Fischbach, Kai; Schoder, Detlef; Ara, Koji; Laubacher, Robert; Olguin Olguin, Daniel; Pentland, Alex; Waber, Ben (2007): Studying
Microscopic Peer-to-Peer Communication Patterns. In: Proceedings of the 13th Americas Conference on Information Systems (AMCIS), Keystone, Colorado, USA, Aug. 9-12, 2007.
Gloor, P.; Oster, D.; Raz, O.; Pentland, A.; Schoder, D. (2008): The Virtual Mirror - Reflecting
on Your Social and Psychological Self to Increase Organizational Creativity. In: Journal of International Studies of Management & Organization, forthcoming.
Gloor, P.A.; Paasivaara, M.; Schoder, D.; Willems, P. (2008): Finding Collaborative
Innovation Networks through Correlating Performance with Social Network Structure. In:
International Journal of Production Research 46 (5), pp. 1357-1371.
Gloor, Peter A.; Zhao, Yan (2004): TeCFlow – A Temporal Communication Flow Visualizer
for Social Networks Analysis. In: Proceedings of the ACM CSCW Workshop on Social Networks. ACM CSCW Conference, Chicago, 6 November.
Grippa, Francesca; Zilli, Antonio; Laubacher, Robert; Gloor, Peter A. (2006): E-Mail May Not
Reflect The Social Network. In: Proceedings of the North American Association for Computational Social and Organizational Science (NAACSOS) Conference, Notre Dame, IN, USA.
Guetzkow, H.; Simon, H. (1955): The Impact of Certain Communication Nets Upon
Organization and Performance in Task-Oriented Groups. In: Management Science 1 (3/4), S. 233–250
Hannemann, Robert A.; Riddle, Mark (2005): Introduction to Social Network Methods.
University of California, Riverside.
Hansen, M. (1999): The Search-Transfer Problem: The Role of Weak Ties in Sharing
Knowledge Across Organizational Subunits. In: Administrative Science Quarterly 44, p. 82-111
Helton, R. (1988): The “Best Work” Method of Knowledge Worker Assessment. In: Industrial
Management 30 (5), p. 19-22.
Huisman, Mark; Duijn, Marijtje (2005): Software for Social Network Analysis. In: Carrington,
Peter J.; Scott, John; Wasserman, Stanley (Publisher): Models and Methods in Social Network Analysis. Cambridge University Press, Cambridge, S. 270-316.
Krackhardt, David; Hanson, Jeffrey R. (1993): Informal Networks: The Company behind the
Charts. In: Harvard Business Review 71 (4), p. 104-111.
Leavitt, H. (1951): Some Effects of Certain Communication Patterns on Group Performance.
In: Journal of Abnormal and Social Psychology 46, p. 38-50.
Malone, T.; Laubacher, R.; Morton, M.S. (2003): Inventing the Organizations of the 21st
Century. MIT Press, Cambridge.
Mangelsdorf, Martha E. (2008): What Makes Information Workers Productive. In: MIT Sloan
Management Review 49 (2), p. 16-17.
Marsden, Peter V. (2005): Recent Developments in Network Measurement. In: Carrington,
Peter J.; Scott, John; Wasserman, Stanley (Publisher): Models and Methods in Social Network Analysis. Cambridge University Press, Cambridge, p. 8-30.
Mayo, Margarita; Pastor, Juan Carlos (2005): Networks and Effectiveness in Work Teams:
The Impact of Diversity. Instituto de Empresa Business School Working Paper No. WP05-10, http://papers.ssrn.com/sol3/papers.cfm?abstract_id=1016118, accessed 2008-04-23.
McCrae, R. R.; Costa, P. T. (1983): Joint Factors in Self-Reports and Ratings: Neuroticism,
Extraversion and Openness to Experience. In: Personality and Individual Differences 4 (3): 245-255.
Mehra, A.; Kilduff, M.; Brass, D.J. (2001): The Social Networks of High and Low
Self-monitors: Implications for Workplace Performance. In: Administrative Science Quarterly 46 (1), S. 121-146.
Molm, L.D. (1994): Dependence and Risk: Transforming and Structure of Social Exchange.
In: Social Psychology Quarterly 57, p. 163-176.
Moran, P. (2005): Structural vs. Relational Embeddednness: Social Capital and Managerial
Performance. In: Strategic Management Journal 26 (12), p. 1129-1151.
Müller, Claudia und Gronau, Norbert (Hrsg.) (2007): Analyse sozialer Netzwerke und Social
Software - Grundlagen und Anwendungsbeispiele (Analysis of Social Nws and Social Software – Basics and Sample Applications). GITO-Verlag, Berlin.
Pentland, Alex (2008): Honest Signals: How They Shape Our World. MIT Press, Cambridge.
Pentland, Alex (2005): Socially aware computation and communication. In: IEEE Computer
38 (3), p. 33-40.
Pentland, A.; Choudhury, T.; Eagle, N.; Singh, P. (2004): Human Dynamics – Computation
for Organizations. In: Pattern Recognition Letters 26 (4), p. 503-511.
Podolny, J.M.; Baron, J. N. (1997): Resources and Relationships: Social Networks and
Mobility in the Workplace. In: American Sociological Review 62 (5), p. 673-693.
Powell, W.W.; Koput, K.W.; Smith-Doerr, L. (1996): Interorganizational Collaboration and the
Locus of Innovation: Networks of Learning in Biotechnology. In: Administrative Science Quarterly 41(1), p. 116-145.
Putzke, J.; Gloor, P.; Fischbach, K.; Olguin, D. O.; Oster, D.; Schoder, D.; Pentland, S.
(2008): Business Intelligence und die Analyse unternehmensinterner Kommunikationsprozesse (Business Intelligence and the Analysis of Enterprise-Internal Communications Processes). In: Bichler, M. et al. (Publisher): Multikonferenz Wirtschaftsinformatik 2008 (Multi-Conference Business Informatics), GITO-Verlag, Berlin.
Ramírez, Yuri W.; Nembhard, David A. (2004): Measuring Knowledge Worker Productivity: A
Taxonomy. In: Journal of Intellectual Capital 5 (4), p. 602-628.
Raz, Ornit; Gloor, Peter A. (2007): Size Really Matters – New Insights for Start-ups’ Survival.
In: Management Science 53 (2), p. 169-177.
Reagans, R.; Zuckerman, E. W. (2001): Networks, Diversity, and Productivity: The Social
Shaw, M. (1964): Communication Networks. In: Berkowitz, L. (Hrsg.): Advances in
Experimental Social Psychology. Academic Press, New York, p. 111-147.
Sparrowe, R.T.; Liden, R.C.; Wayne, S.J. (2001): Social Networks and the Performance of
Individuals and Groups. In: Academy of Management Journal 44 (2), p. 316-326.
Uzzi, B. (1996): The Sources and Consequences of Embeddedness for the Economic
Performance of Organizations: The Network Effect. In: American Sociological Review 61 (4), p. 674-698.
Wasserman, S.; Faust, K. (1994): Social Network Analysis. Methods and Applications.
Cambridge University Press, Cambridge.
Wellman, Barry (2001): Computer Networks as Social Networks. In: Science 293 (5537), p.