HAL Id: inserm-00874950
https://www.hal.inserm.fr/inserm-00874950
Submitted on 16 May 2014HAL is a multi-disciplinary open access
archive for the deposit and dissemination of sci-entific research documents, whether they are pub-lished or not. The documents may come from teaching and research institutions in France or abroad, or from public or private research centers.
L’archive ouverte pluridisciplinaire HAL, est destinée au dépôt et à la diffusion de documents scientifiques de niveau recherche, publiés ou non, émanant des établissements d’enseignement et de recherche français ou étrangers, des laboratoires publics ou privés.
Automatic determination of optimal view for the
visualization of coronary lesions by rotational X-ray
angiography
Hélène Feuillâtre, Sanokho Bassirou, Jean-Claude Nunes, Marcel Bedossa,
Christine Toumoulin
To cite this version:
Hélène Feuillâtre, Sanokho Bassirou, Jean-Claude Nunes, Marcel Bedossa, Christine Toumoulin. Au-tomatic determination of optimal view for the visualization of coronary lesions by rotational X-ray angiography. Innovation and Research in BioMedical enginering, 2013, 34 (4-5), pp.291-295. �10.1016/j.irbm.2013.08.004�. �inserm-00874950�
Automatic determination of optimal view for the visualization of coronary lesions
by rotational X-ray angiography
Hélène Feuillâtre
1, 2, Bassirou Sanokho
1, 2, Jean-Claude Nunes
1, 2, Marc Bedossa
1,2,3, Christine
Toumoulin
1, 21INSERM U1099, Rennes F-35000 France,
2 Université de Rennes, Laboratoire Traitement du Signal et de l’Image (LTSI), Rennes F-35000 France
3Département de Cardiologie Interventionnelle, Bloc Cardio-pneumo, Hôpital Pontchaillou, Rennes F-35000 France
Abstract
Treatment of coronary lesions by percutaneous transluminal angioplasty is performed from 2D observations acquired according to an optimal view, i.e. a point of view showing the segment including the stenosis in its most extended and unobstructed dimension over a given perimeter around the lesion. In clinical routine, the research of this view generally involves a large number of acquisitions with repeated injections of contrast agent. In this paper, we present an automatic method to determine this optimal view. We consider that a dynamic sequence of 3D coronary tree is available either
from pre-segmented CT data or by reconstruction of the 3D coronary tree from the projections acquired at each phase of the cardiac cycle. We proceed by volume projection into the detector plane in all possible gantry orientations. The optimal viewing angle is the one that minimizes the degree of segment foreshortening and overlap with adjacent segments in projection space.
Keys word
Rotational X-ray Angiography, Percutaneous Transluminal Coronary Angioplasty, Optimal View, 3D Coronary Tree
1. INTRODUCTION
X-ray angiography plays a prominent role in the treatment of cardiovascular diseases [1]. Two reasons can be stated:
- its spatial and temporal resolutions are higher than those of other imaging systems (CTA and MRA for instance),
- Only Angiography is capable of image guidance during percutaneous revascularization procedures.
However, this imaging modality has severe shortcomings that are partially dependent on the imaged vascular system. Indeed, besides the fact angiography exposes patient to radiation and exploits an iodinated contrast agent to opacify the vessel lumen, it also produces 2D images that may misrepresent the true anatomic characteristics of the vessel lumen. Thus image interpretation is impaired by the effect of vessel foreshortening and overlap and requires some experience from the medical practitioner. This phenomenon can lead to erroneous assessment of lesion characteristics (stenosis severity underestimation, inaccurate lesion length measurement), hence the choice of an inappropriate stent. To overcome these difficulties, physicians multiply the incidence to find the optimal views which will show the lesion clearly while minimizing vessel overlap and foreshortening of vessel segments in areas of interest. We are interested in the rotational X-ray angiography, which applies a 180 degree rotation around the patient to acquire a sequence of 80 to 150 projections in the space of 4 to 5 heartbeats and during a single injection of contrast. However, this new technique requires the development of tools to assist the cardiologist during the diagnostic stage but also during interventional coronary procedures so as to minimize imaging inaccuracy related to the 2D nature of the observations, and increase the precision and safety of the interventional gesture. These tools relate to:
- the 3D reconstruction of the coronary tree, - the characterization of the lesion,
- the determination of the optimal view,
- the guidance of a catheter in a dynamic
environment.
In this paper, we focus on the third point: the intervention is always performed under X-ray observation according to an optimal view. This view minimizes the degree of foreshortening of the
segment of interest (the one that contains the stenosis to be treated) and its overlap with adjacent segments. We propose herein, a method to automatically calculate this optimal view by taking into account the dynamic component of the coronary structure.
2. MATERIALS
The imaging apparatus consists of an X-ray source and a flat panel detector at opposite ends of the C-arm gantry (Figure 1). This C-C-arm machine rotates around the patient. Parameters defining the C-arm geometry are:
- the primary angle θ which represents a rotation
of the C-arm along an arc from patient’s left to right sides (from Left Anterior Oblic (LAO) to Right Anterior Oblic (RAO) view),
- the secondary angle , which describes a
rotation of the gantry along an arc from the
patient’s head to feet (Cranio (CRAN) – Caudal
(CAUD)),
- the distance of the source to the isocenter
(Source to Object Distance (SOD)),
- the source to detector distance (Source to Image
Distance (SID)).
Figure 1: rotational system acquisition [1]
The research of the best view is carried out by simulating the 2D projections of the 3D coronary tree for all pairs of angles (, ) compatible with the
acquisition system and with respect to the patient’s position. We perform a cone beam projection and only the coordinates of the projected points, belonging either to the centerline of the vessel of interest or the 3D mesh of the coronary tree, are used to determine the projection matrix.
3. METHODS
We consider that a dynamic sequence of 3D coronary tree is available either from pre-segmented
CT or MRA data [2-3] or by reconstruction of the 3D coronary tree from the projections acquired at each phase of the cardiac cycle [4-8] and proceed along the following stages to compute the optimum angular position of the C-arm:
- interactive selection of the vascular segment of
interest in the 3D+T space,
- spatio-temporal matching of vascular branches
over the 3D+T sequence (see section 3.2.),
- simulation of volume projection in a given 2D
plan and in a clinically relevant gantry orientation,
- computation of the foreshortening degree for the
segment of interest and its overlapping rate with adjacent segments, for each relevant gantry orientation and cardiac phase (see section 3.3.),
-
selection of the best angles and result displaying for validation by the cardiologist (see section 3.3.3 and 4).Figure 2: 3D coronary tree at different phases k of the cardiac cycle [2].
3.1.Notations
Let T the duration of a cardiac cycle and K the number of phases (or instants of the cardiac cycle). Each volume of the dynamic sequence is associated with a phase k of the cardiac cycle ( [ ]). For each phase k, the 3D coronary tree is represented by a set of segments , with [ ], Q being the number of vascular segments (a segment being delimited by two bifurcation points or a bifurcation point and an endpoint). The set of segments form a graph and for each segment , a centerline and a volume are associated. A centerline is composed of N points and is related to the location of the
nth point on the centerline , with [ ].
3.2.Spatio-temporal matching
The motion of the heart is non-linear and generates significant distortion of the coronary arteries. The matching aims at locating the position of the
selected segment (the one of interest) in each volume. This information is then exploited in the research of the best view in order to ensure that this view remains optimal over time and cardiac motion. To perform this matching, we apply the Dynamic Time Warping (DTW) which makes use of a dynamic programming algorithm to evaluate the degree of similarity between two sequences of points (of any length) [9]. A sequence is given by the central axis point location of a vascular segment . The matching score between two sequences of points is obtained by the measure of all pairwise distances between points of and the distance matrix computation. If Dist (n,m) defines the pairwise distance between points
of each sequence, then the pairing cost
at location (n,m) of the matrix is given by :
Dq,p (n,m) = Dist (n,m) +
min ( Dp,q (n-1, m), Dp,q (n,m-1), Dp,q (n-1,m-1) )
with and [ ] [ ]
The best match between the two sequences is then obtained by finding the least cost path through the distance matrix when applying a backtracking process from (N, M) to (1,1).
The search for the segment of interest (selected in a volume V k) over time (i.e. in the other volumes)
is performed by considering a set of centerlines located in a close neighborhood of the line segment of interest , in each of the other volumes. The pairing, associated with the minimal distance score
, defines the segments to retain in the
considered volume
3.3.
Criteria for the selection of the
optimal view
Only a few methods have been proposed in the literature to determine automatically this optimal view [10-12]. Garcia et al. [10] determine optimal viewing regions in a static case by considering vascular segments only. In [11], a patient-independent acquisition trajectory is computed to minimize vessel foreshortening and overlap for multiple coronary vessel segments. In [12], Kitslaar
et al. consider the case of the bifurcation where lesions often locate, for which the optimal view has also to provide an optimal angular spacing between vascular segments attached to the bifurcation point. This optimal viewing angle is calculated based on the minimization of foreshortening and vessel overlap. This work is close to Bi and Garcia’s works [10-11]. Two criteria are considered. The first one relates to the degree of foreshortening of a 3D vascular segment after projection onto the 2D plane. The second one expresses the amount of vascular segment that overlap with the segment of interest in 2D space. These parameters are computed for each volume of the dynamic sequence and for each clinically relevant gantry orientation. They are then combined to build an optimal view map.
3.3.1. Rate of foreshortening
The rate of foreshortening f for a given segment is computed from the centerlines. For a given gantry orientation , this rate is given by the ratio between the length of the 2D centerline generated by the forward projection of the 3D centerline onto the detector plane and the maximum length of this 2D line computed for all the directions of projections.
∑ ( ) ∑ ( )
is the forward projection of the centerline
according the pair of angles ( )
3.3.2. Rate of overlap
The overlapping rate between the projection of the selected segment and the other part of the coronary tree is computed by considering the superimposition of these two surfaces, represented by triangular meshes (using Delaunay triangulation). It is given by dividing the sum of the triangle areas that intersect in the two meshes, by the total area of the selected segment mesh:
⋂ [ ( )] [ ]
[ ( )]
A represents the area of the projection of a segment.
3.3.3. Selection of optimal view
The determination of the optimal view map is performed by combining the two above criteria. The rate of foreshortening is first computed for all considered pairs of angles and each cardiac phase k. Thus for each couple of angles, we chose the median value over the computed K rates of foreshortening and applied a threshold to select gantry orientations for which the median rate is lower than 10%. The overlapping rate is afterward calculated for each cardiac phase and for each retained orientation. A threshold is again applied to only keep the pairs of angle whose median rate (extracted over the K phases) is lower than 20%. We finally compute the average of the foreshortening and overlap values for the set of retained orientations. The optimal view is given by the pair of angles which provides the minimal mean value of the two criteria.
4. RESULTS
We evaluated the algorithm using a dynamic sequence of 10 volumes acquired on a 64-slice GE LightSpeed CT coronary angiography system. For each volume, central axis for each main vascular branch was preliminary extracted and the local radii estimated by using a geometrical moment-based tracking scheme (Figures 2 et 3) [2-3].
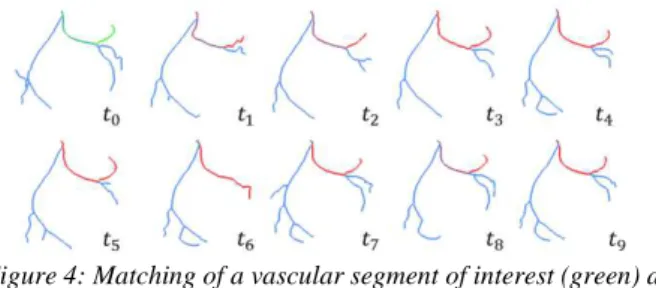
A program with a graphical user interface (GUI) allows the user to load these data, i.e. the 3D coronary tree at different times of the cardiac cycle and their centerlines. The cardiologist can observe each volume over the sequence and then interactively select the vascular segment of interest. The matching process allows finding this segment in the other volumes (the result is displayed in red color on the 3D trees in Figure 4 for the selected segment and the considered sequence). The angular range (primary and secondary angles) is then set, for the computation of the optimal view, as the
maximum number of resulting optimal views to be displayed for checking by the cardiologist. The angular resolution is 1°.
Figure 4: Matching of a vascular segment of interest (green) at the t0 phase with other phases of the 3D left coronary centerlines (in red, the result of the matching between the segment at phase t0 and all the vascular segments at the other
phases of the cardiac cycle).
Clinically relevant gantry orientations range from 90° LAO to 90° RAO for the primary angle and from 30° CRAN to 30° CAUD for the secondary angle. In addition, the ratio between SID and SOD is used to compute the matrix of projection. Three color coded map are built (Foreshortening, Overlap and Optimal View maps) where each pixel represents a coefficient between 0 and 100 for a projection and a given gantry orientation (LAO/RAO defining the y-axis and CRAN/CAUD defining the x-axis in the chart) (Figure 5). In each map, the dark line delineates the suitable projection orientations according to applied criteria. In the Optimal View Map (Figure 5c), the region in dark blue color and delimited by a dark line, is associated with a score lower than 6%. It gathers, in that example, 127 gantry orientations. Figure 6 displays the optimal view over the dynamic sequence i.e. when considering the cardiac motion.
Figure 3 : Input data: superposition of extracted central axis of vascular branches over the sequence. The volume sequence
Figure 5: a) Foreshortening map: median value of the foreshortening rate over time according to the secondary and
primary angles. b) Overlap map. c) Optimal view map: The dark lines indicate the boundaries of the region that contains suitable projection orientation. The score is given between 0
and 50%.
Figure 6: Projection of the 3D coronary tree according to the optimal gantry orientation (θ, φ) = (-87°, 27°) when the selected segment is the one in red color. Median rate of foreshortening =
0.6%, Median rate of overlap = 1.6%.
5. DISCUSSION – CONCLUSION
The proposed algorithm is used to calculate a set of optimal views taking into account the dynamic component of the coronary structure. This is an automatic process that only requires two parameters: the angular range for both primary and secondary angles of the C-arm and the number of optimal views to be proposed to the cardiologist. This article presents here preliminary results. Under progress work aims to improve the temporal tracking of vascular branches over time by considering multi-parametric criteria for the cost function (intensity, curvature, etc.). Another aspect of this work relates to the bifurcation lesions which are associated with a high risk of procedural complications. The objective is to determine the view providing both the least amount of foreshortening and vessel overlap and a high angular spacing between vascular segments running to the bifurcation (80° to 90°). An extensive evaluation will be also realized in collaboration with the interventional cardiologist to evaluate the contribution of this process in the revascularization procedure.
REFERENCE
[1] Chen, S.-Y. and Carroll, J., “Coronary Angiography”, Practical Signal and image processing in clinical cardiology, J. J. Goldberger and J. Ng Edts, Springer Verlag, London, 2010 - DOI: 10.1007/978-1-84882-515-4_13.
[2] Velut J., Lentz P.-A., Philipot C., Garcia M.-P., Toumoulin C,”A qualitative and quantitative study of coronary artery MRA”, Annual International Conference of the IEEE Engineering in Medicine and Biology Society, 2010, 1:5724-7.DOI: 10.1109/IEMBS.2010.562786 [3] Velut, J., P. A. Lentz, D. Boulmier, J. L. Coatrieux and C.
Toumoulin, "Assessment of qualitative and quantitative features in coronary artery MRA", J. IRBM, 2011, 32(4): 229-242.
[4] Xie L, Hu Y, Nunes JC, Bellanger JJ, Bedossa M, Luo L, Toumoulin C, “A model-based reconstruction method for 3-D Rotational Coronary Angiography”, Proc. 32nd Annual International Conference of the IEEE Engineering in Medicine and Biology Society, 2010,1:3186–3189. [5] Hu Y., Jung M. Y., Oukili A., Yang G., Nunes J.-C.,
Fehrenbach J., Peyré G., Bedossa M., Luo L., Toumoulin C. et al., “Sparse reconstruction from a limited projection number of the coronary artery tree in X-ray rotational imaging”, Proc. 8th IEEE International Symposium on Biomedical Imaging (ISBI'12), 2012, 804-807.
[6] Bousse A., Zhou A., Yang G., Bellanger J.-J., Toumoulin C., “Motion Compensated Tomographic Reconstruction of Coronary Arteries in Rotational Angiography”, IEEE T-BME, 2009, 56(4), 1254-1257.
[7] Hansis E., Schafer D., Michael G., and Dossel O., “An iterative method for the reconstruction of the coronary arteries from rotational X-ray angiography,” in Proc. SPIE Medical Imaging, 2007,6510.
[8] Jandt U., Schäfer, D., Grass M., Rasche V., “Automatic generation of 3D coronary artery centerlines using rotational X-Ray angiography”, Medical Image Analysis, 2009, 13:846:858.
[9] Keogh EJ, Pazzani MJ, “Derivative dynamic time warping”, the 1st SIAM Int. Conf. on Data Mining, 2001. [10] Garcia JA, Movassaghi B, Casserly IP, Klein AJ, Chen SJ,
Messenger JC, Hansgen A, Wink O, Groves BM, Carroll JD, “Determination of optimal viewing regions for X-ray coronary angiography based on a quantitative analysis of 3D reconstructed models”, Int J. Cardiovasc Imaging, 2009, 25:455-462.
[11] Bi J., Grass M., Schafer D., “Optimization of acquisition trajectories for 3D rotational coronary venography”, Int. Journal CARS, 2010, 5, 19-28. DI: 10.1007/s11548-00960398-7
[12] Kitslaar PH, Marquering HA, Jukema WJ et al., “Automated Determination of Optimal Angiographic Viewing Angles for Coronary Artery Bifurcations from CTA Data”, SPIE Medical Imaging, 2008, 6918: 69181J1-69181J10.
![Figure 2: 3D coronary tree at different phases k of the cardiac cycle [2].](https://thumb-eu.123doks.com/thumbv2/123doknet/14505565.528724/3.892.486.801.529.651/figure-d-coronary-tree-different-phases-cardiac-cycle.webp)