HAL Id: hal-02419276
https://hal.archives-ouvertes.fr/hal-02419276
Submitted on 19 Dec 2019
HAL is a multi-disciplinary open access
archive for the deposit and dissemination of
sci-entific research documents, whether they are
pub-lished or not. The documents may come from
teaching and research institutions in France or
abroad, or from public or private research centers.
L’archive ouverte pluridisciplinaire HAL, est
destinée au dépôt et à la diffusion de documents
scientifiques de niveau recherche, publiés ou non,
émanant des établissements d’enseignement et de
recherche français ou étrangers, des laboratoires
publics ou privés.
Quantum modeling of the optical spectra of carbon
clusters structural families and relation to the
interstellar extinction UV-bump
Clement Dubosq, F. Calvo, Mathias Rapacioli, E. Dartois, T. Pino, C. Falvo,
Aude Simon
To cite this version:
Clement Dubosq, F. Calvo, Mathias Rapacioli, E. Dartois, T. Pino, et al.. Quantum modeling of
the optical spectra of carbon clusters structural families and relation to the interstellar extinction
UV-bump. Astronomy and Astrophysics - A&A, EDP Sciences, 2020, 634, pp.A62.
�10.1051/0004-6361/201937090�. �hal-02419276�
December 18, 2019
Quantum modeling of the optical spectra of carbon clusters
structural families and relation to the interstellar extinction
UV-bump
C. Dubosq,
1F. Calvo,
3M. Rapacioli,
1E. Dartois,
2T. Pino,
2C. Falvo,
2, 3A. Simon
?11 Laboratoire de Chimie et Physique Quantiques LCPQ/IRSAMC, Université de Toulouse and CNRS, UT3-Paul
Sabatier, 118 Route de Narbonne, F-31062 Toulouse, France
2 Université Paris-Saclay, CNRS, Institut des Sciences Moléculaires d’Orsay, 91405, Orsay, France 3 Univ. Grenoble Alpes, CNRS, LIPhy, 38000 Grenoble, France
December 18, 2019
ABSTRACT
Context. The UV-bump observed in the interstellar medium extinction curve of galaxies has been assigned to π→π?
transitions within the sp2 conjugated network of carbon grains. These grains are commonly admitted to be graphitic particles or polycyclic aromatic hydrocarbons. However, questions are still open regarding the shapes and amorphisation degree of these particles, which could account for the variations of the 2175 Å astronomical bump. Optical spectra of graphitic and onion-like carbon structures were previously obtained from dielectric constant calculations based on oscillating dipole models. In the present study, we have computed the optical spectra of entire populations of carbon clusters using an explicit quantum description of their electronic structure for each individual isomer.
Aims. We aim at determining the optical spectra of pure carbon clusters Cn=24,42,60sorted into structural populations according to specific order parameters, namely asphericity and sp2 fraction, and correlated these order parameters to the spectral features of the band in the region of the UV-bump. Our comparison involves data measured for the astronomical UV-bump as well as experimental spectra of carbon species formed in laboratory flames.
Methods. The individual spectrum of each isomer is determined using the time-dependent density functional-based
tight-binding method. The final spectrum for a given population is obtained by averaging the individual spectra for all isomers of a given family. Our method allows for an explicit description of particle shape, as well as structural and electronic disorder with respect to purely graphitic structures.
Results. The spectra of the four main populations of cages, flakes, pretzels and branched structures (Dubosq et al. 2019)
all display strong absorption in the 2–8 eV domain, mainly due to π→π? transitions. The absorption features however differ from one family to another, and our quantum modeling indicates that the best candidates for the interstellar UV bump at 217 nm are cages, then flakes, while the opposite trend is found for the carbonaceous species formed in flame experiments, the other two families of pretzels and branched structures playing a lesser role in both cases.
Conclusions. Our quantum modeling shows the potential contribution of carbon clusters with a high fraction of
conju-gated sp2 atoms to the astronomical UV bump and to the spectrum of carbonaceous species formed in flames. While astronomical spectra are better accounted for using rather spherical isomers such as cages, planar flakes structures are involved as a much greater component in flame experiments. Interestingly, these flake isomers have been proposed as likely intermediates in the formation mechanisms leading to buckminsterfullerene, which has recently been detected in Space. This study, although restricted here to the case of pure carbon clusters, will be extended towards several directions of astronomical relevance. In particular, the ability of the present approach to deal with large scale molecular systems at an explicit quantum level of electronic structure and its transferable character towards different charge states and the possible presence of heteroatoms makes it a method of choice to address the important case of neutral and ionic hydrogenated compounds.
Key words. interstellar extinction – carbonaceous grains – optical spectra – modelling
1. Introduction
The UV bump, first observed in the 1960s (Stecher 1965b), is a broad ultraviolet absorption bump observed on the in-terstellar medium extinction curves from the Milky Way to high redshift galaxies, with a stable position centered at 217.5 nm although showing variations in intensity and width in different lines of sight (Bless & Savage 1972; Fitz-patrick & Massa 1986, 1990, 2007; Gordon et al. 2003; Elíasdóttir et al. 2009; Clayton et al. 2015; Zafar et al. 2018; Fitzpatrick et al. 2019, and references therein). This
spectral feature has long been assigned to π→π∗ transitions specific to sp2 conjugated carbon
bond-ing of graphite particles or polycyclic aromatic hy-drocarbons (Mishra & Li 2015, 2017). Graphite particles were first proposed in the mid sixties (Stecher 1965a). Graphite, which is made of stacked graphene layers, represents the perfectly ordered prototypical solid sp2structure, whose optical prop-erties in the 0.3–200 µm domain were measured during the last decade by Kuzmenko et al. (2008). Graphite’s properties were included in
astrophysi-cal dust models such as the one developed by Draine & Lee (1984), the Drude model appearing as a con-venient way to model the astronomical UV bump (Fitzpatrick & Massa 1986, 2007).
However, considering graphite grains of a single size and shape in dust models did not allow to reproduce the observed width and peak characteristics simultaneously, which lead the authors to consider more spherical grains with specific size distributions in order to reach spectral agreement (Czyzak et al. 1981; Rouleau et al. 1997; Will & Aannestad 1999). In particular, and as an alternative carrier, Henrard et al. (1993) suggested the possibility of onion-type carbon particles composed of multiple shells of sp2 carbon atoms around a spherical core, which were later explored in the laboratory and confirmed as relevant candi-dates (de Heer & Ugarte 1993; Henrard et al. 1997; Ugarte 1995; Chhowalla et al. 2003; Iglesias-Groth 2004). This hy-pothesis has been revived since C60 buckminsterfullerene was identified in the ISM (Cami et al. 2010; Sellgren et al. 2010; Campbell et al. 2015, 2016; Walker et al. 2015, 2016, 2017).
The variations in the UV bump width and shape have been related to the presence of defects within the sp2 conjugated carbon network. Several
theoretical and experimental studies were subse-quently carried out to unravel the structural ori-gin of these variations. The effects of disorder on the optical absorption spectra of graphitic grains were modeled by Papoular et al. (2013) who com-puted their dielectric constant using a tight-binding model for nano-sized building blocks of a few finite graphene sheets (flakes), introducing disorder by replacing sp2 carbons by sp3 and sp1 atoms.
Inter-estingly, these authors highlighted an effect on the width of the computed band that they located at 5.77 eV, in agreement with Draine’s model (Draine & Lee 1984). Following similar ideas, classical con-tinuum modeling based on the dipolar approxima-tion (Moulin et al. 2008) showed that the optical response of soot particles represented by layers of carbon agglomerated as an onion depends quite sen-sitively on the details of the nanostructure. Exper-imental studies also pointed out the role of curva-ture and probably identified onion-like struccurva-tures as shaping the band at about 220 nm in carbonaceous particles (Llamas-Jansa et al. 2007; Jaeger et al. 2008).
More generally, the contribution of more disordered species was further elaborated under the form of hydro-genated amorphous carbon (HAC) (Jones et al. 1990; Gadallah et al. 2011) and soot particles (Wada et al. 1999; Gavilan et al. 2016, 2017). In an attempt to establish
correlations between carbon grain morphology and spectral data, Rotundi et al. (1998) proposed that carbon nanostructures ordered on the micrometer scale could be better candidates to interpret the UV bump rather than graphitic particles. This
mo-tivated the determination of experimental optical spectra of soot particles for species produced either in plasma form (Wada et al. 1999) or in flames (Gavilan et al. 2016, 2017). Wada et al. (1999) produced what they refer to as quenched carbonaceous composites (QCCs), and proposed to be con-stituted of onion-like carbonaceous particles with a small amount of sp3 carbon atoms. In their flame experiments,
Gavilan et al. (2017) produced compounds analogous to interstellar carbon dust with various levels of nanostruc-turation (Carpentier et al. 2012), leading to variations in the positions of the UV bump.
Several experimental and theoretical studies have also suggested that polycyclic aromatic hydrocarbons (PAHs) might contribute to the UV bump (Beegle et al. 1997; Steglich et al. 2010; Malloci et al. 2008, 2007b). Together with larger grains, PAHs were included in the model pro-posed by Cecchi-Pestellini et al. (2008). However, the cor-responding structures and charge states were chosen in a rather ad hoc way and in a limited numbers (50 molecules in the size range 10 to 66 carbon atoms, in the charge states 0, ± 1, and +2 only.
It is thus commonly admitted that the UV bump is assigned to carbon grains with a high sp2 ratio,
whose variations in the electronic structure lead to changes in the shape and width of the band profile. Experimental studies have shown that the optical response of carbonaceous grains formed in flames or plasmas is related to their nanostructure (de Heer & Ugarte 1993; Mennella et al. 1995; Wada et al. 1999). Unfortunately, modeling the optical spectra of carbon grains taking into account their structure at the atomistic level of details is a theoretical chal-lenge. So far, and to our best knowledge, either the Drude model or an ensemble of oscillating dipoles were considered so as to reproduce the astronomi-cal UV-bump. Although efficient, these approaches are partly phenomenological and do not account for the details of the electronic structure, especially the excited states that are involved in the optical spectrum. As an alternative to the aforecited ap-proaches, the present article proposes a novel de-scription of the nanostructures and optical spectra of broad populations of isomers for large carbon clusters Cn (n=60, 42 and 24), employing a
quan-tum description of the electronic structure allowing excited states to be determined. More precisely, we use time-dependent density-functional based tight-binding (TD-DFTB) (Niehaus et al. 2001) to sys-tematically calculate the UV-visible response for each individual isomer.The isomer populations were
sampled specifically to cover highly diverse degrees of aro-maticity, structural and chemical orderings. Such rather large numbers of carbon atoms also allow the nanometer size range to be reached, as relevant for interstellar carbona-ceous dust particles distributions adopted in astrophysical models. The main goal of the present investigation is to as-sess the possible contribution of these various isomers to the UV bump and to evaluate their relevance as a component of interstellar dust. This work follows on an earlier effort in which the structural diversity itself was characterized (Bon-nin et al. 2019) and its correlation with the infrared (IR) response evaluated in comparison with the spectra mea-sured in planetary nebulae (Dubosq et al. 2019). Here we employ the same samples but focus on the optical response in the UV-visible range, using appropriate but consistent methodologies for addressing electronic excitations in large databases containing hundreds of thousands of structures.
This article is organized as follows. In section 2, we recall the methodology used to generate and analyze the isomers’ samples, and provide some details about the calculations of optical spectra based on TD-DFTB. Section 3 discusses the
spectra of the main isomers’ families of C60clusters, as well as smaller ones. Based on these results, section 4 discusses the possible contribution of these isomers’ families to the astronomical or experimentally observed UV bump. Finally, some conclusions are drawn in section 5.
2. Methodology
2.1. Building up the populations of isomers
The structural diversity of size-selected carbon clusters was explored in our previous work (Bonnin et al. 2019; Dubosq et al. 2019) and classified according to dedicated order pa-rameters, from which the asphericity β and the ratio of sp2 hybridization among carbon atoms were found to be the most insightful. Based on these parameters, four main families could be identified as cages, planar polyaromat-ics (PPAs) also called flakes, pretzels and finally branched structures.
Briefly, cages represent the most ordered (high
%sp2) and spherical isomers (low β) and the most
stable ones (cf Fig. 1 of Dubosq et al. (2019)). PPAs or flakes are more planar (β∼0.5) but still relatively ordered (medium %sp2, %sp1 carbon atoms at the edge) with an intermediate energetic stability. Pret-zel isomers are more disordered with an increased number of sp1 atoms and have a quite pronounced
spherical character (β< 0.4). Finally, the branched family tends to be constituted of more sp1 atoms than sp2 atoms with no spherical character (β close
to 1). Pretzel and branched structures represent the least stable of the four populations (cf Fig. 1 of Du-bosq et al. (2019)). These results are reminded in Fig. 1 (a).
An initial sample of about 100 000 structures was deter-mined for each of the four families from a force field explo-ration (Bonnin et al. 2019) followed by local optimization (Dubosq et al. 2019) at the level of self-consistent charge density-functional-based tight-binding (SCC-DFTB) (Elst-ner et al. 1998). Among these structures, between about 5 000 and 12 000 (8 to 17%) were selected for electronic spectroscopy in order to save computational burden (cf Fig. 1 (a) for n = 60, Fig. A.1(a) and (b) for n = 42 and 24). The characteristics of these families are reported in Ta-ble A.1.These configurations were selected based on their values of β and sp2 fraction lying near the average values of the entire sample for this family and within two stan-dard deviations of the corresponding distribution. When the number of configurations meeting this criterion was considered too large with respect to computational time limitations, some were randomly removed.
2.2. Computation of the optical spectra with the TD-DFTB approach: benchmark and limitations
Full time-dependent density-functional theory (or higher level methods) are not practical for treating thousands of systems containing hundreds of valence electrons, and the TD-DFTB method (linear response formulation) derived by Niehaus et al. (2001) was used instead to calculate verti-cal excitation spectra for all minima in our DFTB sam-ple. TD-DFTB was originally shown to satisfactorily re-produce π→π? transitions in π-conjugated systems as well
as the main features of the experimental UV-visible
0 20 40 60 80 100 % sp2 0 0.2 0.4 0.6 0.8 1 β 100 101 102 103 (a) cages flakes pretzels branched (b)
Cages Flakes Pretzels Branched Fig. 1: (a) Two-dimensional distribution of the initial sam-ple of C60isomers as a function of the sp2fraction and as-phericity parameter β. The rectangles represent the sample of structures for which TD-DFTB spectra were computed; (b) Examples of SCC-DFTB optimized structures, one be-ing chosen for each family.
trum of C60 buckminsterfullerene in the 3–7 eV range, the peak positions being systematically red-shifted similarly to the linear response TD-DFT results (Niehaus et al. 2001). The good performance of TD-DFTB relative to TD-DFT for polyaromatic compounds was further demonstrated re-cently on the examples of cationic PAHs (Rapacioli et al. 2015). Of course, DFT itself is not exact, and TD-DFTB inherits some of its limitations, notably for double excitations that are not accounted for or the use of an ap-proximated exchange correlation functional. In the present work, and to further decrease the computational cost, the dimension of the TD-DFTB linear response matrix was re-duced by neglecting the contribution of the highest-energy single particule excitations (higher than 24 eV for all the size and families of structures). The technique is described in Appendix B.3. Overall, the accuracy of TD-DFTB was assessed against available experiments and dedicated TD-DFT calculations using BLYP/pc-2 (Jensen 2002, 2001) for selected isomers and the details of this benchmarking pro-cedure are provided in Appendix B.
This benchmarking could be performed only up to about 8 eV, above which the description of the electronic exci-tations becomes less reliable (see Fig. B.3). Higher-lying excitations are likely to involve orbitals such as Rydberg orbitals (Malloci et al. 2007b) which are not present in our theoretical method due to the use of a confined minimal ba-sis set. We thus limit our comparison to excitation energies below 8.2 eV (∼150 nm) in the following discussion. From
this benchmarking it also follows that transition energies should be scaled by 0.988 in order to compare better with experimental measurements, the maximum discrepancy
on band positions remaining within 0.3–0.4eV for individual fullerenes (see Tables B.1 and B.2).
Having validated the TD-DFTB approach for the present system, the individual spectra were computed, in-cluding 3000 excited states for isomers of C60, 1050 for C42 and 600 for C24. These rather large numbers of excited states are required to access the region of the UV bump and the onset of the far-UV region where the spectrum starts to increase (Greenberg et al. 1983). All absorption bands shown below were convoluted with a Lorentzian pro-file with a full width at half maximum (FWHM) of 0.01 eV, a value chosen to match the typical band profile of the first electronic transitions of such large molecules (Pino et al. 2011).
Following the approach used to analyze the IR spectral domain (Dubosq et al. 2019), global optical spectra for each of the four families (and subfamilies) were constructed by adding the individual contributions from all members of those families, i.e. simple arithmetic weighting.
The (TD-)DFTB calculations were performed with the deMonNano software package (Heine et al. 2009) employing the mio set of parameters (Elstner et al. 1998). TD-DFT calculations were carried out with the Orca software pack-age (Neese 2012).
3. Results: electronic spectra of Cn
(n = 60, 42,
24) isomers’ families
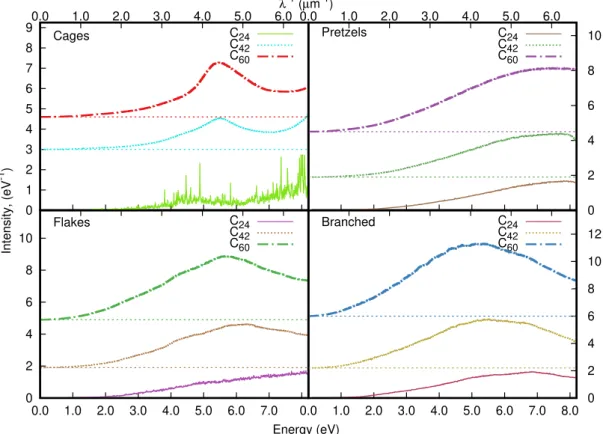
The optical absorption spectra computed for the four iso-mers’ families of Cn(n = 60, 42, 24) are reported in Fig. 2.
For each family bright transitions are found in the 2–8 eV re-gion, leading to bell shapes differing from one family to the other. The evolution of the maximum position as a function of size is notably reported in Fig. 5 (b) with the correspond-ing values becorrespond-ing also given in Table C.1.
Despite the multideterminantal character of the transi-tions making the analysis more difficult, insights into their nature were gained by visualizing the orbitals of the domi-nant single particule contributions for a selected number of transitions at various energies, for a small sample of struc-tures within each family. Results for the four specific iso-mers depicted in Fig. 1 (b) are given in Appendix C.3. In the present work, we refer to σ and π characters as local concepts because the isomers have no particular symmetry in general: σ orbitals are symmetrical around the consid-ered C-C bond whereas π orbitals are antisymmetrical with respect to a local molecular plane.
The optical spectrum of the cages population, char-acterized by a high sp2 ratio, exhibits a pronounced ab-sorption band centered at 5.52 eV (225 nm or 4.45 µm−1) with a FWHM (obtained after continuum substraction) of 1.53 eV in the case of C60, corresponding to (σ, π)→π? transitions (see Fig. C.1 in Appendix C.3 with examples of involved orbitals). At higher energy, the intensity in-creases again, starting at ∼8 eV. When decreasing the
size of the cluster to n = 42, the position of the maximum is found to be hardly affected (5.49eV, FWHM=1.49eV) while the red tail of the highest-energy band appears redshifted. The case of C24
is somewhat different because of the very limited
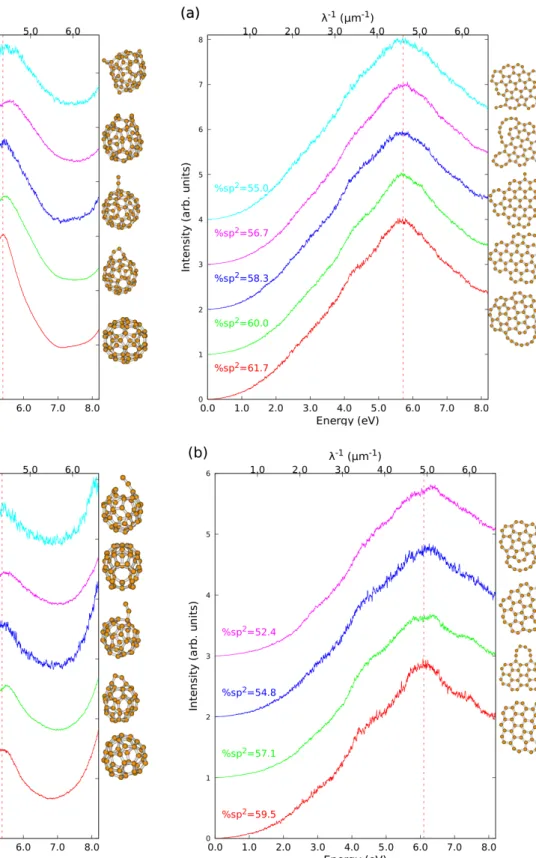
number of cage isomers it supports (11 only). The spectra for subfamilies of a given sp2fraction are re-ported on Fig. 3(a) and (b) for C60 and C42,
respec-tively. Decreasing the number of sp2 atoms hardly affects the position of the maximum (5.41–5.52 eV for C60, 5.42–5.47 eV for C42). However, the shape
of the bump appears sensitive to this order parame-ter in the case of C60 and broadens with decreasing
sp2 fraction, the FWHM varying form 1.13 (100%
sp2) to 1.72eV (93% sp2).
The spectrum of the flakes population is characterized by only one broad band, centered at 5.74 eV (215 nm or 4.66 µm−1) in the case of C
60, and is followed by a plateau at higher energies. Upon decreasing the cluster size,
the band maximum shifts towards higher energies, 6.17eV for C42 and 8.48eV for C24. The shape of this band, which is particularly broad for the smaller cluster, suggests that it originates from the combination of different sub-bands. This is likely due to an evolution in the nature of the electronic transitions, from mostly π→π? character at
lower energies reaching ∼6–7 eV toward increasingly σ→π?
character at higher energies (see Fig. C.2 for examples of involved orbitals). The flakes population differs from the cages population by the presence of more planar structures with sp1 carbon atoms located at the edge of the carbon skeleton. Transitions towards virtual molecular orbitals lo-cated at the edge, which do not exist in the case of hy-drogenated flakes, are found here (see Appendix C.3 and Fig. C.2).
The spectra for subfamilies of a given sp2 frac-tion are reported on Fig. 4(a) and (b) for C60 and
C42, respectively. Decreasing the number of sp2
atoms hardly affects either the position of the max-imum (5.69–5.77 eV in the case of C60) or the shape
of the bump. However, in the case of C42, the
po-sition appears slightly blueshifted when decreasing the sp2 fraction, varying from 6.10 to 6.24 eV.
The spectrum of the pretzels population displays only one broad band with a maximum at 7.52 eV (165 nm or 6.07 µm−1) in the case of C
60, which marks the onset of a plateau at higher energies. The position of the maximum tends to be shifted towards higher energies with decreas-ing cluster size. In the studied energy range, this band appears mainly due to π→π? transitions (see Fig. C.3 in
Appendix C.3 with examples of involved orbitals).
Finally, the combined spectrum of the branched struc-tures shows one band in the selected energy range. This band is centered at 5.31 eV (233 nm or 4.28 µm−1) in the case of C60 and appears due to π→π? transitions as well (see Fig. C.4 in Appendix C.3 with examples of involved orbitals). The position of the maximum tends to be
shifted towards higher energy with decreasing clus-ter size and, as can be seen in Fig. 5(a), the position of the maximum for clusters’ size larger than 40 carbon atoms falls into the expected astronomical features of the interstellar and circumstellar envi-ronments. The evolution of the first electronic tran-sition energy as a function of size for all families and all cluster sizes is reported in Fig. 5(b). The value of this gap is found to decrease with increasing cluster size, which was expected when π→π?transitions are involved, and this gives credit to the method used.
0 2 4 6 8 10 0.0 1.0 2.0 3.0 4.0 5.0 6.0 7.0 Flakes Energy (eV) C24 C42 C60 0 1 2 3 4 5 6 7 8 90.0 1.0 2.0 3.0 4.0 5.0 6.0 Cages Intensity, (eV -1 ) λ-1 (µm-1) C24 C42 C60 0.0 1.0 2.0 3.0 4.0 5.0 6.0 7.0 8.0 0 2 4 6 8 10 12 Branched C24 C42 C60 0 2 4 6 8 10 0.0 1.0 2.0 3.0 4.0 5.0 6.0 Pretzels C24 C42 C60
Fig. 2: Average electronic absorption spectra computed at the TD-DFTB level for the four main populations of C60, C42 and C24. 3000, 1050, and 600 roots were used for each individual isomer spectrum of C60, C42, and C24, respectively.
In summary, the spectra of the cages population are hardly dependent on size and so do the spectra obtained for pretzels structures, albeit to a lesser extent. In partic-ular, the position of the lowest-energy broad band found for the cages remains unchanged for C42 and C60, while the red tail of the highest-energy band appears redshifted with decreasing cluster size. In the spectra of the flakes and branched populations, the unique broad band becomes blueshifted and flattens out with decreasing cluster size. However, our approach does not allow to analyse the ori-gin of this plateau at higher energies that lie beyond the benchmarking range.
At this stage, we showed how a quantum descrip-tion of the electronic structure of carbon clusters classified into distinct families enables a correlation between the spectral and the structural features. In the next section, we consider the contributions of the different families to the astronomical UV-bump or to the experimental spectrum of carbon species produced in laboratory flames.
4. Comparison with astronomical and experimental
data
In order to assess the possible contributions of the previ-ously presented families to the astronomical UV-bump, we attempted to fit the average galactic extinction curve re-ported by Fitzpatrick & Massa (2007) using the least square method including all populations of all carbon clusters sizes (see Fig. 6(a)). We focused on the UV bump only,
i.e. we did not try to fit neither the far UV rise nor the energy range lower than 4 eV (3.2 µm−1)
as the lowest-energy part exhibits a shoulder near 2.8 µm−1 partly assigned to the contribution of larger grains in the dust distribution in astrophys-ical models (see Fig. 5 in Clayton et al. 2015, and references therein). Since the spectra of pretzels and branched isomers appear to have characteris-tic features far from those of the astronomical UV bump, we constrained in our fit the weights of pret-zels and branched isomers to be lower than those of cages and flakes. This assumption is justified by the greater amount of sp1 atoms these isomers contain
and their larger amorphous character with respect to the cages and flakes families, consistently with the suggestion that the astronomical UV-bump is due to the resonance of electrons in sp2 orbitals of
a conjugated system.
As can be seen in Fig. 6(a), a good agreement could be obtained for 55% of cages (24% for n = 60, 31% for
n = 42) and 31% of flakes (n = 60). The presence of the
cage population reproduces the top of the bump, but it can-not reproduce its red and blue tails, while the contribution of the flakes tends to correct this shortcoming. The iso-mers belonging to the cage and flake families posses mainly conjugated sp2 atoms but also a smaller fraction of sp1 atoms that can be regarded as defects. Besides, more than half the total population that fits has a spherical character (cage family). These results are quite consistent with pre-vious astrophysical modeling and experimental data which concluded that grain size and shape distributions are nec-essary to mimic the UV bump feature (Czyzak et al. 1981; Rouleau et al. 1997; Will & Aannestad 1999), and that pure graphite alone could not account for the 2175 Å
fea-Fig. 3: Average electronic absorption spectra computed at the TD-DFTB level for cages subfamilies defined by a given sp2 fraction for C
60 (a) and C42 (b). The lowest energy isomer for each subfamily is also represented.
ture. The cages family can be regarded as one layer of the carbon-onion structures, considered as good candidates to account for the UV bump (Chhowalla et al. 2003, and ref-erences therein). The TD-DFTB approach does not allow a reliable determination of optical transitions for the onion species due to possible charge transfer between layers
be-Fig. 4: Average electronic absorption spectra computed at the TD-DFTB level for the flakes subfamilies defined by a given sp2 fraction for C
60 (a) and C42 (b). The lowest energy isomer for each subfamily is also represented. ing not properly described. A specific study based on con-strained DFTB (Scholz et al. 2013) or long-range-corrected TD-DFTB schemes (Kranz et al. 2017) would be required to address this specific issue.
For the present astronomical measurements in the UV-visible range, the calculated spectrum lacks intensity at
4 5 6 7 8 9 10 20 25 30 35 40 45 50 55 60 65 (a) ISM CSM Ener gy (eV) n cages flakes pretzels branched 0.2 0.3 0.4 0.5 0.6 0.7 0.8 0.9 1 1.1 20 25 30 35 40 45 50 55 60 65 (b) Ener gy (eV) n cages flakes pretzels branched
Fig. 5: Evolution of the main features of the computed opti-cal absorption spectra as a function of carbon cluster size. (a) Position of the maximum for the UV bump; the ex-pected range for the positions of the astronomical UV bump on the extinction curve in the interstellar medium (ISM) (Fitzpatrick & Massa 2005, 2007) or in circumstellar envi-ronnments (CSM) (Drilling et al. 1997; Buss et al. 1989; Waelkens et al. 1995; Gavilan et al. 2017) is also reported ; (b) Position of the first electronic transition, with dashed lines drawn to guide the eyes.
energies above ∼6 eV, and we believe that polyaromatic hydrogenated compounds might help in solving this dis-crepancy. Such an hypothetic contribution is supported by earlier TD-DFT calculations by Malloci et al. (2005) who found a bump at ∼6 eV for various PAH isomers. These
0 0.2 0.4 0.6 0.8 1.0 1.2 1.4 1.6 0.0 1.0 2.0 3.0 4.0 5.0 6.0 7.0 8.0 1.0 2.0 3.0 4.0 5.0 6.0 (a)
Intensity (arb. units)
Energy (eV) λ-1 (µm-1)
Fitzpatrick et al., Astro. J., 663(1), 320. Family mix (astro) Cages Flakes 0 0.2 0.4 0.6 0.8 1.0 1.2 1.4 1.6 0.0 1.0 2.0 3.0 4.0 5.0 6.0 7.0 8.0 1.0 2.0 3.0 4.0 5.0 6.0 (b)
Intensity (arb. units)
Energy (eV) λ-1 (µm-1)
Gavilan et al., A&A 607, A73 (2017) Family mix (exp) Cages Flakes
Fig. 6: (a) Astronomical UV bump observed on the aver-age Galactic extinction curve (Fitzpatrick & Massa 2007) and (b) experimental spectrum of soot from Gavilan et al. (2017) (C/O ratio of 1.05 and a HAB of 22 mm), both of them fitted by linear combinations of spectra of carbon clus-ters’ families (black solid lines, see Section 4 and Table C.2). The separated contributions of flakes and cages populations to the combined spectrum are also shown. In case (a) the position of the maximum was adjusted to the astronomi-cal data by shifting the result of the linear combination by +0.17 eV, which falls within the error margin of the present TD-DFTB method.
conclusions also confirm the need for considering, in accor-dance with the astrophysical environments, the inclusion of several percents of hydrogen in carbon clusters in future extensions of the present work.
We now compare our results with experimental spec-tra of carbonaceous species produced in laboratory flames (Gavilan et al. 2017) using a similar approach as the one to fit the UV bump. The corresponding results are given in Fig. 6(b). The best fit was obtained for more than 60% of flakes isomers (n = 60, 42 and 24) and 25% cages. Adding small amounts of pretzels and branched structures in the relative weights further improves the agreement by a small
but noticeable extent, in particular the red tail of the ex-perimental bump.
Interestingly, in the experimental soot spectrum, the strong UV band in the 260–200 nm range shifts towards lower energies when the height above the burner (HAB) increases (Gavilan et al. 2017), whereas in the computed spectra of the flakes families, the central wavelength of the UV bump decreases with increasing cluster size (see Fig. 5). This indicates that the further away from the burner, the larger the flakes should be. At short distance from the burner (HAB=14 mm), the position of the maximum is blueshifted with respect to that at 22 mm, and would rather correspond to a PAH population (cf Fig. B.3). Therefore our calculations, although on a restricted size range, support the interpretation of the difference in nanostructuration be-tween the carrier of the interstellar bump at 217 nm and that of the circumstellar bump observed at various posi-tions in the 250–230 nm range (Gavilan et al. 2017; Drilling et al. 1997; Waelkens et al. 1995).
5. Concluding remarks
The optical response of pure carbon clusters Cn with
n = 24, 42 and 60 was computationally determined
us-ing a multiscale approach based on the systematic iden-tification of important families of isomers and the calcu-lation of individual absorption spectra by means of time-dependent density-functional based tight-binding theory. The TD-DFTB method offers a good compromise in terms of chemical accuracy and numerical efficiency, which al-lowed tens of thousands of structures to be analyzed. With respect to earlier classical models, the detailed effect of chemical structure (shape and carbon hybridization) on the electronic spectrum was obtained from an approximated DFT scheme. The isomers’ populations identified in pre-vious work (Dubosq et al. 2019), and especially those of cage structures, were found to be already of astrophysical relevance and possibly contributing to the 6–9 µm plateau observed in planetary nebulae. Here a significant extension was provided by considering the effects of electronic excita-tions and the optical spectra in the UV-visible range. A few limitations of the present work which would deserve more scrutiny in the future were noted. On a technical side, the optical spectra are reliable only in a rather limited range of excitation energies (. 8 eV) and cannot properly describe the contribution to the far UV rise. Furthermore, our sam-ple of conformations was computationally limited to three cluster sizes only, instead of a more likely broad distribu-tion of sizes, or larger clusters with a stronger graphitic character.
By assigning global absorption spectra from the (un-weighted) individual contributions within each population, the present work showed that cages and flakes are likely con-tributors of soot constituents and carriers of the interstellar UV bump with a major contribution of cages structures to the astronomical spectra. Likewise, flakes were found as the dominant motif to interpret measurements on laboratory analogues of carbonaceous dust. Both comparisons confirm the origin of the UV bump that is commonly assigned to
π→π? transitions. In particular, our quantum
mod-eling confirms the potential contribution of mostly spherical, and to a lesser extent planar, carbon clus-ters with a high fraction of conjugated sp2atoms to the astronomical UV bump. Interestingly, some of
these isomers are potentially involved in the for-mation mechanism of buckminsterfullerene, which has recently been detected in Space. The advan-tage of the approach developed in the present work is its transferable character and ability to treat chemically different systems and ionic states. The present investigation, although restricted to pure carbon clusters, paves the way for similar studies on hydrogenated clusters and, more generally, for clusters containing heteroatoms such as oxygen or nitrogen. It will be particularly interesting to ap-ply our methodology to hydrocarbon compounds at various hydrogen loadings, notably including — but not limited to — fully or partially hydrogenated PAHs.
Acknowledgements. The authors gratefully acknowledge financial
support by the Agence Nationale de la Recherche (ANR) Grant No. ANR-16-CE29-0025, and the GDR EMIE 3533. The authors also ac-knowledge the computing mesocenter CALMIP (UMS CNRS 3667) for generous allocation of computer resources (p0059).
References
Bauernschmitt, R., Ahlrichs, R., Hennrich, F. H., & Kappes, M. M. 1998, J. Am. Chem. Soc., 120, 5052
Beegle, L. W., Wdowiak, T. J., Robinson, M. S., et al. 1997, ApJ, 487, 976
Bless, R. & Savage, B. D. 1972, ApJ, 171, 293
Bonnin, M. A., Falvo, C., Calvo, F., Pino, T., & Parneix, P. 2019, Phys. Rev. A, 99, 042504
Buss, R. H., Lamers, H. J. G. L. M., & Snow, T. P. 1989, ApJ, 347, 977
Cami, J., Bernard-Salas, J., Peeters, E., & Malek, S. E. 2010, Science, 329, 1180
Campbell, E. K., Holz, M., Gerlich, D., & Maier, J. P. 2015, Nature, 523, 322
Campbell, E. K., Holz, M., & Maier, J. P. 2016, ApJ, 826, L4 Carpentier, Y., Feraud, G., Dartois, E., et al. 2012, A&A, 548, A40 Cecchi-Pestellini, C., Malloci, G., Mulas, G., Joblin, C., & Williams,
D. 2008, A&A, 486, L25
Chhowalla, M., Wang, H., Sano, N., et al. 2003, Phys. Rev. Lett., 90, 155504
Clayton, G. C., Gordon, K. D., Bianchi, L. C., et al. 2015, ApJ, 815, 14
Czyzak, S. J., Hirth, J. P., & Tabak, R. G. 1981, Vistas Astron., 25, 337
de Heer, W. A. & Ugarte, D. 1993, Chem. Phys. Lett., 207, 480 Draine, B. & Lee, H. M. 1984, ApJ, 285, 89
Drilling, J. S., Hecht, J. H., Clayton, G. C., et al. 1997, ApJ, 476, 865 Dubosq, C., Falvo, C., Calvo, F., et al. 2019, A&A, 625, L11 Elíasdóttir, A., Fynbo, J. P. U., Hjorth, J., et al. 2009, ApJ, 697, 1725 Elstner, M., Porezag, D., Jungnickel, G., et al. 1998, Phys. Rev. B,
58, 7260
Fitzpatrick, E. L. & Massa, D. 1986, ApJ, 307, 286 Fitzpatrick, E. L. & Massa, D. 1990, ApJS, 72, 163 Fitzpatrick, E. L. & Massa, D. 2005, AJ, 130, 1127 Fitzpatrick, E. L. & Massa, D. 2007, ApJ, 663, 320
Fitzpatrick, E. L., Massa, D., Gordon, K. D., Bohlin, R., & Clayton, G. C. 2019, arXiv e-prints, arXiv:1910.08852
Gadallah, K., Mutschke, H., & Jäger, C. 2011, A&A, 528, A56 Gavilan, L., Alata, I., Le, K., et al. 2016, A&A, 586, A106 Gavilan, L., Le, K. C., Pino, T., et al. 2017, A&A, 607, A73 Gordon, K. D., Clayton, G. C., Misselt, K. A., Landolt, A. U., &
Wolff, M. J. 2003, ApJ, 594, 279
Greenberg, J. M., Chlewicki, G., et al. 1983, ApJ, 272, 563
Halasinski, T. M., Salama, F., & Allamandola, L. J. 2005, ApJ, 628, 555
Heine, T., Rapacioli, M., Patchkovskii, S., et al. 2009, deMonNano, http://demon-nano.ups-tlse.fr/
Henrard, L., Lambin, P., & Lucas, A. 1997, ApJ, 487, 719 Henrard, L., Lucas, A., & Lambin, P. 1993, ApJ, 406, 92 Iglesias-Groth, S. 2004, ApJ, 608, L37
Jaeger, C., Mutschke, H., Henning, T., & Huisken, F. 2008, ApJ, 689, 249
Jensen, F. 2001, J. Chem. Phys., 115, 9113 Jensen, F. 2002, J. Chem. Phys., 116, 7372
Jones, A., Duley, W., & Williams, D. 1990, QJRAS, 31, 567 Kranz, J. J., Elstner, M., Aradi, B., et al. 2017, J. Chem. Theor.
Comput., 13, 1737
Kuzmenko, A. B., van Heumen, E., Carbone, F., & van der Marel, D. 2008, Phys. Rev. Lett., 100
Llamas-Jansa, I., Jaeger, C., Mutschke, H., & Henning, T. 2007, Car-bon, 45, 1542
Maier, J. P. 1997, Chem. Soc. Rev., 26, 21 Maier, J. P. 1998, J. Phys. Chem. A, 102, 3462
Malloci, G., Joblin, C., & Mulas, G. 2007a, Chem. Phys., 332, 353 Malloci, G., Joblin, C., & Mulas, G. 2007b, A&A, 462, 627
Malloci, G., Mulas, G., Cappellini, G., Fiorentini, V., & Porceddu, I. 2005, A&A, 432, 585
Malloci, G., Mulas, G., Cecchi-Pestellini, C., & Joblin, C. 2008, A&A, 489, 1183
Mennella, V., Colangeli, L., Bussoletti, E., et al. 1995, Ap&SS, 100, 149
Mishra, A. & Li, A. 2015, ApJ, 809 Mishra, A. & Li, A. 2017, ApJ, 850
Moulin, F., Devel, M., & Picaud, S. 2008, J. Quant. Spectrosc. Radiat. Transf., 109, 1791
Neese, F. 2012, Wiley Interdiscip. Rev. Comput. Mol. Sci., 2, 73 Niehaus, T. A., Suhai, S., Della Sala, F., et al. 2001, Phys. Rev. B,
63, 085108
Papoular, R. J., Yuan, S., Roldán, R., Katsnelson, M. I., & Papoular, R. 2013, MNRAS, 432, 2962
Parac, M. & Grimme, S. 2003, Chem. Phys., 292, 11
Pino, T., Carpentier, Y., Feraud, G., et al. 2011, in EAS Publications Series, Vol. 46, PAHs and the Universe, ed. C. Joblin & A. G. G. M. Tielens, 355–371
Rapacioli, M., Simon, A., Marshall, C. C., et al. 2015, J. Phys. Chem. A, 119, 12845
Rotundi, A., Rietmeijer, F., Colangeli, L., et al. 1998, A&A, 329, 1087 Rouleau, F., Henning, T., & Stognienko, R. 1997, A&A, 322, 633 Scholz, R., Luschtinetz, R., Seifert, G., et al. 2013, J. Phys. Condens.
Matter, 25, 473201
Sellgren, K., Werner, M. W., Ingalls, J. G., et al. 2010, ApJ, 722, L54 Smith, A. L. 1996, J. Phys. B, 29, 4975
Stecher, T. P. 1965a, ApJ, 142, 1681 Stecher, T. P. 1965b, ApJ, 142, 1683
Steglich, M., Jäger, C., Rouillé, G., et al. 2010, ApJ, 712, L16 Ugarte, D. 1995, ApJ, 443, L85
Wada, S., Kaito, C., Kimura, S., Ono, H., & Tokunaga, A. T. 1999, A&A, 345, 259
Waelkens, C., Waters, L. B. F. M., Vanwinckel, H., & Daems, K. 1995, Ap&SS, 224, 357
Walker, G. A. H., Bohlender, D. A., Maier, J. P., & Campbell, E. K. 2015, ApJ, 812, L8
Walker, G. A. H., Campbell, E. K., Maier, J. P., & Bohlender, D. 2017, ApJ, 843, 56
Walker, G. A. H., Campbell, E. K., Maier, J. P., Bohlender, D., & Malo, L. 2016, ApJ, 831, 130
Will, L. M. & Aannestad, P. A. 1999, ApJ, 526, 242
Appendix A: Structural diversity of C
42and C
24Fig. A.1(a) and (b) show the two-dimensional distributions of isomers projected onto the (% sp2 ratio, β) plane from which the four structural families are defined, for C42 and C24, respectively. The rectangles show the ranges in param-eters for each family defining the selection of structure used in TD-DFTB calculation. The ranges of parameters are also specified in Table A.1.
0 20 40 60 80 100 % sp2 0 0.2 0.4 0.6 0.8 1 β 100 101 102 103 (a) cages flakes pretzels branched 0 20 40 60 80 100 % sp2 0 0.2 0.4 0.6 0.8 1 β 10-1 100 101 102 (b) cages flakes pretzels branched
Fig. A.1: Two-dimensional distribution of the initial sample of (a) C42 and (b) C24 isomers as a function of the sp2 fraction and asphericity β. The colored rectangles mark the locations from where the structures were sampled with the purpose of evaluating their TD-DFTB spectra.
Appendix B: Benchmarking of TD-DFTB
Appendix B.1: Determination of scaling factors
The TD-DFTB method being an approximated TD-DFTB scheme, it was necessary to assess the accuracy of its predic-tions against reference data. For disordered carbonaceous clusters, no experimental data on their optical spectra are
C60 cages flakes # 10439 12525 β 0.153 ± 0.029 0.507 ± 0.035 %sp2 94.6 ± 2.6 58.8 ± 3.3 pretzels branched # 5771 12189 β 0.213 ± 0.028 0.560 ± 0.079 %sp2 44.2 ± 7.0 22.7 ± 6.1 C42 cages flakes # 6092 11586 β 0.163 ± 0.028 0.512 ± 0.036 %sp2 90.4 ± 2.5 56.2 ± 2.8 pretzels branched # 4504 12568 β 0.212 ± 0.028 0.576 ± 0.082 %sp2 44.4 ± 7.9 21.8 ± 5.6 C24 cages flakes # 11* 714* β < 0.4 0.3< <0.8 %sp2 75< 45< <75 pretzels branched # 6288* 16791 β <0.35 0.565 ± 0.084 %sp2 <75 23.1 ± 3.8
Table A.1: Ranges in asphericity β and %sp2covered by the four isomers’ families and number # of family members for which the TD-DFTB spectra were calculated. For C24, the full sets of isomers determined by Dubosq et al. (2019) for cages, flakes and pretzels’ populations were used, which is denoted by a star.
available and we resorted to dedicated TD-DFT calcula-tions. For PAH molecules (Malloci et al. 2008; Halasin-ski et al. 2005; Parac & Grimme 2003) and carbon chains (Maier 1998, 1997), TD-DFT calculations and experimen-tal data are both available and those systems were also used for benchmarking. The vertical TD-DFT calculations performed in this work were achieved using the BLYP func-tional and the pc-2 basis set, with the geometries optimized in their ground electronic states at the same level of theory.
TD-DFTB vs TD-DFT for various isomers of pure carbon clusters
The comparison was limited to 15 isomeric structures of C24 due to increased difficulties in the analysis of larger systems, plus C60 buckminsterfullerene. In order to assign the computed transitions at TD-DFTB level to those at TD-DFT(BLYP/pc-2) level, we examined the orbitals in-volved in the lowest-energy transitions. High-energy tran-sitions can hardly be analyzed due to the extreme multi-determinantal character of the involved excited states. As seen in Fig. B.1, the TD-DFTB and TD-DFT transition energies are found to be highly correlated, with a Pearson linear correlation coefficient of 0.9931 ± 0.0071.
TD-DFT vs experimental spectra for PAHs and small car-bon chains
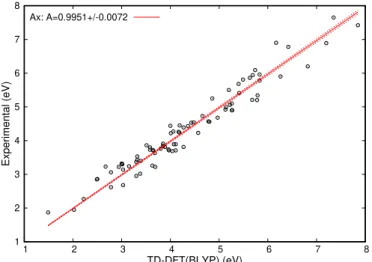
Fig. B.2 shows the correlation between the experimen-tally measured bands and the excitation energies obtained at the TD-DFT(BLYP/pc-2) level. The data were
0.5 1 1.5 2 2.5 3 3.5 4 4.5 5 5.5 6 0.5 1 1.5 2 2.5 3 3.5 4 4.5 5 5.5 6 TD-DFT(BLYP) (eV) TD-DFTB (eV) Ax: A=0.9931+/-0.0071
Fig. B.1: TD-DFT(BLYP/pc-2) absorption bands com-puted for carbon clusters and their corresponding band at the TD-DFTB level. The dotted lines correspond to the uncertainty of the least-squares fitting procedure.
1 2 3 4 5 6 7 8 1 2 3 4 5 6 7 8 Experimental (eV) TD-DFT(BLYP) (eV) Ax: A=0.9951+/-0.0072
Fig. B.2: Experimental absorption bands measured for PAHs and small carbon chains versus their correspond com-puted band at the TD-DFT(BLYP/pc-2) level. The dotted lines correspond to the uncertainty of the least-squares fit-ting procedure.
ated to one another based on the order of appearance of the band and their intensity. This correlation plot was con-structed from a set of 36 molecules (26 PAHs, 8 carbon chains and the C60 and C70 fullerenes). Again, the exper-imental and TD-DFT(BLYP/pc-2) absorption bands ap-pear highly correlated with one another and have a Pearson linear correlation coefficient of 0.9951 ± 0.0072.
Finally, both series of results on carbon clusters and PAHs together with small carbon chains were combined, allowing us to define a global scaling factor of 0.988 ± 0.010 between the band computed at the TD-DFTB level and the reference data.
Appendix B.2: Assessment of the TD-DFTB scaling factor for PAH populations and fullerenes
As the initial benchmark was achieved on a sample of C24 structures alone, the validity of our method was also evalu-ated on fullerene isomers and on PAH populations that are
raw raw corrected
Exp. BLYP/pc-2 TD-DFTB TD-DFTB
3.02 3.38 3.35 3.31
3.81 4.27 4.42 4.37
4.90 5.26 5.33 5.27
5.96 5.83 5.74 5.67
Table B.1: Energies (eV) of optical absorption bands of buckminsterfullerene C60at the TD-DFT(BLYP/pc-2) and TD-DFTB(reduced matrix) level. Experimental values are taken from (Bauernschmitt et al. 1998) and (Smith 1996).
raw raw corrected
Exp. BLYP/pc-2 TD-DFTB TD-DFTB 1.95 2.02 1.93 1.91 2.27 2.22 2.19 2.16 2.62 2.78 2.68 2.65 3.24 3.15 3.02 2.98 3.70 3.65 3.82 3.77
Table B.2: Energies (eV) of optical absorption bands of C70 fullerene at the TD-DFT(BLYP/pc-2) and TD-DFTB (re-duced matrix) levels. Experimental values are taken from (Bauernschmitt et al. 1998) and (Smith 1996).
both relevant to the current populations of cages and flakes identified in our systematic sampling.
The optical absorption spectra of C60 buckminster-fullerene and of C70fullerene computed at both TD-DFTB and TD-DFT(BLYP/pc-2) levels are represented in Fig. B.4, the positions of the main absorption bands being given in Tables B.1 and B.2, respectively.
To test the accuracy of our approach on a broader population of molecules, additional calculations were per-formed on the set of PAH molecules reported by (Malloci et al. 2007a). The geometries were first reoptimized at the SCC-DFTB level of theory, and their averaged TD-DFTB spectrum was computed as the sum of individual spectra, weighted by the number of carbon atoms.
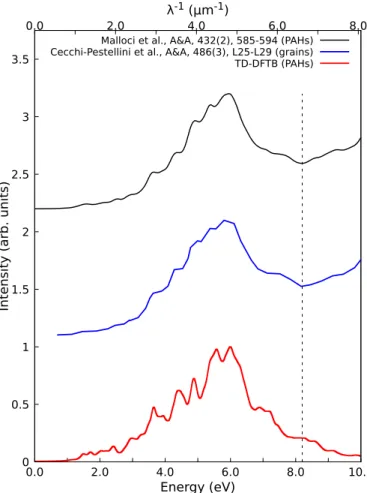
As can be seen in Fig. B.3, similar trends are ob-served for TD-DFTB and TD-DFT spectra up to ∼8.2 eV or 6.6 µm−1. Above this limit, the oscillator strength contin-ues decreasing in the TD-DFTB spectrum while it increases with TD-DFT (Malloci et al. 2007a). This difference can be explained by the intrinsic approximation of the DFTB ap-proach which relies on a confined minimal valence basis set. The TD-DFTB method thus clearly lacks a description of Rydberg orbitals that would be needed to properly account for higher-energy transitions above 8.2 eV.
Appendix B.3: Reduction of the TD-DFTB linear response matrix
To reduce the computational cost and enable thousands of structures to be processed, the TD-DFTB linear response matrix was truncated following the procedure detailed here-after. In our case, the initial linear response matrix is a square matrix whose dimension is equal to the square of the number of occupied orbitals multiplied by the number of unoccupied orbitals. For instance, in the case of C60, the size of the LR matrix amounts to 14400×14400. Due to the computational cost of the diagonalization procedure of the full LR matrix, a reduced matrix was considered
0 0.5 1 1.5 2 2.5 3 3.5 0.0 2.0 4.0 6.0 8.0 10.0 0.0 2.0 4.0 6.0 8.0
Intensity (arb. units)
Energy (eV) λ-1 (µm-1)
Malloci et al., A&A, 432(2), 585-594 (PAHs) Cecchi-Pestellini et al., A&A, 486(3), L25-L29 (grains) TD-DFTB (PAHs)
Fig. B.3: Comparison of optical spectra for the set of 40 PAH molecules investigated by Malloci et al. (2007a). The red curve corresponds to the average spectrum computed at the TD-DFTB (reduced matrix) level using the same procedure as Malloci et al. (2007a), and the FWHM of each individual band is 0.2 eV. The blue curve corresponds to the optical absorption of small PAH grains determined by Cecchi-Pestellini et al. (2008). The black curve corresponds to the average spectrum of the set of 40 PAHs computed by Malloci et al. (2007a) at the TD-LDA level. The red and black curves were normalized as proposed by Malloci et al. (2007a).
by conserving only lower-energy single-particle excitations. Typically, we eliminate single particules excitations with energies larger than 24 eV. This choice for the size of the re-sponse matrix offers a good compromise between accuracy and computational cost. One has to be aware that truncat-ing the linear response matrix in this way, introduces signif-icant errors for the computed high energy excitations but poorly affects the low energy excitations. We checked the validity of the approximation by insuring that the spectra were hardly modified after truncating the LR matrix (see Fig. B.4 for instance).
Appendix C: Complementary data
Appendix C.1: Data related to computed optical spectra
Table C.1 gives the main spectral features (positions and widths) of the average absorption band obtained for the four families and the three cluster sizes, as shown in Fig. 2.
0 50 100 150 200 250 300 350 400 0.0 2.0 4.0 6.0 8.0 0.0 2.0 4.0 6.0 Buckminsterfullerene Intensity (eV -1) Energy (eV) λ-1 (µm-1) TD-DFT, BLYP/pc-2 TD-DFTB, complete LR-matrix TD-DFTB, reduced LR-matrix
Fig. B.4: Optical absorption spectrum of C60 buckminster-fullerene computed using TD-DFT(BLYP/pc-2, 350 roots, red) and TD-DFTB (mio set of parameter, 3000 roots, re-duced (blue) and full (green) LR matrix) approaches. Each individual band of the fullerene was convoluted by a nor-malized Lorentzian function with a FWHM of 0.01 eV, in-tensities are expressed in eV−1.
Appendix C.2: Comparison with experiments
Table C.2 below gives the detailed weights employed to re-produce the experimental and astronomical spectra from the various populations of isomers and the three cluster sizes.
Appendix C.3: Nature of orbitals involved in the electronic transitions
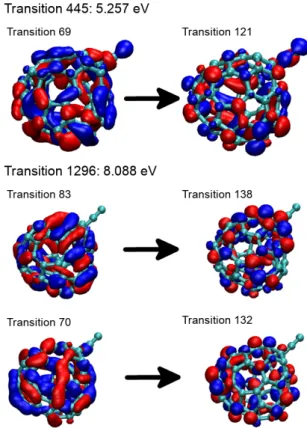
The orbitals involved in transitions at two energies (5.3 and 8.1 eV) for the particular cage isomer of C60 shown in Fig. 1(b) are depicted in Fig. C.1. As shown in the left-hand-side, all depleted orbitals, i.e. orbitals lacking one elec-tron, have a mixed π and σ character. In the right-hand-side, target orbitals carrying one extra electron during the excitation are of π? type.
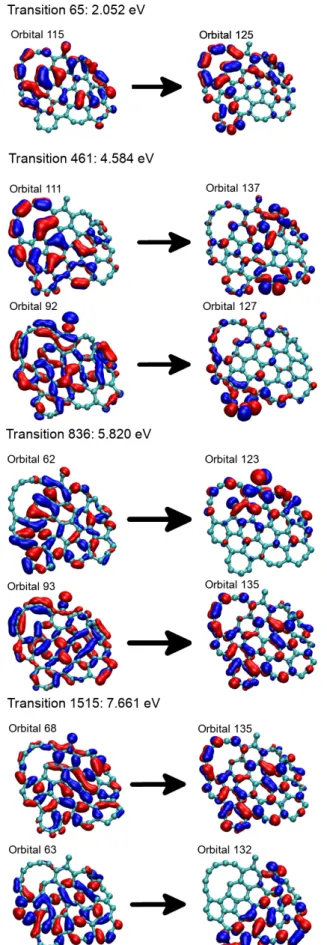
Likewise, the orbitals involved in transitions at various energies (2.1, 4.6, 5.8 and 7.7 eV) for the specific flake isomer of C60 in Fig. 1(b) are represented in Fig. C.2. Here all depleted orbitals are of π character except orbitals 63 and 68 which are of σ type. Target orbitals are all of π? type.
Interestingly, some virtual (target) orbitals such as orbitals 127 and 123 are mostly located at the edges of the flake, highlighting differences with the orbitals involved in the electronic transitions of PAHs where the carbon atoms are bounded to hydrogens.
The orbitals involved in one intense transition at 6.6 eV for the pretzel isomer of C60shown in Fig. 1(b) are depicted
size cages flakes pretzels branched
position width position width position width position width
C60 5.52 1.53 5.74 5.29 7.27 5.99 5.15 5.24
C42 5.49 1.49 6.17 4.71 7.29 7.10 5.71 5.15
C24 8.48 7.01 7.90 5.84 6.80 5.02
Table C.1: Position and width (FWHM) of the average band per size and family of the optical absorption spectra of Cn
clusters shown in Fig. 2. All data are in eV.
system size cages flakes pretzels branched
C60 20% 48% 3% 6% soots C42 5% 10% 1% 1% C24 6% average C60 24% 31% 3% extinction C42 31% 6% 1% curve C24 1% 3%
Table C.2: Weights of the various populations of carbon clusters resulting from the fit reproducing at best experi-mental (soot, HAB=22 mm) and astronomical data (aver-age UV extinction, interstellar dust).
Fig. C.1: Main orbitals involved in transitions at two ener-gies (5.3 and 8.1 eV) for the particular cage isomer of C60 shown in Fig. 1(b). Depleted and target orbitals (occupied and virtual orbitals in the ground state respectively) are shown in the left- and right-hand sides, respectively. in Fig. C.4. For this isomer, the depleted and target orbitals are of π and π? types, respectively.
Finally, the orbitals involved in one intense transition at 4.9 eV for the branched isomer of C60 shown in Fig. 1(b). are represented in Fig. C.4. The depleted and target orbitals are also of π and π? types, respectively.
Fig. C.2: Main orbitals involved in transitions at various energies (2.1, 4.6, 5.8 and 7.7 eV) for the specific flake isomer of C60shown in Fig. 1(b). Depleted and target orbitals are shown in the left- and right-hand sides, respectively.
Fig. C.3: Main orbitals involved in an intense transition at 6.6 eV for the particular pretzel isomer of C60 shown in Fig. 1(b). Depleted and target orbitals are shown in the left- and right-hand sides, respectively.
Fig. C.4: Main orbitals involved in an intense transition at 4.9 eV for the specific branched isomer of C60 shown in Fig. 1(b). Depleted and target orbitals are reported in the left- and right-hand side, respectively.