APPLICATION OF ENSEMBLE-BASED SYSTEMS FOR SNOW-MAPPING
USING NOAA-AVHRR DATA OVER EASTERN CANADA
Sophie Roberge
1, Karem Chokmani
1, and Danielle DeSève
21
Institut National de la Recherche Scientifique – Centre Eau Terre Environnement, 490 rue de la
Couronne, Québec, Québec, G1K 9M4, Canada
2
Institut de Recherche d’Hydro-Québec, 1800 boul. Lionel-Boulet, Varennes, Québec, J3X 1S1, Canada
ABSTRACT
Common operational snow cover products based on optical or passive microwave sensors (IMS, MODIS SNOWMAP, NOAA GOES+SSM/I, etc.) provide maps of the snow cover extent or fractional snow cover maps. These snow cover products do not provide the probability of observing snow and its uncertainty. This information is crucial in the context of forecasting water supplies to support efficient electricity. This study’s objective is to develop probability maps with ensemble-based systems, where probabilities could be used to flag the onset of spring melt. To achieve this, bagging and majority voting were implemented in the snow-mapping procedure using AVHRR-KLM data of Eastern Canada. This consists in generating 100 versions based on a random variation of the six empirical threshold parameters included in the procedure. The probability of a pixel corresponds to the number of times it was identified as snow, no-snow or cloud.
Index Terms – Snow extent; optical sensor; AVHRR; image
classification; ensemble mapping
1. CONTEXT
Snow is an important source of water supply because the melting of the snow that has settled during winter refills the ground-water table and generates spring floods. Following the snow cover extent in the province of Québec (Canada) is of high interest for authorities responsible for the management of water resources, for instance Hydro-Québec,
the main supplier of electricity of the province of Québec [1]. Conventional operational snow cover products based on optical or passive microwave sensors, such as IMS, MODIS SNOWMAP, NOAA GOES+SSM/I, etc., provide binary maps of the snow cover extent (yes/no) or fractional snow cover maps [2]. None of them give the probability of observing the presence of snow and reflecting its uncertainty. Having this kind of information is an asset in the context of forecasting snowmelt water supplies to support efficient electricity production. The present study aims to answer this specific need by developing probability maps that could be used to flag the onset of spring melt. Probability maps are obtained by ensemble-based systems.
Ensemble-based systems allow combination of multiple classifier results to reach a final decision that is presumably the most informed one [3]. Decision-making systems are composed of (1) algorithms for generating the individual components of the ensemble system - the most popular ones being bagging, boosting, Adaboost, stack generalization, and hierarchical mixture-of-experts - and (2) a set of combination rules, including algebraic combination of outputs or voting-based techniques. In this study, bagging and majority voting have been implemented in the snow-mapping procedure we developed over Eastern Canada.
3983
2. METHODOLOGY
The province of Québec (Eastern Canada) is a challenge for mapping the snow cover extent because of the particular snow conditions (a very thick snowpack) and the diversity of vegetation (tundra, taiga, coniferous forests, mixed forest, deciduous forests, wetlands, burns, agricultural and urban zones).
The snow-mapping algorithm developed for this region by [4-6] is made up of six hierarchical thresholds, applied in a sequential way, pixel by pixel, for the identification of snow, no-snow and clouds on 1 km NOAA Advanced Very High Resolution Radiometer (AVHRR) KLM imagery taken during the critical phases of the winter season of each year, over the period from 1988 to 2011; in this study the snowmelt season is from March 16th to May 31st and the onset season is from October 1st to December 31st.
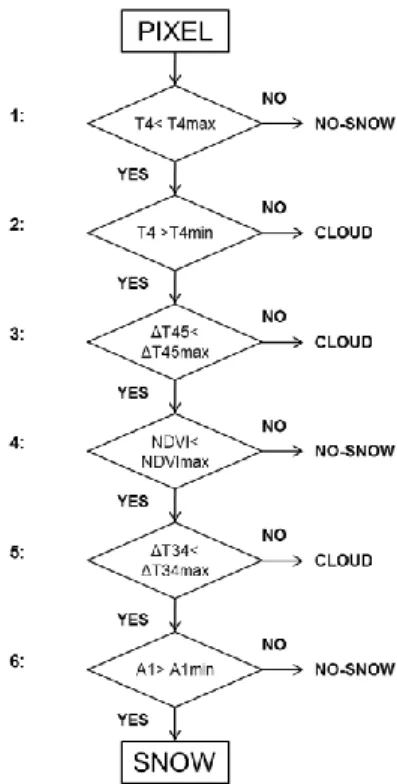
Each pixel of the image is tested according to the following criteria (Figure 1):
1. The pixel has to have a temperature in band 4 (T4) lower than the maximal temperature (T4max) that
snow could have. Otherwise, the pixel is classified as no-snow (warmer than snow);
2. The pixel has to have a temperature in band 4 (T4) higher than the minimal temperature (T4min) that
snow could have. Otherwise, the pixel is classified as cloud (colder than snow);
3. The pixel has to have a thermal difference between bands 4 and 5 (ΔT45) lower than the maximal value (ΔT45max) a thin ice cloud cover could have.
This threshold has been set to 2°K. Otherwise, the pixel is classified as cloud;
4. The pixel has to have a NDVI value (NDVI=(A1-A2)/(A1+A2)) lower than the maximum value (NDVImax) that snow could have. Otherwise, the
pixel is classifed as no-snow;
5. The pixel has to have a thermal difference between bands 3 and 4 (ΔT34) lower than the maximal value (ΔT34max) that snow could have. Otherwise
the pixel is classified as cloud;
6. The pixel has to have a reflectance value in band 1 (A1) higher than the minimal reflectance (A1min)
that snow could have. Otherwise, the pixel is classified as no-snow.
The pixel that manages to get through the six thresholds is then classified as snow.
Figure 1. Snow-mapping classification procedure
Threshold parameters have been calibrated on a regional basis, no distinction based on land use has been made. Threshold parameters vary depending on the acquisition date of the AVHRR-KLM imagery. This takes into account the temporal evolution of the physical state of the snow cover during the winter season.
In this study, the diversity of classifiers included in the ensemble is created with a bagging procedure. This consists
in generating 100 versions (maps) based on a random variation of the empirical threshold parameters and the calibration dataset included in the snow-mapping algorithm. The probability of a pixel to be considered as snow, no-snow or cloud corresponds to the number of times it was identified as such. The label of the pixel corresponds to the class having received the largest number of votes (majority voting rule).
The ensemble snow-mapping algorithm maps have been validated with two ground snow cover observation networks. The first one is a selection of 20 meteorological stations (owned by Environment Canada) covering the study area, measuring snow depth on a daily basis since 1988 or earlier. This dataset evaluates the performance of the snow-mapping algorithm on a regional scale (i.e. province of Québec). The second one is a set of seven GMON (Gamma MONitor) stations (owned by Hydro-Québec), located in the Saint-Maurice River watershed since 2007. GMONs measure snow water equivalence every 6h. This dataset evaluates the performance of the snow-mapping algorithm on a local scale, in dense forest. The ensemble approach is also compared to the classic approach (i.e. no variation of threshold parameters).
3. RESULTS AND DISCUSSION
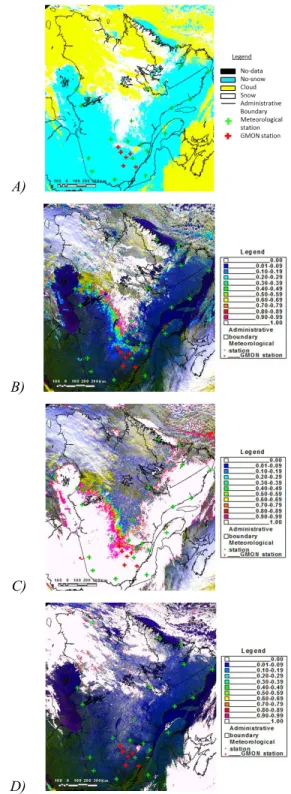
A classic map and probability maps generated by the ensemble system are shown in Figure 2.
The ensemble approach shows a performance lower than what is observed for the classic approach. The overall rate of success is 98% for the classic approach. The rate of success for snow is 95%; however, this rate reaches 79% in the Saint-Maurice River boreal forest [6]. Meanwhile, the overall rate of success is 92% for the ensemble approach. The rate of success for snow is 83%; however, this rate reaches 53% in the Saint-Maurice River boreal forest, which is 26% less than the classic approach [6].
A)
B)
C)
D)
Figure 2. Snow cover map over Eastern Canada, November 10th, 2010. A) Classic map, B) Snow, C) No-Snow and D) Cloud probability maps generated by the ensemble snow-mapping algorithm (the 0 probability is shown with no opacity; for instance the AVHRR-KLM channels 1, 2, 3 in RGB is displayed in background)
The weaker performance of the ensemble approach in the boreal forest can be explained by the fact that empirical thresholds of the snow-mapping algorithm were calculated on historical conditions without making any distinction between land uses or weather conditions over the targeted years. Also, the way of calibrating the empirical thresholds can be another explanation of snow omission in some regions; for instance, most omitted snow occurs in the boreal forest in southern Québec. It is possible for snow to have higher temperatures, higher NDVI values and lower reflectances in the boreal forest than what is observed in other regions. Snow omission is amplified much more by the ensemble because of the displacement of thresholds used for the identification of snow, no-snow and clouds on AVHRR-KLM imagery; threshold parameters are computed from snow radiometric properties.
In conclusion, ensemble-based systems are a promising avenue in snow-mapping because they present the probability of observing snow cover on every point of the territory by using multiple classifiers. More work is planned in the future to improve the snow-mapping itself, by redefining its thresholds according to major land uses and air temperature, and by exploring other possibilities of ensemble-based systems to produce a unique enhanced snow cover product.
4. ACKNOWLEDGEMENTS
The authors would like to thank Mitacs and the Institut de
Recherche d’Hydro-Québec for their financial support.
5. REFERENCES
[1] D. De Sève, F. Vachon, and Y. Choquette, "A dynamic algorithm for mapping of snow cover using SSMI data," in IEEE International
Geosciences and Remote Sensing Symposium (IGARSS), 2012, pp. 4875-4878.
[2] A. J. Dietz, C. Kuenzer, U. Gessner, and S. Dech, "Remote sensing of snow - a review of available methods," International Journal of Remote
Sensing, vol. 33, pp. 4094-4134, 2012.
[3] R. Polikar, "Ensemble based systems in decision making," IEEE Circuits and Systems Magazine, vol. 6, pp. 21-44, 2006.
[4] K. Chokmani, M. Bernier, L. M. Paquet, K. Dever, Y. Gauthier, and A. Royer, "Snow mapping over Eastern Canada for climate change studies purpose using historical NOAA-AVHRR and SSM/I data," in IEEE International Geosciences and Remote
Sensing Symposium (IGARSS), 2006, pp. 747-750.
[5] K. Chokmani, M. Bernier, L.-M. Pâquet, K. Goïta, A. Royer, F. Comtois-Boutet, et al.,
"Développement d'algorithmes pour le suivi par satellite de la couverture de neige au sol à l'échelle du bassin versant (rapport R1103)," Institut National de la Recherche Scientifique - Centre Eau Terre et Environnement, Québec, 2009.
[6] S. Roberge, "Développement d'un algorithme satellitaire à seuils évolutifs pour le suivi de l'étendue spatiale du couvert nival adapté aux conditions régionales du Québec et du Labrador et son adaptation à l'estimation d'ensemble," Mémoire de maîtrise, Institut National de la Recherche Scientifique - Centre Eau Terre et Environnement, Québec, 2013.