HAL Id: hal-02119834
https://hal.archives-ouvertes.fr/hal-02119834
Submitted on 6 May 2020HAL is a multi-disciplinary open access archive for the deposit and dissemination of sci-entific research documents, whether they are pub-lished or not. The documents may come from teaching and research institutions in France or abroad, or from public or private research centers.
L’archive ouverte pluridisciplinaire HAL, est destinée au dépôt et à la diffusion de documents scientifiques de niveau recherche, publiés ou non, émanant des établissements d’enseignement et de recherche français ou étrangers, des laboratoires publics ou privés.
Blinded evaluation of cathepsin S inhibitors from the
D3RGC3 dataset using molecular docking and free
energy calculations
Ludovic Chaput, Edithe Selwa, Eddy Elisée, Bogdan Iorga
To cite this version:
Ludovic Chaput, Edithe Selwa, Eddy Elisée, Bogdan Iorga. Blinded evaluation of cathepsin S in-hibitors from the D3RGC3 dataset using molecular docking and free energy calculations. Journal of Computer-Aided Molecular Design, Springer Verlag, 2019, 33 (1), pp.93-103. �10.1007/s10822-018-0161-7�. �hal-02119834�
Blinded evaluation of cathepsin S inhibitors from the
D3RGC3 dataset using molecular docking and free
energy calculations
Ludovic Chaput,1,2,‡ Edithe Selwa,1,‡ Eddy Elisée,1,‡ Bogdan I. Iorga1,*
1 Institut de Chimie des Substances Naturelles, CNRS UPR 2301, LabEx LERMIT, 91198
Gif-sur-Yvette, France
2 Department of Nephrology and Dialysis, AP-HP, Tenon Hospital, INSERM UMR_S 1155,
75020 Paris, France
Corresponding Author
* Phone: +33 1 6982 3094; Fax: +33 1 6907 7247; Email: bogdan.iorga@cnrs.fr (B.I.I.).
Author Contributions
‡ These authors contributed equally.
Manuscript Click here to access/download;Manuscript;D3RGC3-paper-JCAMD-v3-revision-formatted.docx
KEYWORDS: docking ; ranking ; scoring function ; free energy calculations ; Gold ; Vina ; Glide ; Gromacs ; PMX ; cathepsin S inhibitors ; D3R ; Drug Design Data Resource ; Grand Challenge 3 ; D3RGC3
ABSTRACT
During the last few years, we have developed a docking protocol involving two steps: i) the choice of the most appropriate docking software and parameters for the system of interest using structural and functional information available in public databases (PDB, ChEMBL, PubChem Assay, BindingDB, etc.); ii) the docking of ligand dataset to provide a prediction for the binding modes and ranking of ligands. We applied this protocol to the D3R Grand Challenge 3 dataset containing cathepsin S (CatS) inhibitors. Considering the size and conformational flexibility of ligands, the docking calculations afforded reasonable overall pose predictions, which are however dependent on the specific nature of each ligand. As expected, the correct ranking of docking poses is still challenging. Post-processing of docking poses with molecular dynamics simulations in explicit solvent provided a significantly better prediction, whereas free energy calculations on a subset of compounds brought no significant improvement in the ranking prediction compared with the direct ranking obtained from the scoring function.
INTRODUCTION
Drug Design Data Resource (D3R, https://drugdesigndata.org/) organizes, on a regular basis, blinded prediction challenges with the aim to evaluate the performance of tools and protocols that are used in real-life computer-aided drug discovery projects. To achieve this, datasets presenting different levels of difficulty are presented to the community, which is asked to predict, in “blind” conditions, the binding modes and the relative affinities of compounds.
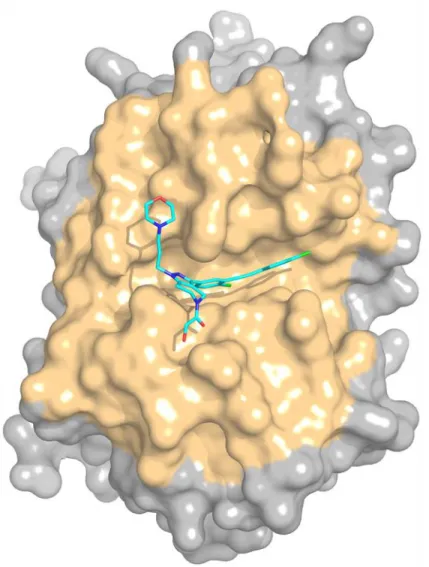
The D3R Grand Challenge 3, which was held in 2017, was focused on a single protein, cathepsin S (CatS, Figure 1), a target with multiple potential applications that has received much attention during the recent years [1-5].
Figure 1. Solid surface representation of a representative crystal structure of cathepsin S (PDB
code 3IEJ) with the ligand 599 in stick representation. The binding site, as defined for our docking studies, is colored in yellow, and the ligand is colored in cyan.
In Phase 1A the participants were asked to predict the crystallographic poses of 24 CatS ligands, the affinity ranking for 136 CatS ligands and the relative binding affinities for a designated free energy subset of 33 compounds. In phase 1B, the organizers released the corresponding receptor structures for the 24 CatS ligands, and asked to predict the crystallographic poses using the released receptor structures. In Phase 2 the participants were required to provide the same affinity predictions for the subset of 136 ligands and relative free
energy for the subset of 33 compounds as in Phase 1, but taking into account the additional structural data (24 new protein-ligand complexes) released at the end of Phase 1B. The CatS dataset containing the 136 ligands used for ranking prediction can be found in the Electronic Supplementary Material (Figure S3).
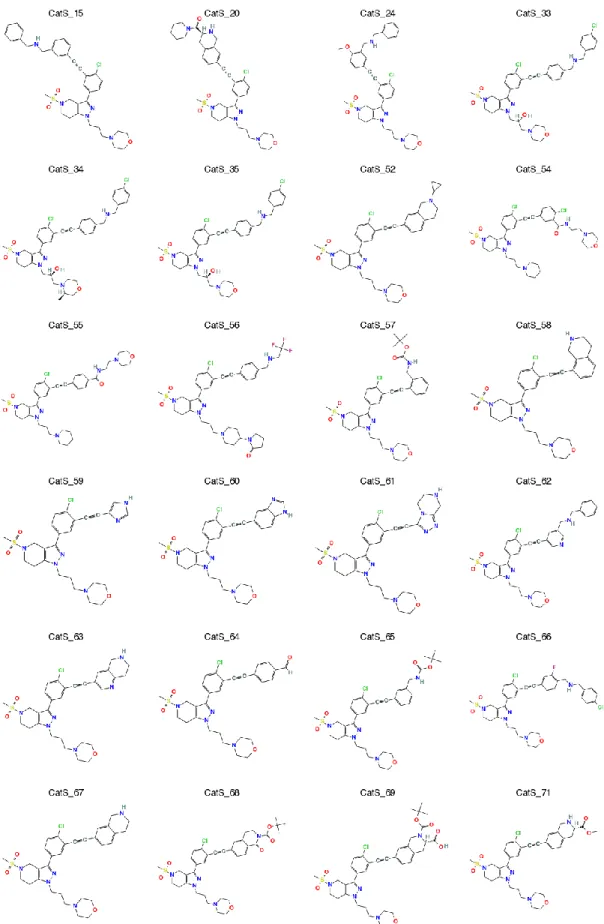
Figure 2 shows the chemical structures of the 24 compounds from CatS dataset for which the pose predictions were required. Additionally, the participants were asked to predict the relative affinities for one homogeneous subset of compounds that is suited for free energy calculations. The structures of the 33 CatS inhibitors included in the free energy subset are presented in Figure 3.
Figure 3. Chemical structures of the 33 CatS ligands included in the free energy set (continued).
METHODS
Protein structures. We found 38 crystal structures of CatS available in the Protein Data Bank
(PDB) [6] from which 31 were human CatS and 7 were mouse CatS (see Table S1 in the Electronic Supplementary Material for the complete list). These structures were superposed, showing no conformational variability for the backbone and for most sidechains. The only exceptions were the sidechains of residues Lys64, Arg141 and Asn161, which are very flexible, adopting multiple conformations, and of residues Phe146 and Phe211, which adopt two major
orientations each. The residues Lys64 and Arg141 are relatively far from the binding site and therefore their flexibility was not taken into account for the docking process. In these conditions, we generated four representative conformations of CatS (named CatS_conf1 to CatS_conf4) starting from the structure 1GLO (apo) and adjusting the orientations of Phe146 and Phe211. These conformers, with the ions and solvent molecules manually removed, were superimposed on the reference structure CatS (containing the SO4 ion) provided by the D3R Grand Challenge 3 organizers, in order to conserve the same coordinate system through the whole process. Hydrogen atoms were added using Hermes, the graphical interface of Gold v5.2.2 software [7], or with Maestro, the graphical interface of Schrödinger software (http://www.schrodinger.com), prior to docking.
Ligands. A training set of CatS ligands was constituted by gathering from ChEMBL, PubChem
Assay and BindingDB databases the compounds with known activity (IC50) for CatS (1591 unique compounds). The structures of these compounds were retrieved in SMILES format and were converted into three-dimensional MOL2 files using Ligprep v37014 (Schrödinger, http://www.schrodinger.com). The same conversion from SMILES into MOL2 formats was applied to the D3RGC3 dataset of CatS inhibitors provided by organizers. In all cases, the protonation state for the compounds was adjusted at physiological pH using LigPrep (Schrödinger, http://www.schrodinger.com).
Preliminary docking. In the preliminary analysis step, several docking software and scoring
functions have been tested for their ability to predict relative affinity ranking and reproduce the protein-ligand complexes: Gold [7] with the GoldScore, ChemScore, ChemPLP and ASP scoring functions, Vina [8] and Glide (Schrödinger, http://www.schrodinger.com). Default parameters were used in all cases for docking, except with Gold, where a search efficiency of 200% was
used in order to better explore the conformational space. For Glide, the standard precision (SP) mode was used. The binding sites were considered with Gold as spheres with a 20 Å radius around a virtual point with coordinates (-7,12,-8). With Vina, the binding sites were defined as a 25 x 25 x 25 Å3 cube centered on the same virtual point. With Glide, the binding site was defined
with a inner box of 13 x 12 x 13 Å3 and an outer box of 30 x 29 x 30 Å3. Glide attempts to
position the ligand center within the inner box volume, while the outer box is defined to contain all the ligand atoms. The docking calculations were carried out with the four CatS conformers described above and with the two structures (containing a DMSO molecule and a SO4 ion, respectively) provided by the organizers. All structures were rigid during the docking process. Ten docking poses were generated for each ligand from the training set and from the CatS D3RGC3 dataset.
Phase 1A docking. From the preliminary analysis, Gold with the ASP scoring function were
identified as the most adapted for the given system, and therefore were used for Phase 1 predictions. The conformation CatS_conf4 gave the best results in the preliminary docking step (data not shown) and was used for the docking of most compounds from the CatS D3RGC3 dataset. Notable exceptions are: i) for compounds CatS_4 and CatS_6, which contain a different scaffold, the structure 3MPF was used; ii) for compound CatS_14, the structure provided by organizers containing the DMSO molecule was used; iii) for compounds CatS_2, CatS_17, CatS_20, CatS_22, CatS_23 and CatS_24, the structure provided by organizers containing the SO4 ion was used. The two flip/flop forms of the amide side chain from Asn161 were considered, and then best pose (in terms of score or RMSD) selected. The same Gold docking parameters as described above were used, except that 100 docking poses were generated for each ligand. In the post-docking processing procedure, docking complexes were used as input
structures for 10 ns molecular dynamics simulations in explicit solvent using Gromacs and AMBER 99SB force field. During the simulation, constraints were applied on the protein backbone and on the ligand core fragment that was also constrained during docking. The first 1ns was discarded and the remaining snapshots clusterized (using the g_cluster tool available in Gromacs) in order to provide a single cluster. The representative structure of this cluster was selected for submission (1 structure per compound).
Phase 1B docking. After the release of the 24 crystal structures corresponding to the
compounds CatS_1 to CatS_24 (but without the coordinates of the ligands), we carried out docking calculations for each of these structures with its native ligand using the same conditions as in Phase 1A (Gold with the ASP scoring function, 100 docking poses generated for each ligand).
Phase 2 docking. Our experience from Phase 1A using Gold/ASP with scaffold match
constraints showed that the atoms with constraints applied were not always well aligned with the reference structure, even when very strong constraints are used (increase of the weight parameter, that determines how closely ligand atoms fit onto the scaffold, up to 2000). Therefore, in Phase 2 we used the Glide/SP protocol described above, with the exception of scaffold constraints that were applied on the common substructure of ligands with either CatS_15, CatS_20 or CatS_24. The best Glide/SP docking scores were selected for Phase 2 ranking prediction submission (1 per compound). The related docking poses for the 33 CatS compounds from the free energy dataset were used as the starting points for following free energy calculations.
Free energy calculations. The complexes selected in the previous step represented the input for
relative alchemical free energies calculations, using the protocol described in a previous study [9]. Hybrid structures and topologies were built using a modified version of the MOL2FF package developed in our team. CatS_67 was used as reference structure for the free energy calculations. Briefly, equilibrium 10 ns MD simulations were performed for the two states (corresponding to lambda 0 and 1), using Gromacs [10] and OPLS-AA force field [11,12]. Snapshots from the equilibrium runs were extracted to spawn 100 simulations of 50 ps each to alchemically morph between the two states of the system. The work values over every non-equilibrium transition were extracted using some scripts from the PMX software [13-15] in order to estimate the free energy differences relying on the Crooks Fluctuation Theorem and utilizing Crooks-Gaussian Intersection as estimator. As described previously [9], when the two ligands considered for the alchemical transformation had the same charge, separate calculations in explicit solvent were carried out for the transformation of the protein-ligand complex and of the ligand alone. The relative free energy of binding is then calculated as the difference between the corresponding work for these two transformations. When the two ligands had different charges, a single box containing the protein-ligand complex and the ligand alone, separated by 30 Å, was used. The ligand from the complex was converted in one direction, whereas the ligand alone was converted simultaneously in the opposite direction. Thus, the overall charge of the system is conserved during the whole simulation, and the global work for this system represents the relative free energy of binding between ligands.
Submission preparation. Protein structures were converted into PDB format for submission
CORINA v3.60 (http://www.molecular-networks.com/), as the MOL format corresponds to the SDF output format in CORINA.
Graphics. Chemical structures were depicted using CACTVS Chemoinformatics Toolkit
v3.409 (Xemistry, http://www.xemistry.com/), images for protein structures were generated using PyMol 1.8.1 (Schrödinger, http://www.pymol.org/).
Statistics. Statistics were computed using the R-package (http://www.r-project.org).
Chemoinformatics. Tanimoto similarities were computed using Canvas (Schrödinger).
RESULTS AND DISCUSSION
During the last years we developed a protocol for docking and virtual screening that proved to be relatively successful in our participation to different blind prediction challenges: SAMPL3 (2011) [17], SAMPL4 (2013) [18], CSAR (2014) [19], D3R Grand Challenge (2015) [20] and D3R Grand Challenge 2 (2016) [9]. This protocol involves two steps, the first one representing a preliminary analysis of publicly available structural and biochemical data in order to identify the most appropriate docking software and scoring function for the system of interest. In the second step, we use these parameters for the prediction of binding modes (pose prediction) and of relative affinities of ligands (scoring). Enhanced genetic algorithm parameters for docking (a search efficiency of 200%) proved to be beneficial in our previous studies [17-20,9], especially for big and flexible ligands. Therefore, the same parameters were used in this work to explore as exhaustively as possible the docking conformations of ligands from the CatS D3RGC3 dataset.
The superposition of the 38 crystal structures of CatS identified in the PDB (Table S1) showed very little conformational variability on backbone and on most side chains, with the exception of a few residues shown in Figure 4. Among these structures, 19 contain a ligand in the active site, and 4 of these ligands (599, 23Z, N2A and N2D from the structures 3IEJ, 3KWN, 3MPE and 3MPF, respectively) share a common scaffold with some compounds from the CatS D3RGC3 dataset. The three-dimensional structure of protein in these structures is well conserved, with the exception of two side chains of Phe211 and Phe146 that adopted alternative orientations, as found in 3 representative structures (PDB codes 2F1G, 3N4C, 3MPF). Therefore, we used an apo structure of CatS (PDB code 1GLO) to build 4 conformers, representing the four combinations of representative conformations for Phe211 and Phe146 side chains. In addition, 2 structures (containing a DMSO molecule and a SO4 ion) were provided by the D3RGC3 organizers to take into account specific ligand-DMSO or ligand-SO4 interactions. These six structures were used in the preliminary docking calculations.
Figure 4. All 38 CatS structures available in the PDB superimposed (cartoon representation).
Flexible residues are shown as sticks.
A training set containing 1591 unique CatS ligands (known IC50) was created with data from ChEMBL, PubChem Assay and BindingDB databases and used to assess the performance of
different docking software in terms of pose prediction and relative ranking of docking poses: Gold with the GoldScore, ChemScore, ChemPLP and ASP scoring functions, Vina and Glide.
The analysis of the docking results showed that no docking program was able to provide a good prediction for the relative affinity ranking. The Spearman’s and Kendall’s correlation coefficients between docking scores and pIC50 values of ligands from the training set are reported in Table S2.
Surprisingly, the Spearman’s and Kendall’s correlation coefficients (Table S2) seem to indicate in some cases an anti-correlation between docking scores and pIC50. Indeed, the scatter plot Score versus pIC50 (Figure S2) seems to indicate the existence of two clusters of compounds (two distinct clouds of points). To investigate this observation, we calculated the distance matrix between the compounds from the training set, based on the molprint 2D descriptor, the Tanimoto distance (Canvas, Schrödinger), and a hierarchical cluster analysis (R). These results highlighted the existence of a large cluster of compounds (colored in blue) that tend to have favorable docking scores despite low to moderate pIC50 (Figures S1 and S2, red/blue dendrogram and scatterplot). This blue cluster can explain in part some anti-correlations observed between the docking scores and pIC50 values (Table S2). Further calculation of Tanimoto distances between the compounds from the CatS D3RGC3 and the training set identified 292 compounds with a Tanimoto score >0.5 compared with at least one of the 141 CatS D3RGC3 compounds, and all these compounds belong to the blue cluster (Figures S1 and S2). The Spearman’s and Kendall’s correlation coefficients for the 292 compounds from the blue cluster (Table S2) show that Vina provided the best results, with correlation coefficients between 0.29 and 0.47 (Spearman’s) and between 0.21 and 0.34 (Kendall’s), depending on the CatS
conformation used for docking. Other docking programs and scoring functions did not provide good correlations for the 292 compounds from the blue cluster.
The ability of the docking programs to reproduce crystallographic poses was also evaluated. The 141 compounds from the D3RGC3 CatS dataset were docked on the four representative CatS conformations using different docking software and scoring function combinations and the RMSD were calculated between the common substructure of these compounds with the ligand 599 from the structure 3IEJ (Figure 5). The mean RMSD values for the 141 compounds from the D3RGC3 CatS dataset are reported in the Table 1, showing that Gold with the ASP scoring function clearly outperformed the other docking programs and scoring functions for all the 4 CatS conformers, with mean RMSD values between 2 and 3 Å. In these conditions, Gold with the ASP scoring function and the CatS_conf4 structure were selected for the next step.
Figure 5. a) Ligand 599 in the active site of cathepsin S (crystal structure, PDB code 3IEJ); b)
Chemical structure of ligand 599. The common substructure of this ligand with the compounds from CatS D3RGC3 dataset is represented in sticks (a) and colored in blue (b).
Table 1. Analysis of preliminary docking poses for the 141 compounds from the CatS dataset
using four representative conformations of CatS. For all 10 docking poses of each ligand, RMSD values (Å) were calculated using the common substructure between the ligand and compound 599 (see Figure 5). The best RMSD value for each ligand was retained and the overall mean values are shown below.
CatS_conf1 CatS_conf2 CatS_conf3 CatS_conf4
Gold/Goldscore 4.32 4.72 5.09 4.07 Gold/Chemscore 3.40 3.54 3.46 3.36 Gold/ASP 2.52 2.69 2.91 2.59 Gold/ChemPLP 3.55 4.00 3.98 3.56 Glide/SP 3.19 4.86 4.64 3.40 Vina 3.18 5.78 5.63 3.37
Pose prediction and scoring (Phase 1A)
The 141 CatS ligands were docked with Gold and the ASP scoring function, generating 100 poses for each ligand. The CatS_conf4 conformer was used for docking the vast majority of compounds, with some exceptions (see the Methods section for details).
Three versions of the protocol were tested: i) one without any constraints; ii) one with constraints on the common substructure between the ligand and one of PDB ligands 599, 23Z and N2A and iii) one with the same constraints as above, followed by a 10 ns molecular
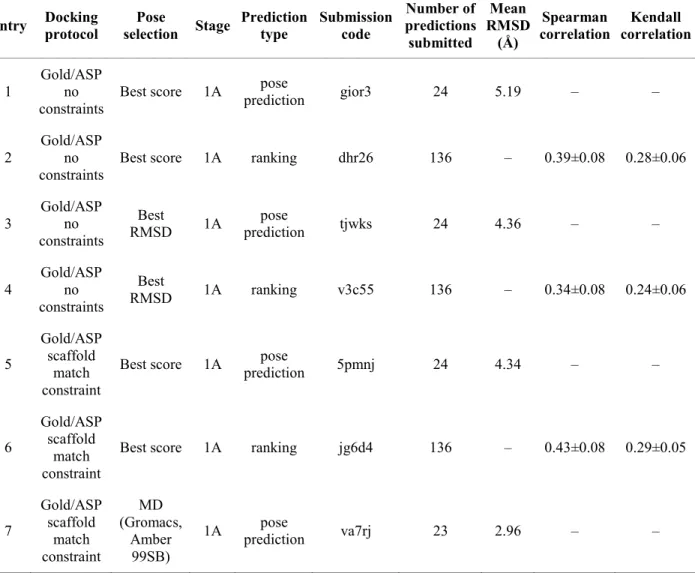
dynamics simulation in explicit solvent. The details of all submissions are presented in Table 2. The “best RMSD” submission without constraints (entry 3) and the “best score” submission with constraints (entry 5) provided similar performances (RMSD of 4.36 Å and 4.34 Å, respectively). The post-processing of docking poses with molecular dynamics (MD) simulations (entry 7) clearly improved the quality of the prediction (RMSD of 2.96 Å). Thus, it seems that such MD simulations are beneficial for a better positioning of flexible substituents.
Table 2. Overview of all predictions submitted and their performance (see the Electronic
Supplementary Material for the plots corresponding to these results).
Entry Docking protocol selection Pose Stage Prediction type Submission code Number of predictions submitted Mean RMSD (Å) Spearman correlation Kendall correlation 1 Gold/ASP no
constraints Best score 1A
pose
prediction gior3 24 5.19 – –
2 Gold/ASP no
constraints Best score 1A ranking dhr26 136 – 0.39±0.08 0.28±0.06 3 Gold/ASP no constraints Best RMSD 1A pose prediction tjwks 24 4.36 – – 4 Gold/ASP no constraints Best RMSD 1A ranking v3c55 136 – 0.34±0.08 0.24±0.06 5 Gold/ASP scaffold match constraint
Best score 1A prediction pose 5pmnj 24 4.34 – –
6
Gold/ASP scaffold
match constraint
Best score 1A ranking jg6d4 136 – 0.43±0.08 0.29±0.05
7 Gold/ASP scaffold match constraint MD (Gromacs, Amber 99SB)
8
Vina no constraints
Best score 1A ranking – – – 0.42 0.29
9 Gold/ASP no constraints
Best score 1B prediction pose 8wv4r 24 8.49 – –
10 Gold/ASP no constraints
Best
RMSD 1B prediction pose 8byha 24 3.95 – –
11
Glide/SP scaffold
match constraint
Best score 2 ranking 87q5m 33 – 0.34±0.18 0.20±0.14
12
Glide/SP scaffold
match constraint
Best score 2 free energy ranking js3r3 33 — 0.35±0.17 0.25±0.12
The performance of pose prediction is variable within the dataset, depending on the nature of the ligand, as shown in Figure 6. When only half of the ligand structure is correctly positioned (a), very high RMSD values are obtained, but when the core of the ligand is correctly positioned (b and c), moderate to very good RMSD values can be expected.
Figure 6. Comparison of our Phase 1A best ranking poses without constraints (submission
“gior3”, cyan) with the corresponding crystal structure conformations (magenta) for compounds CatS_7 (a, RMSD 7.84 Å), CatS_17 (b, RMSD 4.33 Å) and CatS_20 (c, RMSD 1.03 Å).
Pose prediction (Phase 1B)
In Phase 1B, we carried out docking calculations using the 24 crystal structures corresponding to the compounds CatS_1 to CatS_24 that were released at the end of Phase 1A (but without the coordinates of the ligands) with their native ligands. The results from Table 2 (entries 9 and 10) show that the re-docking of ligands into their native structures provided only a slight improvement in the pose prediction for the “best RMSD” submission (from 4.36 Å to 3.95 Å) and a very bad pose prediction for the “best score” submission (8.49 Å instead of 5.19 Å).
Scoring and free energy calculations (Phase 2)
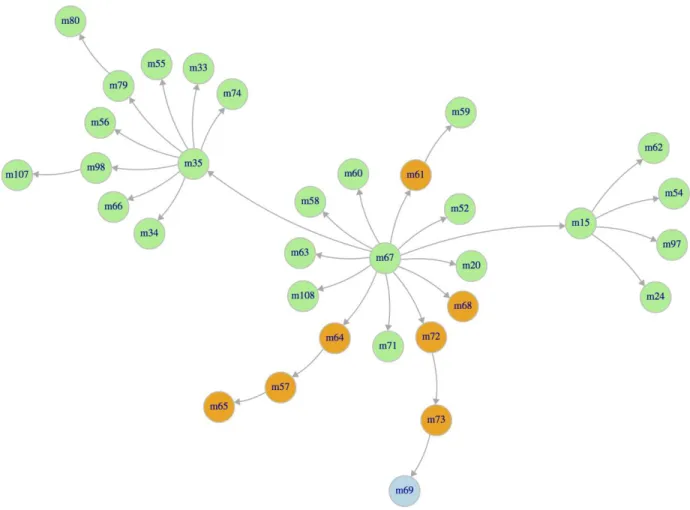
In phase 2, we only predicted the relative ranking for the 33 compounds of the free energy set (Table 2, entries 11 and 12). We used the Glide/SP protocol with scaffold constraints applied on the common substructure of ligands with either CatS_15, CatS_20 or CatS_24. The poses with the best docking score (1 pose per compound) were submitted for Phase 2 ranking prediction. The same CatS complexes were also used for relative free energy calculations, which were carried out using a protocol described in a previous paper [9]. The compound CatS_67 was used as reference, and the calculations were designed in order to minimize the transformations involving a change in the global charge of the ligand (Figure 7). Our previous study [9] has highlighted some potential OPLS-AA force field issues involving non-optimal dihedrals
associated with the sulfonamide group that are now fixed (manuscript in preparation), the simulations from this study using optimal parameters.
Figure 7. Diagram showing the pathways used for relative free energy calculations. The
molecule (m) number corresponds to the CatS compounds numbering in the free energy dataset (see Figure 3). The compounds highlighted in green, orange and blue are positively charged, neutral and negatively charged, respectively.
The correlation coefficients obtained in Phase 2 are not as good as those obtained in Phase 1A, indicating that Glide is not performing well in ranking the poses from this free energy subset (Table 2, entry 11). Similarly, the free energy calculations do not improve the quality of the
ranking prediction compared with the direct ranking prediction from the scoring function (Table 2, entry 12). However, much better results are obtained when considering only the co-crystallized ligands (RMSEc of 0.32±0.24 kcal/mol, Kendall’s τ of 1.0±0.47, Spearman’s ρ of 1.0±0.49, Pearson’s r of 0.83±0.49), indicating a possible bad positioning of the peripheral groups that may affect the correct ranking of the compounds.
CONCLUSIONS
In this challenge we used a protocol involving an initial assessment of the most appropriate docking software and parameters using structural and functional information available in public databases followed by the docking of a CatS inhibitors dataset to provide a prediction for the binding modes and ranking of ligands. The size and conformational flexibility of ligands were important factors to take into account, and the docking calculations afforded reasonable overall pose predictions, which are however dependent on the specific nature of each ligand. In general, the rigid core of the ligands was well positioned, but the conformation of the flexible substituents was more difficult to predict, in spite of the high value of search efficiency used in the docking process. As we also observed during the previous D3R challenges, the correct ranking of docking poses is still a problematic issue. Post-processing of docking poses with molecular dynamics simulations in explicit solvent can significantly improve the prediction. No significant improvement in the ranking prediction, compared with the direct ranking obtained from the scoring function, was provided by free energy calculations.
Electronic Supplementary Material. The Electronic Supplementary Material contains the list
of CatS crystal structures from the PDB, the chemical structures of the scoring CatS D3RGC3 dataset, and the plots showing the performance of our submissions.
Acknowledgments. We thank Prof. Bert de Groot for helpful discussions. This work was
supported by the Laboratory of Excellence in Research on Medication and Innovative Therapeutics (LERMIT) [grant number ANR-10-LABX-33], by the JPIAMR transnational project DesInMBL [grant number ANR-14-JAMR-0002] and by the Région Ile-de-France (DIM Malinf).
REFERENCES
1. Thurmond RL, Sun S, Karlsson L, Edwards JP (2005) Cathepsin S inhibitors as novel immunomodulators. Current opinion in investigational drugs (London, England : 2000) 6 (5):473-482
2. Link JO, Zipfel S (2006) Advances in cathepsin S inhibitor design. Current opinion in drug discovery & development 9 (4):471-482
3. Wiener JJ, Sun S, Thurmond RL (2010) Recent advances in the design of cathepsin S inhibitors. Current topics in medicinal chemistry 10 (7):717-732
4. Lee-Dutra A, Wiener DK, Sun S (2011) Cathepsin S inhibitors: 2004-2010. Expert Opin Ther Pat 21 (3):311-337. doi:10.1517/13543776.2011.553800
5. Wilkinson RD, Williams R, Scott CJ, Burden RE (2015) Cathepsin S: therapeutic, diagnostic, and prognostic potential. Biological chemistry 396 (8):867-882. doi:10.1515/hsz-2015-0114 6. Berman HM, Westbrook J, Feng Z, Gilliland G, Bhat TN, Weissig H, Shindyalov IN, Bourne PE (2000) The Protein Data Bank. Nucleic Acids Res 28 (1):235-242
7. Verdonk ML, Cole JC, Hartshorn MJ, Murray CW, Taylor RD (2003) Improved protein– ligand docking using GOLD. Proteins Struct Funct Bioinf 52 (4):609-623. doi:10.1002/prot.10465
8. Trott O, Olson AJ (2010) AutoDock Vina: Improving the speed and accuracy of docking with a new scoring function, efficient optimization, and multithreading. J Comput Chem 31 (2):455-461. doi:10.1002/jcc.21334
9. Selwa E, Elisée E, Zavala A, Iorga BI (2018) Blinded evaluation of farnesoid X receptor (FXR) ligands binding using molecular docking and free energy calculations. J Comput Aided Mol Des 32 (1):273-286. doi:10.1007/s10822-017-0054-1
10. Pronk S, Pall S, Schulz R, Larsson P, Bjelkmar P, Apostolov R, Shirts MR, Smith JC, Kasson PM, van der Spoel D, Hess B, Lindahl E (2013) GROMACS 4.5: a high-throughput and highly parallel open source molecular simulation toolkit. Bioinformatics (Oxford, England) 29 (7):845-854. doi:10.1093/bioinformatics/btt055
11. Kaminski GA, Friesner RA, Tirado-Rives J, Jorgensen WL (2001) Evaluation and Reparametrization of the OPLS-AA Force Field for Proteins via Comparison with Accurate Quantum Chemical Calculations on Peptides. J Phys Chem B 105 (28):6474-6487. doi:10.1021/jp003919d
12. Robertson MJ, Tirado-Rives J, Jorgensen WL (2015) Improved Peptide and Protein Torsional Energetics with the OPLSAA Force Field. J Chem Theory Comput 11 (7):3499-3509. doi:10.1021/acs.jctc.5b00356
13. Gapsys V, Michielssens S, Seeliger D, de Groot BL (2015) pmx: Automated protein structure and topology generation for alchemical perturbations. J Comput Chem 36 (5):348-354. doi:10.1002/jcc.23804
14. Gapsys V, Michielssens S, Peters JH, de Groot BL, Leonov H (2015) Calculation of binding free energies. Methods in molecular biology (Clifton, NJ) 1215:173-209. doi:10.1007/978-1-4939-1465-4_9
15. Gapsys V, Michielssens S, Seeliger D, de Groot BL (2016) Accurate and Rigorous Prediction of the Changes in Protein Free Energies in a Large-Scale Mutation Scan. Angewandte Chemie (International ed in English) 55 (26):7364-7368. doi:10.1002/anie.201510054
16. Pettersen EF, Goddard TD, Huang CC, Couch GS, Greenblatt DM, Meng EC, Ferrin TE (2004) UCSF Chimera -- a visualization system for exploratory research and analysis. J Comput Chem 25 (13):1605-1612. doi:10.1002/jcc.20084
17. Surpateanu G, Iorga BI (2012) Evaluation of docking performance in a blinded virtual screening of fragment-like trypsin inhibitors. J Comput Aided Mol Des 26 (5):595-601. doi:10.1007/s10822-011-9526-x
18. Colas C, Iorga BI (2014) Virtual screening of the SAMPL4 blinded HIV integrase inhibitors dataset. J Comput Aided Mol Des 28 (4):455-462. doi:10.1007/s10822-014-9707-5
19. Martiny VY, Martz F, Selwa E, Iorga BI (2016) Blind pose prediction, scoring, and affinity ranking of the CSAR 2014 dataset. Journal of chemical information and modeling 56 (6):996-1003. doi:10.1021/acs.jcim.5b00337
20. Selwa E, Martiny VY, Iorga BI (2016) Molecular docking performance evaluated on the D3R Grand Challenge 2015 drug-like ligand datasets. J Comput Aided Mol Des 30 (9):829-839. doi:10.1007/s10822-016-9983-3
Electronic Supplementary Material
Blinded evaluation of cathepsin S inhibitors from the
D3RGC3 dataset using molecular docking and free energy
calculations
Ludovic Chaput,1,2,‡ Edithe Selwa,1,‡ Eddy Elisée,1,‡ Bogdan I. Iorga1,*
1 Institut de Chimie des Substances Naturelles, CNRS UPR 2301, LabEx LERMIT, 91198 Gif-sur-Yvette,
France
2 Department of Nephrology and Dialysis, AP-HP, Tenon Hospital, INSERM UMR_S 1155, 75020 Paris,
France
Corresponding Author
* Phone: +33 1 6982 3094; Fax: +33 1 6907 7247; Email: bogdan.iorga@cnrs.fr (B.I.I.).
Author Contributions
Table of contents
Table S1. Cathepsin S structures available in the PDB S3
Table S2. Kendall’s τ and Spearman’s ρ correlations for the training set S4
Figure S1. Dendrogram for the training set S5
Figure S2. Correlation of docking scores with pIC50 for the training set S5
Figure S3. Chemical structures of the score CatS dataset S6-S11
Figure S4. Performance of Phase 1A pose prediction submissions (complete submissions) S12
Figure S5. Performance of Phase 1A pose prediction submissions (incomplete submissions) S12
Figure S6. Performance of Phase 1B pose prediction submissions S13
Figure S7. Performance of Phase 1A ranking prediction submissions S13
Figure S8. Performance of Phase 2 ranking prediction submissions S14
Table S1. Cathepsin S structures available in the PDB
PDB code Resolution (Å) Ligand Organism
1GLO 2.2 – Homo sapiens
1MS6 1.9 BLN Homo sapiens
1NPZ 2.0 C1P Homo sapiens
1NQC 1.8 C4P Homo sapiens
2C0Y 2.1 – Homo sapiens
2F1G 1.9 GNF Homo sapiens
2FQ9 1.65 – Homo sapiens
2FRA 1.9 – Homo sapiens
2FRQ 1.6 – Homo sapiens
2FT2 1.7 – Homo sapiens
2FUD 1.95 – Homo sapiens
2FYE 2.2 – Homo sapiens
2G6D 2.5 – Homo sapiens
2G7Y 2.0 – Homo sapiens
2H7J 1.5 – Homo sapiens
2HH5 1.8 GNQ Homo sapiens
2HHN 1.55 GNQ Homo sapiens
2HXZ 1.9 – Homo sapiens
2OP3 1.6 TF5 Homo sapiens
2R9M 1.97 Y11 Homo sapiens
2R9N 2.0 – Homo sapiens
2R9O 2.0 – Homo sapiens
3IEJ 2.18 599 Homo sapiens
3KWN/5QC4 2.1 23Z Homo sapiens
3MPE/5QBY 2.25 N2A Homo sapiens
3MPF/5QBV 1.8 N2D Homo sapiens
3N3G 1.6 93N Homo sapiens
3N4C 1.9 EF3 Homo sapiens
3OVX 1.49 O64 Homo sapiens
4P6E 1.8 2FC Homo sapiens
4P6G 1.58 2FZ Homo sapiens 4BPV 2.0 – Mus musculus 4BQV 1.7 – Mus musculus 4BS5 1.25 MG2 Mus musculus 4BS6 1.2 – Mus musculus 4BSQ 1.96 QQV Mus musculus
4MZO 1.47 – Mus musculus
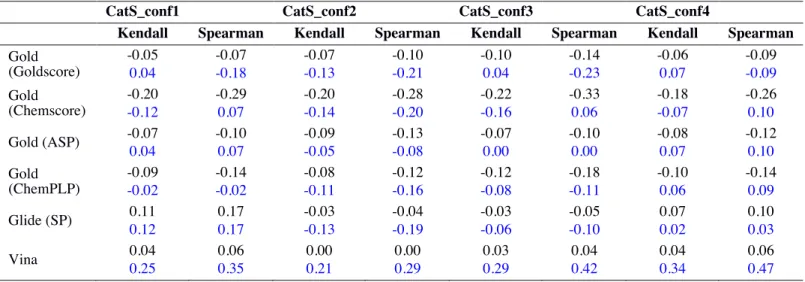
Table S2. Kendall’s τ and Spearman’s ρ correlations for the whole training set (black) and of a subset of
compounds having a Tanimoto similarity score of >0.5 with any compound from the CatS D3RGC3 dataset (blue). See also Figure S1.
CatS_conf1 CatS_conf2 CatS_conf3 CatS_conf4
Kendall Spearman Kendall Spearman Kendall Spearman Kendall Spearman
Gold (Goldscore) -0.05 0.04 -0.07 -0.18 -0.07 -0.13 -0.10 -0.21 -0.10 0.04 -0.14 -0.23 -0.06 0.07 -0.09 -0.09 Gold (Chemscore) -0.20 -0.12 -0.29 0.07 -0.20 -0.14 -0.28 -0.20 -0.22 -0.16 -0.33 0.06 -0.18 -0.07 -0.26 0.10 Gold (ASP) -0.07 0.04 -0.10 0.07 -0.09 -0.05 -0.13 -0.08 -0.07 0.00 -0.10 0.00 -0.08 0.07 -0.12 0.10 Gold (ChemPLP) -0.09 -0.02 -0.14 -0.02 -0.08 -0.11 -0.12 -0.16 -0.12 -0.08 -0.18 -0.11 -0.10 0.06 -0.14 0.09 Glide (SP) 0.11 0.12 0.17 0.17 -0.03 -0.13 -0.04 -0.19 -0.03 -0.06 -0.05 -0.10 0.07 0.02 0.10 0.03 Vina 0.04 0.25 0.06 0.35 0.00 0.21 0.00 0.29 0.03 0.29 0.04 0.42 0.04 0.34 0.06 0.47
Figure S1. Dendrogram showing that the training set contains two main clusters (red and blue, left) and that
the second cluster contains three distinct sub-clusters (magenta, orange and green, right). The compounds that are similar with the CatS ligands from the D3RGC3 dataset belong all to the blue cluster, and are homogeneously distributed within the three sub-clusters magenta, orange and green.
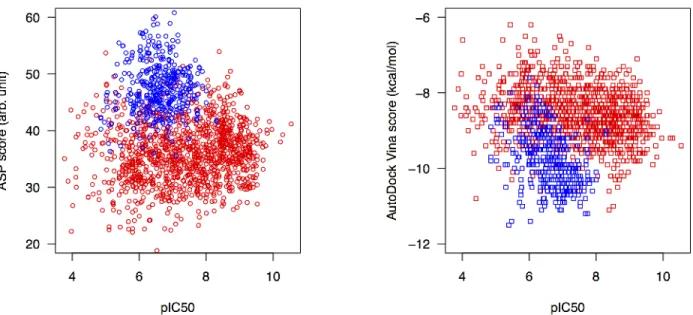
Figure S2. Correlation of Gold ASP (left) and Vina (right) docking scores (using CatS_conf4) with pIC50
for all compounds from the training set. The compounds are colored according to the two main clusters (see Figure S1).
Figure S4. Performance of Phase 1A pose prediction submissions for the CatS D3R Grand Challenge 3
dataset (RMSD for pose 1, mean value over all compounds, complete submissions). Our submissions are colored in green. See Table 2 in the main text for details.
Figure S5. Performance of Phase 1A pose prediction submissions for the CatS D3R Grand Challenge 3
dataset (RMSD for pose 1, mean value over all compounds, incomplete submissions). Our submission is colored in green. See Table 2 in the main text for details.
Figure S6. Performance of Phase 1B pose prediction submissions for the CatS D3R Grand Challenge 3
dataset (RMSD for pose 1, mean value over all compounds). Our submissions are colored in green. See Table 2 in the main text for details.
Figure S7. Performance of Phase 1A ranking prediction submissions (Kendall Tau, mean value over all
compounds) for the CatS D3R Grand Challenge 3 dataset. Our submissions are highlighted in green. See Table 2 in the main text for details.
Figure S8. Performance of Phase 2 ranking prediction submissions (Kendall Tau, mean value over all
compounds, incomplete submissions) for the CatS D3R Grand Challenge 3 dataset. Our submission is highlighted in green. See Table 2 in the main text for details.
Figure S9. Performance of Phase 2 free energy submissions (Kendall Tau, mean value over all compounds)
for the CatS D3R Grand Challenge 3 dataset. Our submission is highlighted in green. See Table 2 in the main text for details.