3rd USA/Europe Air Traffic Management R&D Seminar
Napoli, 13-16 June 2000
A Conceptual Design of A Departure Planner
Decision Aid
Ioannis Anagnostakis, Husni R. Idris
1, John-Paul Clarke, Eric Feron,
R. John Hansman, Amedeo R. Odoni
2, William D. Hall
3Massachusetts Institute of Technology
Dept. of Aeronautics and Astronautics
77 Massachusetts Av., Room 35-217
Cambridge, MA 02139
A
BSTRACTTerminal area Air Traffic Management handles both arriving and departing traffic. To date, research work on terminal area operations has focused primarily on the arrival flow and typically departures are taken into account only in an approximate (average) manner. However, arrivals and departures are highly coupled processes especially in the terminal airspace, with complex interactions and sharing of the same airport resources between arrivals and departures taking place in practically every important terminal area. Therefore, the addition of automation aids for departures, possibly in co-operation with existing arrival flow automation systems, could have a profound contribution in enhancing the overall efficiency of airport operations. This paper presents the conceptual system architecture for such an automation aid, the Departure Planner (DP). This architecture can be used as a core in the development of decision-aiding systems to assist air traffic controllers in improving the performance of departure operations and optimize runway time allocation among different operations at major congested airports. The design of such systems is expected to increase the overall efficiency of terminal area operations and yield benefits for all stakeholders involved in Air Traffic Management (ATM) operations, users as well as service providers.
1 Introduction
Aviation researchers in the US and Europe have recognized the need for enhanced airport surface traffic control systems. For example, the Departure Planner (DP) project at MIT [6] and the Taxi and Ramp Management and Control (TARMAC) system developed by the German Aerospace Research Establishment (DLR) [2] are both research efforts in this direction with the objective of:
• Optimizing departing traffic,
• Closing unnecessary gaps between arrivals and departures and
• Establishing an integrated Ground Movement Planning System [13].
The development of decision support tools for air traffic controllers calls for a thorough understanding of the links and interactions in ATM operations and requires constant evaluation and assessment. Furthermore, the design of a high-level architecture for airport departure management should be based on a thorough analysis of the airport system and understanding of the needs and constraints in current airport operational procedures. To this end, a significant set of field observations has been done at Boston Logan International Airport [6], [7], [8] the results of which are summarized in Section 2.
The observations and analyses discussed in previous work introduced significant issues that should be accounted for in the design phase of the Departure Planner [8]. Section 3 presents the suggested general architecture, which is expected to be sufficient for all aspects of departure management. The Departure ____________________________________
1
Research Assistants, Department of Aeronautics and Astronautics, Massachusetts Institute of Technology
2
Faculty members, Department of Aeronautics and Astronautics, Massachusetts Institute of Technology
Planner is designed to include several components. Each of these components addresses a certain aspect of the departure process and its interaction with the arrival flow. The architecture proposed here, describes the control function of each component of the planning system, its inputs and outputs, as well as identifies the point along the departure flow where this function could potentially be introduced. In particular section 3.2 highlights the Virtual Queue Manager (VQM) as the architectural component that is actually assigned with the task of Runway Operations Planning and coordination between arrivals and departures that use the same runway resources. Implementation issues are also addressed.
2 The Departure Process – Results from
Field Observations
Analysis of departure and arrival operations at Logan (BOS) and other major US airports, such as Chicago O'Hare (ORD), Atlanta Hartsfield (ATL) and Dallas-Fort Worth (DFW) revealed significant operational delays and environmental impact associated with the departure process [6]. Analysis also revealed that, while there are many similarities between the departure and arrival processes, there are also significant differences that affect the way in which improvements may be effected. For example, once arriving aircraft have passed a certain entry fix point in the terminal airspace, the arrival stream is for the most part determined and there is not much opportunity for sequence adjustments. The controllers though, prefer, for safety reasons, to keep aircraft on the ground rather than in the air for flow management purposes. Therefore, the design of a decision-aiding system to assist controllers in handling and optimizing departure operations will be potentially beneficial for ATM operations, especially since there is little observability and high volatility associated with boarding and pushback procedures [7], [8] and since, on the ground, controllers are presented with more opportunity to affect the final runway operations sequence.
Different components of the airport were identified as flow constraints that introduce delays and inefficiencies and contribute to the low prediction capability associated with departures [6], [7], [8]. The flow constraints identified were associated with the main airport system elements:
a) The gates complex b) The ramp area
c) The taxiway system and d) The runway system
The flow constraints manifest through the aircraft queues
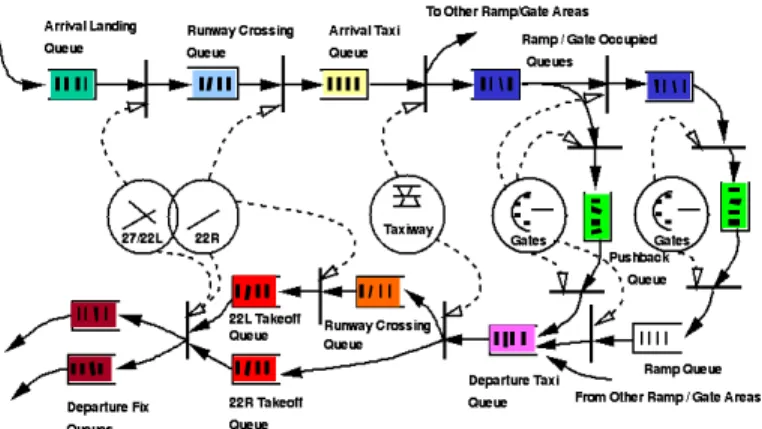
physically that form at the above elements. In that sense, an airport system can be modeled as a complex interactive queuing system in which departures and arrivals are highly coupled. Figures 1 and 2 illustrate all the different aircraft queues that form on the Logan airport surface in the configuration 22 / 27.
Figure 1: Taxiway and Runway Queues at Logan Airport under configuration 22 / 27
As shown in Figure 1, in this configuration, runway 27 is usually dedicated to arrivals, runway 22R is used only for departures and runway 22L is used primarily for arrivals. Often, pilots who specifically request a longer runway for takeoff, use the latter for departure, in which case they line up and wait on the south taxiway segment between 22L and 22R. When a large number of departures are expected, the airport switches to "Accelerated Departure Procedures" (ADP), in which case runway 22L is used only for departures and all arrivals are routed to runway 27 (see also Figure 6 in Section 3.1).
The flow of arriving and departing aircraft through the airport system and the various queues forming on the airport surface in configuration 22 / 27 can be abstracted as in Figure 2. The physical elements of the airport system (gates, taxiways, runways) are depicted in the middle part of the figure and their interactions with the airport queues are shown as dashed arrow lines. Each bar between different queues represents a transition from one queue to another. Solid arrows represent the aircraft flow and dashed arrows associated with a specific airport resource, represent use of that resource for the queue transitions. Following the aircraft flow in Figure 2, an arriving aircraft queues on final approach and after
N Terminal A Ramp X (no ramp) Y N Terminal A Ramp X (no ramp) Y
landing on runways 27 or 22L, it joins a runway-crossing queue waiting to cross runway 22R. After crossing, it joins other aircraft in taxiing queues, which include arriving and/or departing aircraft. Upon arrival at its assigned gate, it may have to wait for the gate to be released from the previous aircraft. When the gate becomes available, the aircraft joins a pushback queue according to its scheduled departure time. Figure 2, depicts two different types of gates that were observed. In one case (far right side of Figure 2) aircraft that push back from these gates enter the ramp area (e.g. Logan terminal A ramp in Figure 1) and wait in a ramp queue for ATC clearance to enter the departure taxi queue in the taxiway system. In the other case, aircraft push back directly onto the taxiway system with no intermediate ramp area (e.g. point X in Figure 1). At point Y, departing aircraft that are assigned runway 22R for takeoff enter the 22R takeoff queue. Departing aircraft assigned to take off on runway 22L, join the same taxiway segment but are considered to enter a runway-crossing queue in order to cross runway 22R before joining the 22L takeoff queue.
Figure 2: Queuing Model for Logan Airport under configuration 22 / 27
Figure 1 also shows the possible location of these queues on the surface of Logan Airport in the cas e of configuration 22 / 27. The two arrival queues on runways 27 and 22L are easily identified, as well as the departure queue that is formed on the taxiway segment adjacent to runway 22R. This departure queue includes aircraft that line up to take off from runway 22R and aircraft that will cross 22R to take off from 22L (ADP, Figure 6). Operations on runway 22R are impeded not only by aircraft departing on 22L but also by arriving aircraft that queue in taxiway segments between the two parallel runways to cross runway 22R.
The above identification of the airport flow constraints
and the associated queuing network was critical in studying the dynamics of departure operations. It enabled the definition of various control points where the departure operations could be affected by control actions and it also helped in determining the Departure Planner control options.
The observed operations described above are tactically under the control of the air traffic controllers in the Control Tower. The air traffic controller has to clear each aircraft to use an airport resource such as a ramp, a taxiway or a runway, by delivering a “clearance instruction”. By observing the aircraft queuing process and the control process, it was possible to identify control functions, which occur at specific control points. The transitions in Figure 2 are examples of such control actions and control points. Most aircraft operations are under the control of the Tower and therefore, control actions and points are associated with the controllers’ clearances. However, some aircraft operations, such as engine-start, are not currently under the Tower’s control at Logan.
The following control functions were identified based on the observations at Logan airport:
a) Pushback clearance (for jets) or taxi clearance (for propeller-driven aircraft).
b) Clearance to enter the taxiway system of the airport from the ramp area, gate where the aircraft is waiting.
c) Runway and taxi-path allocation, i.e. the process of routing aircraft to a specific runway, through a predetermined taxiway path.
d) Sequencing of aircraft takeoff, i.e. merging of aircraft into the same takeoff queue or mixing between aircraft from multiple queues (e.g. one jet aircraft and one turboprop aircraft queue) at the same takeoff runway.
e) Takeoff release of each aircraft. If a runway is used by departures, landings and runway crossings, takeoff release also involves mixing of operations on that runway.
It was observed that a control function could be exercised at different times and locations. For example, aircraft sequencing can be performed at the gate (pushback control), at the taxiway entry points as aircraft are released into the taxiway system and up to the physical point beyond which the aircraft have to commit to a particular takeoff queue. Once the aircraft are physically present at the runway end, the takeoff sequence is hard to modify. This type of observation has led to a definition of a control point as the last opportunity that the controllers have to apply a particular control function to
the departure queues. A control point can be a physical point on the airport surface, or it can be a point in time during the departure process, when the aircraft transitions from one state to another. For example, a control point exists at the gates when aircraft are cleared to push back into the ramp area. A possible control point is also the instant when aircraft, while taxiing, are handed off to a specific controller who handles a particular set of runways. At that point in time these aircraft are committed to enter a runway queue, with much less room for further adjustments than in the taxiing phase. The main control points associated with the observed operations outlined above are:
a) The gate.
b) The point of entry from the gate or ramp into the airport taxiway system.
c) The point of commitment to a specific queue (temporal or spatial) and
d) The point of entry to an active runway (exit from a takeoff queue).
The control points and the control functions are generic but there are airport specific and runway configuration specific differences. In [6] Atlanta Hartsfield (ATL) and Boston Logan (BOS) were compared. BOS has one runway system and minimal ramp area, while ATL has two runway systems and a well-defined ramp area. Therefore, BOS is usually operating with one departure queue. The structure of this queue can be primarily determined at the gate (pushback clearance control function), which in most cases is the point of entry into the taxiway system, since the intermediate ramp area in BOS is almost non-existent. On the other hand, ATL has at least two departure queues in most cases, as well as a larger controlled ramp area than BOS does. This means that the structure of the departure queues can be affected at the gate control point, but also to a larger extent at the taxiway entry points and through the mixing of aircraft from different queues.
One of the main objectives of the Departure Planner is to mitigate the existing inefficiencies and reduce the observed delays resulting from the flow constraints that were described above. However, an airport system is an environment whose several stakeholders, such as airport users (airlines, passengers) and ATM service providers have different and often conflicting objectives. Each of them attaches different “weights” to competing system objectives, which makes it hard to define a single objective function for the DP system. Some system objectives that have been identified are:
a) Comply with safety and separation requirements, b) Maximize system throughput,
c) Minimize taxi time (aircraft engine emissions),
d) Consider noise regulations and constraints, e) Balance the load on all runways,
f) Maintain the controllers’ workload at acceptable levels and,
g) Provide fair treatment for all airport users
In an effort to satisfy the above objectives, the Departure Planner is designed to include several components, based on the observed airport operations. These components are examined in detail in the following sections.
3 Overview of the Proposed Departure
Planner Architecture and Operational
Context
Field observations, as a method of airport system identification, helped in identifying the control points and functions mentioned above. The results from this analysis were combined with documented airport and Air Traffic Control (ATC) operations in order to generate the system architecture presented here.
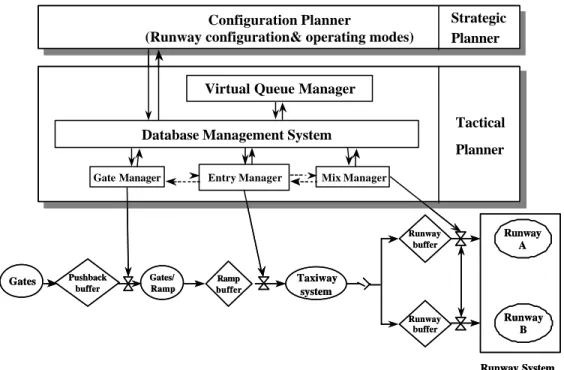
Figure 3 illustrates the two principal parts that the architecture consists of:
Strategic Planner
This is essentially a Configuration Planner that would typically have an approximately 3 to 4-hour time horizon and would perform configuration management tasks.
Tactical Planner
This part of the system has an approximately 15-30 minute time horizon, performs tactical planning of runway operations under a specific runway configuration and exercises appropriate control to implement the generated plans.
The most critical tactical component introduced in the system is the Virtual Queue Manager. The remaining three tactical system components (starting from the gates and following the departure flow to the runway takeoff queues) are:
a) The Gate Manager, which is introduced in order to support the controllers in managing the pushback schedule given the unpredictability (uncertainty) inherent in airline gate operations and schedules. b) The Taxiway Entry Manager, which modulates the
release of aircraft for entry into the taxiway system. c) The Mix Manager, which is introduced in order to
manage the arrival/departure mix onto active runways.
Detailed descriptions of the various DP components are provided in the following sections.
Figure 3: Overview of the Departure Planner system hierarchy
In a generic framework that can be applied to any airport, each of the four tactical components is designed to exercise control and address inefficiencies at specific control points along the departure process. Each strategic and tactical component can be linked (mapped) to a group of objectives drawn from the family of the general functional objectives of the decision-aiding system that were presented earlier. At the same time, all components are envisioned to communicate and exchange data with each other directly or via a common Database Management System (Figure 3). The latter is designed to ensure that all components have access to the same consistent information. It should interact with several specialized databases containing necessary airport specific data, such as:
• Airport topology
• ATC procedures, regulations and restrictions, e.g. airport-specific arrival and departure routes, such as Standard Terminal Arrival Routes (STAR) and Standard Instrument Departures (SID)
• Aircraft performance data, such as Eurocontrol’s Base of Aircraft Data (BADA) or even a generic “energy model” or “point mass model” of an aircraft, as well as dynamically generated data, such as:
− Flight plans
− Aircraft identification information
• ATC constraints that are dynamically introduced, e.g. flight priorities, Ground Delay Programs
Generalizing, the main tasks of all components should be to:
• Implement the designed virtual queue through control actions, taking into account:
− Specific information and constraints for the area of operations that each component is associated with, i.e. gates, ramp, taxiways, runways and
− Specific “settings” input in the system by the controller responsible for that area
• Distribute information
− To and between airport operators such as the controllers and airport users such as the airlines (external interface). An example of such external communication is the distribution of information to controllers that cannot be directly accessible by them, but is contained in other, in some cases remote, technical systems, such as central airline operations’ management systems, or local airline station control networks.
− In between system components (intern al interface). Examples of such internal communication is the distribution of information about all performed control actions of a specific component, which are relevant to other components of the architecture, or the communication of new events that make certain system solutions infeasible.
Runway System Gates Taxiway system Runway A Runway B Ramp buffer Runway buffer Runway buffer Pushback buffer
Entry Manager Mix Manager
Gate Manager
Configuration Planner
(Runway configuration& operating modes)
Configuration Planner
(Runway configuration& operating modes)
Virtual Queue Manager
Gates/ Ramp
Database Management System Tactical
Planner Strategic Planner Runway System Gates Taxiway system Runway A Runway B Ramp buffer Runway buffer Runway buffer Pushback buffer
Entry Manager Mix Manager
Gate Manager
Configuration Planner
(Runway configuration& operating modes)
Configuration Planner
(Runway configuration& operating modes)
Virtual Queue Manager
Gates/ Ramp
Database Management System Tactical
Planner Strategic Planner
In any busy airport, even with a fairly simple runway geometry, managing ground operations and planning the allocation of runway time to the various types of runway operations, can be a very challenging task. Any effo rt to design a decision-aiding tool deployed to assist air traffic controllers with this task must take into consideration several operational requirements, which arise primarily due to the presence of human operators in the process. For example, in managing airport ground operations, there are two main tasks to be performed: planning and control and both of them are inevitably performed in a distributed fashion, because of the many different parties involved in most planning and control functions. A successful design of an automated airport -wide decision-aiding system must take into account integration issues between the varying objectives, constraints, information requirements and control inputs from all stakeholders involved in airport ground operations, such as the airlines, airport authorities, airport service operators, passengers and the FAA personnel in the air traffic control tower and the TRACON room. As an example, consider the information needs of the gate personnel and station managers of a specific airline at an airport, as opposed to the information needs of the air traffic controllers in the tower cab. The latter have to deal with all incoming and outgoing airport ground traffic and not only the aircraft of a particular airline, which means that their information needs are apparently larger than those of the specific airline operators.
It is uncertain how feasible it is for an automated system to take into account the objectives of all involved parties. Therefore, it is likely that the solutions suggested by such a system may not always be optimal. In addition, runway operations plans generated by the decision-aiding tool may even be unimplementable due to the system’s inability to incorporate very dynamic last minute changes of the system state (e.g. traffic situation) that it was not aware of when those plans were calculated. Real-world applicability of the generated plans requires that the controllers have ample planning and control flexibility to modify the plans for factors and events not visible to the decision-aiding tool and that the solutions generated are presented to controllers as operational guidelines and not as inviolable laws that they have to abide to.
On a final note, careful consideration must be given to "usability” and the interaction between the controller and the decision-aiding tool in the context of the operational environment and standard procedures within the ATC tower. The underlying structure of the decision aid and optimization process must be clear to the controller and the results must be consistent with the controllers’ heuristic estimates. In addition, the interface limits
"head-down" time for controllers. It should also be noted that the tool could be used as a communication device between controllers. Controller interface devices, which support these functions in the tower cab environment, are under development.
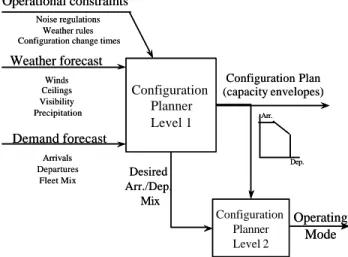
3.1 Configuration Planner
The Configuration Planner attempts to match the airport’s operational capacity as closely as possible to the schedule d demand, always taking under consideration limitations imposed by the forecasted terminal weather and by environmental constraints (aircraft engine noise and emissions), such as noise restrictions.
Functionality
The main task performed by the Configuration Planner is the development of the runway configuration plan for the airport so that all arrivals and departures expected to utilize the airport runway resources can be handled. It must be designed to take into account the stochasticity associated with weather. Accurate terminal weather and wind forecasts in conjunction with the pertinent noise abatement rules are used to define the set of feasible configurations for the airport. Based on these, the Configuration Planner determines the number of hourly operations that the airport can handle and the expected arrival and departure demand over successive intervals during the planning horizon is then matched to each of these configurations (level 1 in Figure 4), in order to design the best configuration strategy throughout the day.
Figure 4: The Configuration Planner
In order to accommodate short-term demand fluctuations (Figure 6) the Configuration Planner should be able to suggest discrete operating modes within the time horizon of each of the planned configurations (level 2 in Figure
Configuration Planner Level 1 Configuration Planner Level 2 Configuration Plan (capacity envelopes) Operational constraints Weather forecast Demand forecast Desired Arr./Dep. Mix Operating Mode Winds Ceilings Visibility Precipitation Arrivals Departures Fleet Mix Noise regulations Weather rules Configuration change times
Dep. Arr. Configuration Planner Level 1 Configuration Planner Level 2 Configuration Plan (capacity envelopes) Operational constraints Weather forecast Demand forecast Desired Arr./Dep. Mix Operating Mode Winds Ceilings Visibility Precipitation Arrivals Departures Fleet Mix Noise regulations Weather rules Configuration change times
Dep. Arr.
4), especially since the response time of the airport to a change from one operating mode to another within the same runway configuration is quicker than the airport response time in the case of a full change of runway configuration.
Supporting Analysis
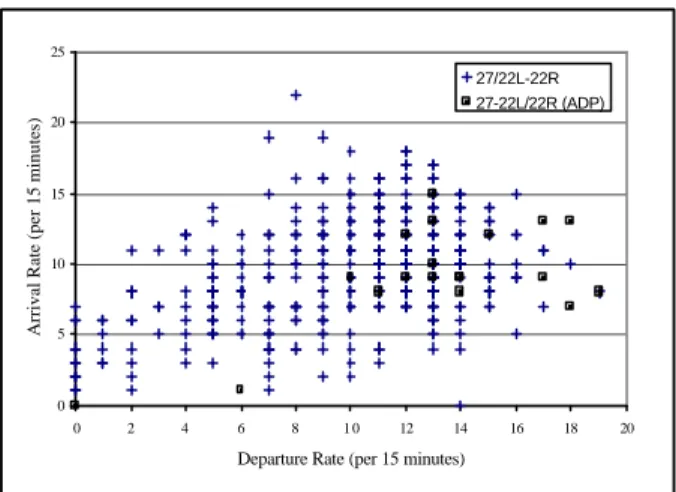
Figure 5 presents examples of four capacity envelopes that were generated based on airport throughput data over the course of 15 days. The data was collected from the air traffic control tower records as well as ETMS records from the FAA’s CODAS database [9]. Evidently, different runway configurations at Logan airport yield different capacities. In their effort to match the levels of demand expected, the controllers try to use the configurations with the highest arrival and departure capacity. However, the final selection is dependent on the weather and wind conditions at the airport. In addition, several noise abatement rules limit the use of certain runways at certain times of the day. These weather and noise constraints are taken into account by the controllers in their decision-making process for selecting the airport runway configuration. In fact, at Logan airport, there are certain runway configurations that are recommended at night hours.
Figure 5: Runway Configuration Capacity Envelopes (Source: ETMS / Tower Records, 7-9 AM, 4-8 PM, July 1-15 1998 except Saturdays, Logan Airport)
Matching different possible configurations to the schedule takes into account the time required for transitioning between configurations, which can take values up to 20 min for a busy period at major airports like Logan. When the arrival flow is very high, it takes longer to implement a configuration change, because it is harder to interrupt the arrival stream on final approach. For exa mple, at Logan airport, switching to a high capacity configuration is usually attempted before periods of expected high traffic.
Short-term fluctuations in the arrival/departure mix drive the airport in “departure push” or “arrival pull” mode. In these cases, the air traffic controllers perform short-term configuration changes by adjusting the operations that are assigned to utilize each runway within the current configuration. These configuration changes correspond to transitions between different operating points on the airport’s capacity curve [8]. For example, in normal operations within the 22 / 27 configuration, runway 22L is used both for arrivals and departures. However, when Logan airport is in a departure push mode, runway 22L is sometimes used only for departures (together with 22R) and all arrivals are assigned to runway 27. Figure 6 shows the effect on the departure / arrival mix, by superimposing periods when ADP was used, over the capacity envelops presented in Figure 5 [9].
Figure 6: Accelerated Departure Procedure (ADP) (source: ETMS, July 1-15 1998, Logan Airport)
In matching the scheduled demand to the set of possible configurations, the configuration planner should take into account the uncertainty inherent in departure operations. Departure demand is affected by airline decisions on delays and cancellations, which are not always known sufficiently in advance. Collaborative Decision-Making (CDM) is a step towards addressing this problem. It has been shown that advance cancellation notices have improved noticeably after the introduction of CDM and the corresponding software and information management tools [1].
3.2 The Virtual Queue Manager
The Virtual Queue Manager (VQM) proactively manages the airport’s Virtual Queue so that DP objectives are met and therefore airport resources (runways, taxiways and gates) are efficiently utilized.
0 5 10 15 20 25 0 5 10 15 20 25
Actual Departure Rate (per 15 minutes)
Actual Arrival Rate (per 15 minutes)
4L/4R-9 (reported average 68 AAR - 50 DEP) 27/22L-22R (reported average 60 AAR - 50 DEP) 33L/33R-27 (reported average 44 AAR - 44 DEP) Single Runway (reported average 34 AAR 34 DEP) 0 5 10 15 20 25 0 2 4 6 8 1 0 12 14 16 18 20
Departure Rate (per 15 minutes)
Arrival Rate (per 15 minutes)
27/22L-22R 27-22L/22R (ADP)
Virtual Queue Definition
A Virtual Queue can be defined as a notional waiting line of departing aircraft arranged, at any instant of time, according to the order in which they are expected to take off. It consists of:
a) A “physical” part, which involves aircraft that are or will shortly be physically present at a certain location on the airport surface, with no further chance for re-sequencing; therefore, these aircraft have a fixed (“frozen”) position in the virtual queue. b) A “virtual” part, which involves aircraft that are
scheduled to occupy a particular position in the sequence of aircraft that will take off, but are not physically present in the takeoff queue yet. Position assignments in this virtual part of the virtual queue are very much subject to revision.
In other words, the Virtual Queue can be seen as an extension of the notion of a physical queue that depicts the final takeoff sequence of all scheduled departures as the Departure Planner has planned it up to the current point in time.
If two or more departure runways are currently in use, or are expected to be shortly, then multiple virtual queues (one for each departure runway) will be in use. As an alternative, in such cases there might be a single virtual queue with each aircraft in the queue being “tagged” to indicate which departure runway it will use.
Functionality
In Figure 3, the VQM is hypothesized to reside in the system hierarchy at one level above the tactical DP elements. It interacts separately with the strategic configuration planner and also acting as a central processing function it coordinates the three tactical DP components. It incorporates all the requests from various physical queues in the system and relays back to them information about generated runway operation plans, the virtual queue and the required control actions in order to implement it. The major challenge is to design the optimum size of the virtual queue (minimum buffer size) in such a way that the aircraft queues in the system (especially the runway takeoff queue) are not consistently “starved” or saturated.
Since the runway was observed to be the main flow constraint, a possible design of the virtual queue is generated assuming that its “physical” part resides at the runway threshold. In this case, the two parts of the virtual queue would be:
a) The “physical” part, including flights whose position in the queue may be “frozen” a few (10 or 15) minutes before their assigned takeoff time and b) The “virtual” part, in which the scheduled departure
time and the sequencing of some aircraft may be subject to change due to the fact that there is still considerable time to go, e.g., mo re than 15 minutes until the actual departure event
The mode of interaction between the Virtual Queue Manager (VQM) and the other DP tools is still a research issue. One possibility is a "Master-Slave" relationship, in which the optimization logic is entirely included in the Virtual Queue Manager. Each of the DP components simply relays information and communicates its specific requests to the VQM with the hope that the system status will allow its requests to be satisfied. Another possible design philosophy is for each of the DP components to carry its own optimization logic and perform a local optimization dealing with a specific subproblem of the overall problem. Subsequently, the Virtual Queue Manager takes all the individual optimization results from the DP components and attempts to combine all the “local” solutions into a “global” one. This process may involve iterations and re-optimization until a feasible solution is achieved.
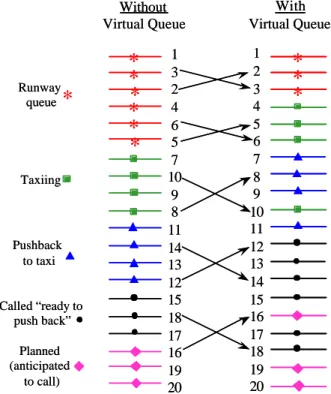
Figure 7: Managing the departure sequence of the same 20 scheduled flights, with and without the implementation of a Virtual Queue (right hand side indicates the current optimal sequence)
Figure 7 provides a hypothetical means to visualize the virtual queue and understand its potential benefits. Each side of the figure represents a snapshot of the takeoff
*
*
*
Runway queue Taxiing Pushback to taxi Called “ready to push back” Planned (anticipated to call) With Virtual Queue Without Virtual Queue*
*
*
*
*
*
1 3 2 4 6 5 7 10 9 8 11 14 13 12 15 18 17 16 19 20 1 2 3 4 5 6 7 8 9 10 11 12 13 14 15 16 17 18 19 20*
*
*
*
Runway queue Taxiing Pushback to taxi Called “ready to push back” Planned (anticipated to call) With Virtual Queue Without Virtual Queue*
*
*
*
*
*
1 3 2 4 6 5 7 10 9 8 11 14 13 12 15 18 17 16 19 20 1 2 3 4 5 6 7 8 9 10 11 12 13 14 15 16 17 18 19 20*
sequence as it is currently projected in the future. The “left hand” side represents the observed behavior where aircraft are transitioned from one state to the next mainly in a First Come First Serve order and where the queue buffer sizes are not controlled resulting in unnecessarily overloaded takeoff queues and taxiway congestion. The “right hand” side in Figure 7 represents the behavior with the implementation of the Virtual Queue, which provides a tool for effectively controlling the number of aircraft in each state at each point in time and regulating the timing of aircraft transitions from one state to the next. Aircraft move from the gate to the ramp onto the taxiway system and into one of the takeoff queues, following the timing and sequence schedule commanded by the Virtual Queue Manager. This optimal (or near-optimal) sequence is determined based on the system-wide objectives and constraints that were discussed earlier.
Each line corresponds to a departing flight scheduled to take off within the time span that the virtual queue covers. In each case, the state of the departing aircraft is represented by a specific symbol as follows:
a) Physically present at the runway threshold b) Taxiing
c) Pushed back from the gate but not yet released into the taxiway system (ramp area)
d) Waiting for pushback clearance from the tower, after having called "ready for pushback" and
e) Expected to call "ready for pushback" within a pre-determined time horizon.
Due to high workload, it is very hard in most cases for air traffic controllers to mentally determine the appropriate timing and sequence of departures, while at the same time keeping in mind all constraints and satisfying all system objectives. The existence of the virtual queue may assist controllers to determine possible "aircraft takeoff swaps" within the same state or even between different aircraft states (arrows in Figure 7) in order to optimize departure operations. The virtual queue may point out some of the optimal sequences that the controllers may not realize under heavy workload (see examples in Figures 8 and 9). In addition, the virtual queue may be used to convert taxi delays to gate delays, which are less costly both for the airlines and the environment. In addition, operational flexibility for the airlines can be increased without sacrificing fairness.
The VQM can be designed to exercise two levels of control on the allocation of runway time to different operations:
• Simple control of the size and/or sequence of takeoff queues and
• Time-based control.
In the second case it is expected that the solution quality will be enhanced, but at the same time the computational complexity of the problem may be increased.
Supporting Analysis
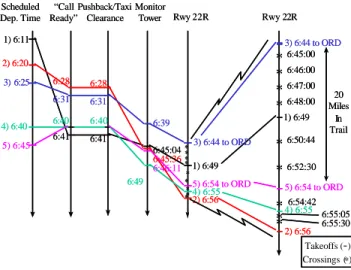
The following analytical examples are extracted from observations of actual operations at Logan airport. They are used to describe actual inefficiencies in runway utilization due to ATM operational constraints and also demonstrate the potential benefits that the airport system can have from efficient utilization and sequencing of the runway resources. Figures 8 and 9 present actual operations at Logan airport under configuration 22 / 27. Figure 8 displays the progress of five departing flights through time. From left to right, the following time events are given:
a) Scheduled departure time
b) Time the pilot called “ready” to leave the gate c) Time the clearance to pushback (for jets) or taxi (for
props) was granted by the tower
d) The “Monitor Tower” time which (in this configuration) is the time that each departing aircraft is cleared to join the takeoff queue. This is the point where controllers usually exercise sequencing control among departures.
Figure 8: Miles In Trail (MIT) restrictions
The two remaining timelines in each of Figures 8 and 9 describes the takeoff and crossing operations on runway 22R (presented once in scale and once magnified). Each departure and crossing event has a record of the time the aircraft was cleared to take off or cross runway 22R.
In Figure 8 Chicago-bound flights (ORD) were under a 20 Miles-In- Trail (MIT) restriction. Hypothetically, departure 1, which called ready to push back at 6:41 am after departure 5 (6:40 am) was sequenced to take off before the latter, so that ORD-bound departure 5
Pushback/Taxi Clearance Rwy 22R Scheduled Dep. Time Monitor Tower 1) 6:49 2) 6:56 3) 6:44 to ORD 4) 6:55 5) 6:54 to ORD * * * * * * * * * “Call Ready” 6:50:44 6:52:30 6:54:42 6:55:30 6:55:05 6:45:00 6:46:00 6:47:00 6:48:00 1) 6:11 2) 6:20 3) 6:25 4) 6:40 5) 6:45 6:28 6:41 6:31 6:40 6:45:04 6:45:36 6:39 6:49 6:46:11 6:28 6:41 6:31 6:40 Rwy 22R 3) 6:44 to ORD 1) 6:49 2) 6:56 4) 6:55 5) 6:54 to ORD ∗ ∗ ∗∗ ∗ ∗ ∗ ∗∗ 20 Miles In Trail Takeoffs (-) Crossings (∗) Pushback/Taxi Clearance Rwy 22R Scheduled Dep. Time Monitor Tower 1) 6:49 2) 6:56 3) 6:44 to ORD 4) 6:55 5) 6:54 to ORD * * * * * * * * * “Call Ready” 6:50:44 6:52:30 6:54:42 6:55:30 6:55:05 6:45:00 6:46:00 6:47:00 6:48:00 1) 6:11 2) 6:20 3) 6:25 4) 6:40 5) 6:45 6:28 6:41 6:31 6:40 6:45:04 6:45:36 6:39 6:49 6:46:11 6:28 6:41 6:31 6:40 Rwy 22R 3) 6:44 to ORD 1) 6:49 2) 6:56 4) 6:55 5) 6:54 to ORD ∗ ∗ ∗∗ ∗ ∗ ∗ ∗∗ 20 Miles In Trail Takeoffs (-) Crossings (∗)
maintains a 20 MIT separation from prior ORD-bound departure 3. Departures 2 and 4, which called ready for pushback before or together with departure 5, ended up behind the latter in the takeoff sequence. Flights 2 and 4 could have been sequenced to take off before flight 5, which was already delayed due to the MIT restriction, resulting in more efficient runway throughput. Note that in a 5-minute period between flights 1 and 5, the runway was used only for two aircraft crossings (asterisk ∗ symbols on the runway 22R timeline). The data collected showed that there were:
• A “runway idle” time gap of 104 sec, between departure 1 and the first crossing event that occurred immediately after it (6:49 to 6:50:44)
• A gap of 106 sec (6:50:44 to 6:52:30) between the two crossings and
• A gap of 90 sec (6:52:30 to 6:54) between the second crossing and the next departure 5.
Looking at the utilization of runway 22R, it is suggested that there is room for assisting air traffic controllers in designing takeoff sequences under several operational constraints, with an objective to avoid such unnecessarily large utilization “gaps” and achieve higher takeoff throughput.
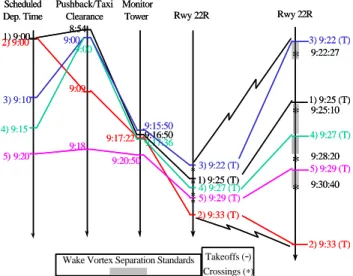
Similarly, in Figure 9, we can observe large time gaps between successive takeoffs with only one crossing operated within each gap. For simplicity, the “call ready” timeline has been omitted. The five departures examined here call ready and pushback in the order 1, 3 & 4, 2, and 5. Departure 5 called ready for pushback (9:18) after departure 2 (9:09). However, it was sequenced to take off before the latter, probably due to the fact that, in this configuration, the estimated taxi out time for flight 5 is lower than the one for flight 2, based on the distance from each flight’s originating terminal to the runway 22R takeoff point. From this example, it is obvious that controllers actually implement certain sequencing rules, based primarily on their vast operational experience. Nevertheless, there seems to be room for improved sequences, in order to avoid excessive “runway idle” time. Focusing on the takeoff / crossing timeline in Figure 9, we can see that in each of the four time intervals between the five departures, there was only one crossing operated. Each crossing occurred very soon after the preceding takeoff and for the remaining time until the next takeoff, the runway remained idle. Based, on the wake vortex separation requirements for the aircraft types present, only the gap between departures 1 and 4 needed to be as long as it actually was.
Note that, even if a takeoff sequence is very well designed based on the latest information available to the controllers, there are always unexpected events that can cause serious deviations from the planned takeoff order.
For example, departure 2 may have been carefully sequenced after departure 5, as mentioned above. However, it was cleared to take off 140 sec (9:30:40 to 9:33:00) after the previous crossing aircraft cleared the runway and 4 min (9:29 to 9:33) after the previous takeoff occurred on the same runway. This could have possibly happened because the takeoff weight and balance calculations were not available for departure 2, even though it was first in the takeoff queue. In other cases, scheduled or non-scheduled priority flights (e.g. lifeguard flights) or aircraft in the departure queue unable to takeoff can perturb the takeoff sequence.
Figure 9: Takeoff sequence adjustments
3.3 The Gate Manager
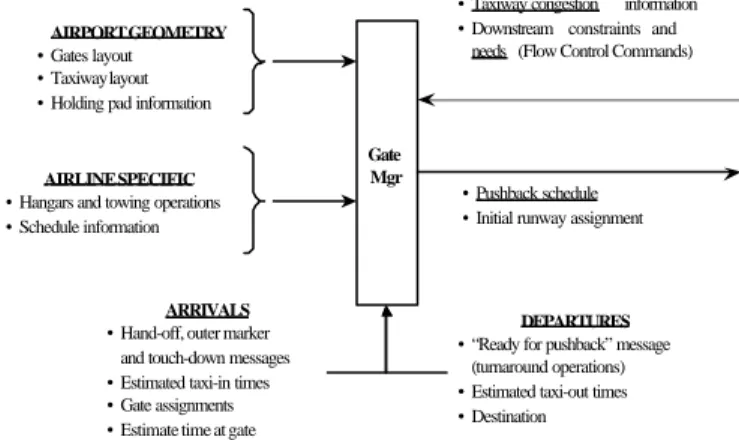
The Gate Manager is the DP component that assists the controllers in determining the pushback schedule, subject to the uncertainty associated with airline gate operations. Initial runway assignments for departing flights may also be an important part of the Gate Manager’s task.
Functionality
Being the first DP component that can have an effect along the departure flow, the Gate Manager incorporates and processes data generated from the rest of the DP system components, as depicted in the “free body diagram”, shown in Figure 10.
Note that, arrows pointing inwards toward the Gate Manager carry information (flight status data, system constraints) coming from other elements, which are adjacent to the Gate Manager in the system architecture, or from other National Airspace databases that exchange data with the Departure Planner (e.g. Surface Movement Advisor (SMA), Center TRACON Automation System (CTAS)). On the other hand, arrows pointing outwards
Pushback/Taxi Clearance Scheduled Dep. Time Monitor Tower 1) 9:00 2) 9:00 3) 9:10 4) 9:15 5) 9:20 9:16:50 9:17:22 9:15:50 9:17:36 9:20:50 9:09 8:54 9:00 9:00 9:18 Rwy 22R 1) 9:25 (T) 2) 9:33 (T) 3) 9:22 (T) 4) 9:27 (T) 5) 9:29 (T) * * * * 9:30:40 9:28:20 9:25:10 9:22:27 1) 9:25 (T) 2) 9:33 (T) 3) 9:22 (T) 4) 9:27 (T) 5) 9:29 (T) ∗ ∗ ∗ ∗ Rwy 22R Takeoffs (-) Crossings (∗) Wake Vortex Separation Standards
Pushback/Taxi Clearance Scheduled Dep. Time Monitor Tower 1) 9:00 2) 9:00 3) 9:10 4) 9:15 5) 9:20 9:16:50 9:17:22 9:15:50 9:17:36 9:20:50 9:09 8:54 9:00 9:00 9:18 Rwy 22R 1) 9:25 (T) 2) 9:33 (T) 3) 9:22 (T) 4) 9:27 (T) 5) 9:29 (T) * * * * 9:30:40 9:28:20 9:25:10 9:22:27 1) 9:25 (T) 2) 9:33 (T) 3) 9:22 (T) 4) 9:27 (T) 5) 9:29 (T) ∗ ∗ ∗ ∗ Rwy 22R Takeoffs (-) Crossings (∗) Wake Vortex Separation Standards
from the DP component convey to the rest of the system commands and requests generated by the Gate Manager function. A similar convention is used to read the “free body diagrams” presented for the remaining system components that are described in the following sectio ns (Figures 13 and 15).
Figure 10: The Gate Manager
Initially, based on traffic information from the gates, the ramp area and the taxiway system (Figure 10, top left and right data blocks), the Gate Manager assesses the current airport situation and suggests a feasible pushback schedule within a pre-determined planning horizon. At this point, data necessary for an accurate estimate of the current and projected demand (possibly obtained from the SMA database) are airline specific data, such as hangar status, current towing operations, and flight specific data local to each gate, such as destination, “turn-around readiness" messages, and taxi -out time estimates (Figure 10, middle left and bottom data blocks). In addition, downstream constraints such as gate holds and Ground Delay Programs (Figure 10, top right data block), which usually involve many cancellations, delays and gate rescheduling must be communicated to the Gate Manager as soon as the related information is available from the FAA central flow control (System Command Center).
Many of the airline operations, especially the ones performed before aircraft are actually ready to push back from their gates, are not observable by the controllers. For example, oftentimes aircraft will call ready for pushback before their gate operations are actually complete, anticipating a delay between the call for pushback and the actual time that a clearance is granted. Sometimes, delays and cancellations due to inclement weather or mechanical problems, result in aircraft being held at their gates and cause unexpected gate blockages. With DP, such situations can be observed by controllers
through the exchange of pertinent information between the Gate Manager and the Database Management System.
Supporting Analysis
One control strategy is to limit the number of aircraft released in the system by holding some of them at their gates. This method is fairly easy to implement, however, it may raise gate capacity issues, since it transfers runway queue delays to gate delays [10]. Controlling the gate release times with the help of the Gate Manager provides the controllers with a unique opportunity to implement the above control strategy, to control the size of takeoff queues and the sequencing of aircraft within the queues.
In view of this control option, Airline Service Quality Performance (ASQP) data was studied in [11] and a simple dynamic queuing model for departure operations was developed and used to analyze airport surface operations. Based on the analysis results, simple departure control strategies were suggested for the purpose of alleviating surface congestion. As presented in [10] and [11], an important parameter in the problem of departure control appears to be the number N of aircraft that are present in the system while an aircraft is taxiing out from its gate to the assigned departure runway. It was realized that, as the number N increases, the expected value and variance of the taxi out time also increases, as shown in Figure 11 [2] for one year of data from Boston’s Logan airport.
Figure 11: Taxi out time as a function of airport congestion (BOS: 1997/09 – 1998/08)
In addition, for each airport and under any configuration, there is a runway saturation point beyond which there is no significant gain in takeoff rate even if controllers keep releasing more aircraft in the system, as shown in Figure 12 [2]. It is observed that, as controllers release more aircraft in the system, less than the released number of
Gate Mgr
• Taxiway congestion information • Downstream constraints and
needs (Flow Control Commands)
• Pushback schedule • Initial runway assignment
DEPARTURES
• “Ready for pushback” message (turnaround operations) • Estimated taxi-out times • Destination
AIRPORT GEOMETRY
• Gates layout • Taxiway layout • Holding pad information
AIRLINE SPECIFIC
• Hangars and towing operations • Schedule information
ARRIVALS
• Hand-off, outer marker and touch-down messages • Estimated taxi-in times • Gate assignments • Estimate time at gate
0 10 20 30 40 50 60 70 80 90 0 5 10 15 20 25 30 No. of Aircraft Taxiing Out
aircraft actually takes off and the remaining form congestion queues on the airport surface (also see [12]).
Figure 12: Takeoff Rate saturation point (BOS: 1997/09 – 1998/08)
Based on downstream requests the schedule can be adjusted through gate release control to feed the takeoff buffers with the requested number of aircraft. The system-wide objective of maximizing airport throughput is addressed and pre -allocated departure slots can be met. Engine-running times are also minimized and compliance with environmental emissions regulations is achieved, while gate-blocking delays are significantly reduced. Furthermore, the airlines benefit from fuel savings and late passenger / baggage accommodation by remaining at the gate until they can actually be accepted in the taxiway system, as opposed to pushing back on time and being delayed in holding pad areas or in taxiway queues.
3.4 The Taxiway Entry Manager
The Taxiway Entry Manager determines the sequence and timing of release from the ramp into the taxiway system for aircraft that have pushed back from their gates and entered the “ramp buffer” in Figure 3. It considers system objectives related to the total time that each aircraft spends on the ramp or taxiing with its engines running.
Functionality
The Taxiway Entry Manager can affect departure operations by regulating the flow of aircraft through the interface between the gates and the taxiway system, which was identified as another possible control point in the departure flow [7], [8]. The Taxiway Entry Manager provides a means of indirectly controlling the runway takeoff queues, by controlling the total number of departing aircraft that will be distributed to them. Note that, depending on the specific airport geometry and
complexity, this interface can take various forms. At Logan, there is a set of entry points to the taxiway system with little or no ramp area around the various terminals, while other airports, such as Atlanta Hartsfield or Chicago O'Hare, have a ramp area of considerable size adjacent to the terminals.
Figure 13: The Taxiway Entry Manager
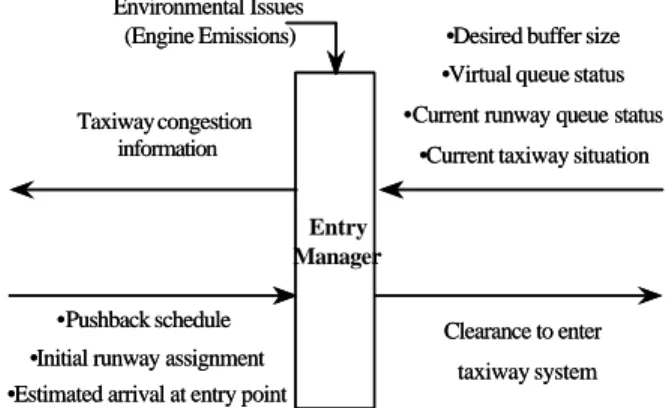
The current and projected taxiway situation (congestion levels) feeding back from simple observations or from sophisticated airport surveillance systems (in the future) and the takeoff queue (buffer) size feeding back from the Mix Manager are the most critical pieces of information for the Taxiway Entry Manager (Figure 13, top right data block). Accurate short -term estimation of pushback operations and prediction of the demand to enter the taxiway system must also be performed and the results fed into the Entry Manager, in order to avoid overloading the entry points (Figure 13, bottom left data block). All the above information is processed under the constraints of environmental regulations on aircraft engine emissions (Figure 13, top input). The outcome of this system element (Figure 13, bottom right data block) could be a feasible schedule of release times for aircraft to enter the taxiway system, which also meets the system objective of minimizing aircraft taxi times and therefore engine-running times, emissions and airline direct operating costs.
“Engine-start” time control is an additional issue pertaining to the environmental impact from aircraft engine noise and emissions, which deserves further examination. In current operations, only pushback and taxiway entry clearances are commanded by terminal ATC and the exact time that aircraft engines are started is left entirely to the pilot’s discretion. The Gate and Entry Managers could possibly schedule the movement of aircraft under the additional objective of postponing engine start times until as close to the taxiway entry clearances as possible. This is an example of the kind of
0 0.05 0.1 0.15 0.2 0.25 0.3 0.35 0.4 0.45 0.5 0 5 10 15 20 25 30 No. of Aircraft Taxiing Out
Takeoff Rate (per minute)
Environmental Issues (Engine Emissions) Entry Manager Clearance to enter taxiway system •Desired buffer size •Virtual queue status •Current runway queue status
•Current taxiway situation Taxiway congestion
information
•Pushback schedule •Initial runway assignment •Estimated arrival at entry point
Environmental Issues (Engine Emissions) Entry Manager Clearance to enter taxiway system •Desired buffer size •Virtual queue status •Current runway queue status
•Current taxiway situation Taxiway congestion
information
•Pushback schedule •Initial runway assignment •Estimated arrival at entry point
coordination between two tactical subcomponents, the Gate Manager and the Taxiway Entry Manager. At Logan, where ramp space is limited, the two subcomponents can be merged into a single tool.
Taxi path modifications – Runway reassignments
It should be noted that departing flights push back from their gate with an initial runway assignment, which they usually maintain until takeoff. Nevertheless, initial runway assignments and taxi paths are not always constant. When for example, a taxiway segment is unexpectedly blocked or there is a short-term or scheduled runway configuration change or the load in a certain takeoff queue is high, a runway reassignment may then be needed. Had the controllers had prior knowledge of the particular circumstances that led to the need for a runway reassignment, their pushback and taxiway entry clearance deliveries could have been different and also additional workload imposed on them and additional cost and delays imposed on the airlines could have been prevented. In the context of the Departure Planner, reassignment and rerouting may also be necessary in order to implement the Virtual Queue planned sequence, which is very dynamic.
Potentially, an additional subcomponent could be inserted at this point in the system architecture to assist controllers with their runway reassignment and taxi routing decisions and to help them implement the Virtual Queue. Such a component is not currently included in the proposed DP architecture because it is believed that the taxi ground operations are not amenable to automation and are better handled by the experienced air traffic controllers. In the current operational environment, operations at the gates / ramp and at the runway, are supported by automation systems, such as CTAS and SMA, which are already in place and can be interfaced to the proposed DP components. On the contrary, automation during taxiing is hindered by the lack of surveillance information. In fact, in managing taxi operations, air traffic controllers obtain (visually) downstream information regarding the size and sequence of each takeoff queue, as well as the current status of each of the available runway queues. Such information can possibly come from downstream DP components such as the Mix Manager (see next section 3.5).
3.5 The Mix Manager
The Mix Manager regulates the release of departing aircraft from each “runway buffer” onto the corresponding runway (runway A or B in Figure 3) as well as controls the release of aircraft from the runway crossing queues building up on the taxiway segments.
The coordination of operations on dependent runways and the mixing of arrivals, departures and crossing operations on a single runway are its main tasks.
Functionality
Air traffic controllers usually prefer to assign arrivals and departures to different runways. However, this is not always feasible, especially in tightly constrained airports such as Boston Logan. For many configurations, the runway resource utilized by departing aircraft is shared with arriving aircraft, which in most cases have priority over departures. In addition, the runway system is frequently shared with taxiing aircraft that have to cross active runways. As illustrated in Figure 14, the controllers often have to introduce gaps in the arrival stream in an effort to accommodate departures between arrivals and to allow taxiing aircraft to cross active runways. Sharing of the runway resources introduces a strong coupling between the arrival and the departure streams [6], [7], [8]. This suggests that we must consider and manage airport runway resources as sets of dependent runways, as opposed to individual runways.
Figure 14: Runway Operations Schedule: Mixing of Arrivals, Departure and Runway Crossings
Figure 15 describes the interaction of the Mix Manager with the rest of the aircraft flow at an airport system. As suggested it is the connective component between terminal airspace traffic (departures ascending within the terminal airspace and arrival flow approaching the airport) and airport surface traffic (the set of departing or arriving aircraft that are physically present on the taxiway system).
As shown in Figure 15, working under a given runway configuration and a specific mode of operations (Figure 15, top data block), the Mix Manager processes the following inputs:
• Projected takeoff demand information, based on inputs from the actual and projected pushback schedule (Figure 15, bottom left data block).
• Projected landing demand information from the final approach arrival queues that are forming in the terminal area (Figure 15, top right data block).
Rwy Crossing Queue
Takeoff Queue Arrivals Departures Runway Crossing Gap created between arrivals
• Data on downstream constraints, such as miles in trail and departure fix capacity (Figure 15, top right data block).
Collaborative Decision-Making (CDM) can play a vital role at this point, in providing accurately updated demand information (cancellations and delays) to the air traffic controllers and to the mixing function of the Mix Manager.
Figure 15: The Mix Manager
The main output generated from the Mix Manager is the suggested schedule of aircraft release from the takeoff and runway crossing queues (Figure 15). Requests for gaps in the arrival flow could be given to the TRACON controllers, in order to implement the suggested takeoff releases. In addition, specific tactical suggestions on the sequence and size of takeoff queues can be communicated to the tower controllers as a basis for carrying out efficiently the gate pushback and taxiway entry processes.
Supporting Analysis
In Logan configuration 22R-22L-27, which was presented in Figure 1, arrivals using runways 27 and 22L have to cross runway 22R to reach the terminal area. Crossing aircraft queue in the taxiway segments between runways 22R and 22L but when there is no more space for queuing aircraft, the departure stream on 22R has to be interrupted for crossings to occur and for making runways 22L and 27 available for further landings.
Figure 16 clearly demonstrates how takeoff operations on runway 22R are affected by the presence of crossing aircraft. When one or more crossings were operated between successive takeoffs on 22R, the mean time between the two takeoff clearances for the data sample presented is 1 min and 59 seconds. The mean value drops to only 45 sec when successive operations occur
with no crossings interjected between them. The overall mean time for the whole data set is 1 min and 10 sec.
Figure 16: Runway Crossing Effect on Inter-Takeoff Clearance Time (Source: Local Controller
Clearances, Runway 22R, Logan Airport, 12-2-1998, 4-9PM)
The Departure Planner cannot be developed independently from CTAS or other arrival automation tools, which carry information critical to DP for successful configuration planning and arrival/departure mixing. In fact, the arrival-departure interaction introduces a new complex challenge for existing tools, such as CTAS, which will now have to be enhanced to take departures into account. DP can have important inputs to CTAS and especially Active FAST (Final Approach Spacing Tool), such as the runway crossing and takeoff queue information. These inputs can then be used to determine the most appropriate sequencing and tactical spacing of arrivals (introducing the necessary gaps in the arrival stream, Figure 14).
4 Conclusions
The Departure Planner, as presented in this paper, is intended to assist short -term planning operations at major commercial airports. Its emphasis will be on supporting Air Traffic Management in the next 30 to 45 minutes from the current time, but it also has a component that does planning with a time-horizon of a few hours. It consists of a set of functional components; some used for strategic ATM operations such as configuration planning and some for tactical departure planning. DP is not necessarily viewed as a fully automated system. These components could potentially become automation tools used by the controllers to manage the various physical queues existing in the flow of departing aircraft, without increasing workload levels.
Available Runways & Operating Mode
*
• Estimated and actual runway buffer size and sequence • Estimated arrival time at runway • Aircraft readiness • Runway status • Wake vortex separation
• Requested runway buffer size and departure sequence by aircraft type and destination to maximize system throughput
• Arrival demand
• Actual and estimated gaps between arrivals • Downstream constraints
(Miles In Trail, departure fix congestion, specific departure time requests)
• Release from take-off queue • Release for runway crossing • Requested gaps between arrivals
Mix Mgr for each set of dependent runways 0 10 20 30 40 50 60 00:20 00:30 00:40 00:50 01:00 01:10 01:20 01:30 01:40 01:50 02:00 02:10 02:20 02:30 02:40 02:50 03:00 03:10 03:20 03:30 03:40 03:50 04:00 Inter Takeoff Clearance Time (min:sec)
Frequency Successive takeoffs (Mean = 45 sec) Runway crossings between takeoffs (Mean = 1:59 min) Total Mean = 1:10 min
5 Acknowledgements
This research was supported in part by NASA, under grant NAG 2-1128. The authors would also like to acknowledge the cooperation and courtesy of the Boston Tower and TRACON in providing access for field observations.
6 References
1 BALL M., HOFFMAN R., Collaborative
Decision-Making in Air Traffic Management: A Preliminary Assessment, prepared by the National Center of
Excellence in Aviation Operations Research, August 1998
2 BOEHME, D., Improved Airport Surface Traffic
Management by Planning, Problems, Concepts and a Solution – TARMAC. H. Winter (Ed.): Advanced
Technologies for Air Traffic Flow Management. DLR – Seminar Series, Bonn, Germany, April 1994, in Lecture Notes in Control and Information Sciences, Springer Verlag, ISBN 3540198954
3 CLARKE, JOHN-PAUL, unpublished research work, International Center for Air Transportation, MIT, September 1999
4 DELCAIRE, B., FERON, E., Dealing with Airport
Congestion: Development of Tactical Tools for the Departure Flows from a Large Airport, SM Thesis,
Technology and Policy Program, M. I. T., Cambridge, MA
5 FERON, E. et al., The Departure Planner: A
Conceptual Discussion, Massachusetts Institute of
Technology, December 1997
6 IDRIS, H. et al., Identification of Flow C onstraint and
Control Points in Departure Operations at Airport Systems, AIAA 98-4291, pp.947-956 in proceedings
of the AIAA Guidance, Navigation and Control conference, Boston, MA, August 1998
7 IDRIS, H. et al., Observations of Departure Processes
at Logan Airport to Support the Development of Departure Planning Tools, 2nd USA/EUROPE AIR TRAFFIC MANAGEMENT R&D SEMINAR, Orlando, 1st- 4th December 1998
8 IDRIS, H. et al., Observations of Departure Processes
at Logan Airport to Support the Development of Departure Planning Tools, Air Traffic Control
Quarterly Journal, Special Issue in Air Traffic Management, Volume 7, Number 4, pp. 229 – 257, 1999
9 IDRIS, H., Diagnosis and Empirical Analysis of
Departure Operations at a Major Airport, Ph.D.
Thesis, Department of Aeronautics and Astronautics,
M. I. T., Cambridge, MA, September 2000. In preparation.
10 PUJET, N., DELCAIRE, B., FERON, E., Input-Output
Modeling and Control of the Departure Process of Congested Airports, Air Traffic Control Quarterly
Journal, Volume 8, Number 1, pp. 1 – 32, 2000
11 PUJET, N., Modeling and Control of the Departure
Process of Congested Airports, Ph.D. Thesis,
Department of Aeronautics and Astronautics, M. I. T., Cambridge, MA, September 1999
12 SHUMSKY, R. A., Real-time forecasts of aircraft
departure queues, Air Traffic Control Quarterly
Journal, Volume 5, Number 4, pp. 281 – 308, 1997 13 VÖLCKERS, U. et al., Contributions of DLR to Air
Traffic Capacity Enhancement within a Terminal Area, AGARD meeting on ‘Machine Intelligence in
Air Traffic Management’, May 1993
B
IOGRAPHICALN
OTESIoannis (Yiannis) Anagnostakis is a Research Assistant and a Ph.D. candidate in the International Center for Air Transportation (ICAT) laboratory of the Department of Aeronautics and Astronautics at MIT. He obtained his B.Sc. from the National Technical University of Athens, Greece in 1992 and his M.Sc. from MIT in 1994. Between September 1994 and 1995, he worked as a researcher in Air Traffic Control in the Electronic Navigation Research Institute of the Japanese Ministry of Transport in Tokyo, Japan.
John-Paul Clarke is Charles Stark Draper Assistant Professor of Aeronautics and Astronautics at the Massachusetts Institute of Technology (MIT). Prof. Clarke received his SB (1991), S.M. (1992) and Sc.D. (1997) from MIT, and has been a researcher at the NASA Jet Propulsion Laboratory and a visiting scholar at the Boeing Company. His research and teaching focus primarily on the environmental impact of aviation; the application of advanced technology to aircraft operations and air traffic control; and the modeling, design, and operation of complex systems. Dr. Clarke is a member of the American Institute of Aeronautics and Astronautics (AIAA), Institute of Navigation (ION) and Sigma Xi. He consults on matters of airport noise and aircraft noise modeling, and serves on the Society of Automotive Engineers (SAE) Aircraft Noise Committee and on the International Civil Aviation Organization (ICAO) Committee on Aviation Environmental Protection (CAEP) Sub-Committee on Aircraft Noise Modeling.