HAL Id: hal-02346220
https://hal.univ-guyane.fr/hal-02346220
Submitted on 2 Dec 2020
HAL is a multi-disciplinary open access archive for the deposit and dissemination of sci-entific research documents, whether they are pub-lished or not. The documents may come from teaching and research institutions in France or abroad, or from public or private research centers.
L’archive ouverte pluridisciplinaire HAL, est destinée au dépôt et à la diffusion de documents scientifiques de niveau recherche, publiés ou non, émanant des établissements d’enseignement et de recherche français ou étrangers, des laboratoires publics ou privés.
Exceptional rates and mechanisms of muddy shoreline
retreat following mangrove removal
Guillaume Brunier, Edward Anthony, Nicolas Gratiot, Antoine Gardel
To cite this version:
Guillaume Brunier, Edward Anthony, Nicolas Gratiot, Antoine Gardel. Exceptional rates and mecha-nisms of muddy shoreline retreat following mangrove removal. Earth Surface Processes and Landforms, Wiley, 2019, 44 (8), pp.1559-1571. �10.1002/esp.4593�. �hal-02346220�
Exceptional rates and mechanisms of
muddy shoreline retreat following
mangrove removal
Guillaume Brunier, Edward J. Anthony , Nicolas Gratiot, Antoine Gardel
First published: 02 February 2019 https://doi.org/10.1002/esp.4593 Abstract
Probably the largest regular shoreline fluctuations on Earth occur along the 1500 km-long wave-exposed Guianas coast of South America between the mouths of the Amazon and Orinoco Rivers, the world's longest muddy coast. The Guianas coast is influenced by a succession of mud banks migrating northwestward from the Amazon. Migrating mud banks dissipate waves, partially weld onshore, and lead to coastal progradation, aided by large-scale colonization by mangroves, whereas mangrove-colonized areas between banks (inter-bank areas) are exposed to strong wave action and undergo erosion. On large tracts of this coast, urbanization and farming have led to fragmentation and removal of mangroves, resulting in aggravated shoreline retreat. To highlight this situation, we determined, in a setting where mangroves and backshore freshwater marshes have been converted into rice polders in French Guiana, shoreline change over 38 years (1976-2014) from satellite images and aerial orthophotographs. We also conducted four field experiments between October 2013 and October 2014, comprising topographic and hydrodynamic measurements, to determine mechanisms of retreat. The polder showed persistent retreat, at peak rates of up to -200 m/yr, and no recovery over the 38-year period of monitored change. Notwithstanding high erosion rates, mangrove shorelines show strong resilience, with recovery characterized by massive accretion. Retreat of the polder results in a steep wave-reworked shoreface with a lowered capacity for bank welding onshore and mangrove establishment. Persistent polder erosion is accompanied by the formation of a sandy chenier that retreats landwards at rates largely exceeding those in inter-bank situations. These results show that anthropogenic mangrove removal can durably modify the morphodynamics of muddy shorefaces. This limits the capacity for shoreline recovery and mangrove re-establishment even when there is no sustained long-term deficit in mud supply, as in the case of the Amazon-influenced Guianas coast. © 2019 John Wiley & Sons, Ltd.
Introduction
Mangroves are inter-tropical coastal forests that develop on muddy shores. They contribute to coastal sedimentation by trapping sediment through their complex aerial root structure (e.g., Carlton, 1974; Alongi, 2008; Victor et al., 2006), and to coastal protection by dissipating waves and currents (Massel et al., 1999; Quartel et al., 2007; Gedan et al., 2011; Kazimi et al., 2018). Mangroves are a particularly important component of the 1500 km-long Guianas coast of South America between the mouths of the Amazon and Oronoco Rivers (Figure 1), where they play an active role in coastal advance by colonizing and stabilizing the inner parts of mud banks (Proisy et al., 2009; Anthony et al., 2010, 2014; Gensac et al., 2011; Toorman et al., 2018). Shoreline changes along the Guianas coast are controlled by the migration, towards the mouths
of the Orinoco River, of large mud banks that transport a fraction of the mud (~20%) supplied by the Amazon (i.e. 750 to 800 × 106 tons/year, Martinez et al. (2009)). The overarching expressions of these shoreline changes are onshore welding of the inner part of the mud bank, its rapid colonization by mangroves, commonly over several tens of km2 a year, bank consolidation (termed ‘bank’ phase), and equally rapid shoreline erosion (‘inter-bank’ phase) a few years later (Gardel and Gratiot, 2006) in sectors between banks exposed to strong wave action. Banks dissipate waves, aided by mangroves. By promoting wave-energy dissipation, mangroves contribute to welding of the inner parts of banks to the terrestrial shoreline (their ‘land-building’ role) and slow down the erosion process (their coastal protection role) until the next bank phase (Anthony and Gratiot, 2012). The ensuing spatially and temporally varying shoreline changes result from complex interactions between hydrodynamic, morphodynamic, rheological and biological processes (Proisy et al., 2009; Gensac et al., 2011; Anthony et
al., 2014; Gratiot and Anthony, 2016). The extent to which the shore-welded part of a mud bank is preserved from erosion in the inter-bank area during the bank-migration process determines the degree of coastal progradation generated by each bank (Allison and Lee, 2004; Anthony et al., 2010, 2014). Each inter-bank phase results in the partial, or rarely, total removal, of the coastal stratigraphic package built during accretionary bank phases, signifying that there is a net coastal plain growth with each cycle (Allison and Lee, 2004). Progradation of the Guianas coast associated with mud-bank sedimentation aided by mangrove ‘land-building’ over the last 5-6000 years has generated a coastal plain several kilometres wide in places (Augustinus, 1978, 2004; Augustinus et al., 1989; Prost, 1989; Wong et al., 2009).
Figure 1
General overview maps of the Guianas coast showing regional setting and location of study site (a, b, c); close-up view of the polder and field survey site (d); aerial photograph showing polder plot undergoing erosion, comprising a muddy foreshore and an overlying sandy chenier (e); cross-section of typical stratigraphic units in Western French Guiana (from Prost, 1989) (f). ARD: Amazon River delta; ORD: Orinoco River delta; MBB: Mud-bank migration belt; FG: French Guiana; S: Suriname; G: Guyana; VN: Venezuela.
In Suriname and especially Guyana, large tracts of the muddy Holocene coastal plain built from mud supplied by the Amazon have been urbanized or converted to rice farms and, increasingly, shrimp farms, implying the emplacement of polders delimited by dykes and canals (Anthony
and Gratiot, 2012; Anthony, 2016). Mangroves, and, in places, freshwater swamps that developed behind cheniers, have been removed to make place for cities, such as Georgetown in Guyana, urban expansion seaward as in Paramaribo in Suriname, and for rice fields and shrimp farms, as along large tracts of the coast of Guyana. This situation embodies a paradox as all these transformations result in recourse to protection against the sea by relatively costly engineering structures in lieu of the natural protection mangroves provide.
Once mangroves and freshwater swamps are removed, engineering structures emplaced to stabilize the shoreline alter wave dissipation and hinder muddy sedimentation, and this can result in aggravation of coastal retreat (Anthony and Gratiot, 2012; Winterwerp et al., 2013). However, the processes involved in the erosion of modified shorelines no longer protected by dykes have not been studied on these coasts. The aims of this manuscript are two-fold: (1) analyze rates of multi-decadal shoreline change for areas of mangrove, freshwater marshes formed behind cheniers, and polders where the original mangrove and marsh vegetation has been removed, (2) describe the mechanisms of substrate erosion in areas of mangrove removal (polders) on the basis of shorter-term (one year) field experiments. The study site was originally colonized by sea-front mangrove forests backed by brackish and freshwater marshes, and was reclaimed in the 1980s to develop rice cultivation in French Guiana, in the same way as the much more enterprising rice ventures all along the Suriname and Guyana coastal plains. Modifications of the muddy mangrove shoreline have been much less undertaken in French Guiana, a European Union territory, where mangrove forests come under the directives of wetland protection. We quantify rates of regular shoreline change that are exceptional at the world scale, and contribute here to a better knowledge of the erosional processes aggravated by empoldering on this dynamic muddy coast, and their temporal and spatial variability.
Study area and regional context
The study site is part of a 50 km-long empoldered portion of the French Guiana coastal plain between the mouths of the Organabo and Mana Rivers (Figure 1). It is currently affected by three mud banks that have been migrating alongshore over the last 38 years, with phases of coastal advance alternating with retreat and stability. These phases are presented in the results, and discussed thereafter. Mud-bank migration and the attendant coastal changes are mainly controlled by the offshore wave climate (Gratiot et al., 2007; Walcker et al., 2015), which is dependent on seasonal variations in trade winds and rainfall. The regional climate comprises a dry season with 30 to 150 mm of monthly rainfall from August to the end of November, and a rainy season with 300 to 500 mm the rest of the year. The latter season is characterized by peak waves in January with significant wave heights close to 2 m and peak periods of 9 s that decrease to dry-season values of 1.3 m and 7 s in July, with minimal wave heights of about 1 m prevailing in August (Gratiot et al., 2007). Tidal data provided by the French Service
Hydrographique et Océanographique de la Marine (SHOM) show a semi-diurnal regime with a mesotidal spring-tide range of 3.5 m. Decadal-scale hydrodynamic changes along this coast have been shown to be largely related to the influence of the North Atlantic Oscillation on waves, which generate variations in the size and mobility of mud banks (Walcker et al., 2015). The polders are part of a low composite Pleistocene and Holocene coastal plain 10 to 20 km wide (Figure 1) comprising Amazon mud and sandy/shelly cheniers. In French Guiana, the ‘Old’ (Pleistocene) coastal plain comprises large cheniers of coarse white sand with podzols overlying muddy deposits, and correspond to the Coswine unit in the local geological nomenclature (named the Coropina unit in Suriname). The ‘Young’ coastal plain is represented by Holocene-to-modern mud and narrow cheniers of finer sand, dominantly quartz in French Guiana but rich in shells in Guyana. The cheniers are separated by swales comprising fresh and brackish water marshes and mangrove forests, the latter acting especially as the seafront buffer during inter-bank erosion.
The French Guiana polder project, funded by the European Council and the French Government, was inspired by the Dutch model of rice production in neighbouring coastal Suriname. In the course of this operation, from the early 1980s to the 1990s, the mangrove vegetation, freshwater marshes, and underlying original acidic soils (mainly peat layers) were massively removed in order to flatten the land. 28 rows of polder plots 500 m-wide and 250 m-long in the a250 m-longshore and cross-shore directions were enclosed by mud dykes. The mean plot elevation was 1 m enclosed by 2 m-high dykes. Rice production was carried out for about 20 years up to the early 2000s before salinity intrusion in the canals, facilitated by inter-bank erosion, rendered these polders unsuitable for rice cultivation. The current polder shoreline exhibits the following erosion features (Figure 1): (1) an intertidal mud platform cut into an erosion embayment and bounded by erosional bluffs, (2) an overlying chenier encapsulated inside each plot by dykes and (3) the former cultivated polder in the backshore.
Methodology
Analysis of shoreline change
Shoreline change was analysed from the interpretation of satellite images and aerial photographs covering 38 years (1976 to 2014). Six pictures of varying spatial resolution were compiled from various databases (Table 1): 30 m/pixel for Landsat 5 TM images, 20 m/pixel for SPOT 5 images, and 0.5 m/pixel for aerial photographs. We used the Universal Transverse Mercator (UTM) 22 North zone and World Geodetic System 1984 (WGS 84) ellipsoid for coordinate referencing.
Data source Date Resolution Archive
Aerial photographs 17/08/1976 0.5 m IGN
Landsat 5 TM 23/07/1987 30 m Earth Explorer (USGS)
Landsat 5 TM 21/11/1999 30 m Earth Explorer (USGS)
Spot 4 26/11/1999 20 m CCOG
Spot 5 11/11/2006
05/08/2006 30/08/2006
10 m CNRS French Guiana office
Orthophotographs 01/11/2012 0.5 m RNA
Landsat 8 13/04/2014 30 m Earth Explorer (USGS) For each date, the shoreline position was defined as a vector line using GIS ArcGIS desktop® v10.2. The shoreline ‘markers’ in this muddy coastal context were defined, depending on image resolution, as the limit between the sea and the mangrove fringe, or brackish-water vegetation front and active cheniers in the empoldered area.
Shoreline change was estimated through a statistical analysis of a cross-shore change rate, the End Point Rate (EPR) method of the Digital Shoreline Analysis System v4.3 (DSAS, Thieler and Danforth, 1994) toolbox for ArcGIS desktop® v10.2. This method is commonly used in numerous coastal change studies (e.g., Acciarri et al., 2016; Jonah et al., 2016). Change rates, in metres per year, are calculated as the variation between two shorelines along cross-shore transects generated by DSAS (Figure 2), divided by the time lapse between two images in decimal years. We used a relatively close transect spacing of 200 m in order to obtain a high-resolution view of coastal changes over the study period.
Figure 2
Illustration of shoreline change analysis using DSAS for ArcGIS Desktop 10.2.
The shoreline change-rate analysis was complemented by a determination of the intertidal limits of mud banks on each image to assess mud-bank migration rates. Three mud banks were identified over the 60 km of study shoreline. Identification of mud banks from optical images is a rather delicate operation fraught with difficulties, but the authors have years of experience of work on these mud banks.
Field surveys
Four field experiments were conducted in October 2013, March 2014, July 2014, and October 2014. The experiments were designed with the aim of gaining an understanding of the short-term morphodynamics and evolution of the polder plot over a one-year period covering the seasonal wave-climate variability and a variety of tidal range situations. A preliminary scrutiny of the high-resolution orthophotographs indicated a relatively homogeneous pattern along the
empoldered stretch of coast, which is characterized by a cell structure for each polder enclosed by cross-shore dykes. Consequently, we chose to study a polder located in the middle of the empoldered sector (Plot 10 from the East, Figure 1, map d). This plot also had the advantage of being easy to reach using a four-wheel drive vehicle at low tide.
Field monitoring consisted first in quantifying the morphological evolution of the plot from topographic surveys using a Real-Time-Kinematic Differential Global Positioning System (RTK-DGPS) Trimble R8 (Figure 3). We distinguished, over the plot, the chenier, which was monitored in continuous-acquisition mode, and the inter-tidal mud platform and its erosional features, which were surveyed based on point acquisition. The vertical uncertainty was estimated to be 3 cm. The survey data were referenced in UTM 22 North zone WGS 84 for planar coordinates and Earth Gravitational Model 1996 (EGM 96) geoid for elevation. From the topographic data, we created Digital Elevation Models (DEM) for each survey using ArcGIS desktop® v10.2. The method was based on Delaunay triangulation between points. The result was a Triangle Irregular Network (TIN) where a raster file was interpolated using the natural neighbour method. The DEM included the dykes and rice polder elevation as the onshore limits of the plot. We compared the DEMs in order to assess the sediment balance at the plot scale. For this, we compared the sediment volume above a plane, arbitrarily fixed at an elevation of -1 m for each DEM. Bedforms and erosional features were observed and measured during each survey.
Figure 3
Field survey methods: (a) example of a DEM produced from field surveys using RTK-DGPS (b). The cross-shore profile shown was used to determine the wave incidence θ from wave direction. Pressure sensors (c) were deployed along a cross-shore transect on the mud foreshore subject to wave attack.
Incident wave energy and dissipation were estimated in order to assess wave impacts on the inter-tidal platform and the chenier. To this end, we deployed, for three or four days each time, four to five NKE SP2T pressure sensors initially along one (October 2013, April 2014), and then three (July 2014, October 2014), equally-spaced cross-shore transects (Figure 3). The sensor locations were monitored during the RTK-DGPS surveys. The most offshore sensors were continuously in the subtidal zone while the others were exposed at low tide. The sampling frequency was fixed at 2 Hz (0.5 s) which is a commonly used frequency for gravity-wave
monitoring in shallow waters. The pressure sensor accuracy is 0.02 m and wave heights and water levels under this value were neglected. For the wave-data analysis, we applied linear theory despite the nonlinearities that can be induced by shallow water. However, this approach is considered as a good first approximation (e.g., Paquier, 2014). Wave spectra were calculated over 20-minute bursts (2048 samples) using Fast Fourier transforms, and a 600 s Hanning window with 75% overlapping. The limit between gravity and infra-gravity wave domains was fixed at 0.05 Hz. For each burst, the mean water level (h) and the significant wave height (Hs) in metres, and the peak period (Tp), in seconds, were calculated.
Offshore wave climate conditions from October 2013 to October 2014 were determined from hindcast re-analysis data provided by the United States National Ocean and Atmospheric Agency (NOAA) using the Wave Watch III (WWIII) global model. We downloaded directions, significant wave heights and periods predicted for swell, wind-waves and the total sea-state wave climate. We also calculated the wave incidence angle, θ, relative to the polder plot shore from WWIII wave directions (Figure 4). We considered an incidence θ normal to the shore of (0°) using a cross-shore profile located in the centre of the plot. θ ranged from -90° (NW to NE quadrant) to 90° (NE to SE quadrant). The tidal levels during the surveys were downloaded from the predictive model of the French Navy Hydrographic office (SHOM) for Hattes beach (Maroni River estuary) near the study site.
Figure 4
Shoreline change analysis along 60 km of coastline over the period 1976 to 2014 and graphs of change rates (in m/yr) associated with mud banks (MB1, MB2) and inter-bank phases for four intervals: (a) 1976-1987; (b)1987-1999; (c) 1999-2006; (d) 2006-2014. Note the
persistence of erosive ‘inter-bank’ conditions in the polder sector and the ‘bank’ recovery and massive advance of mangrove-colonized shoreline sectors.
38-year shoreline changes
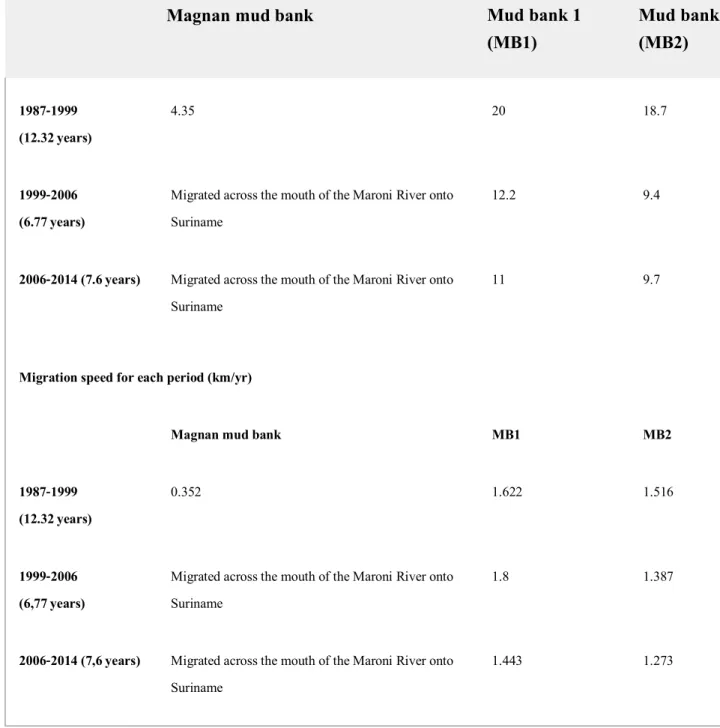
The satellite images highlight the westward migration of three successive mud banks since the 1970s, namely from west to east, the Magnan, Organabo (MB1) and Iracoubo (MB2) banks. Migration speeds have been extremely variable over the nearly four decades covered by the images (Table 2). From the analysis of shoreline changes, the coastal dynamics of the study
area can be considered under four main periods, each lasting approximately 10 years. The shoreline changes characterizing each of these periods are shown for the three coastal environments: mangroves, freshwater marshes, polders (Figure 4).
Table 2. Mud-bank migration distances and rates in km/year for the period 1987 to 2014
Migration distance along the coast (km)
Magnan mud bank Mud bank 1 (MB1) Mud bank 2 (MB2) 1987-1999 (12.32 years) 4.35 20 18.7 1999-2006 (6.77 years)
Migrated across the mouth of the Maroni River onto Suriname
12.2 9.4
2006-2014 (7.6 years) Migrated across the mouth of the Maroni River onto Suriname
11 9.7
Migration speed for each period (km/yr)
Magnan mud bank MB1 MB2
1987-1999 (12.32 years)
0.352 1.622 1.516
1999-2006 (6,77 years)
Migrated across the mouth of the Maroni River onto Suriname
1.8 1.387
2006-2014 (7,6 years) Migrated across the mouth of the Maroni River onto Suriname
1.443 1.273
The period 1976 to 1987 corresponded with the early phase of empoldering and was characterized by a large inter-bank zone in the west and an approaching mud bank (MB1) in the east. Inter-bank erosion of the mangrove-colonized shoreline fronting the polders and
marshes (located a few kilometres inland at the time) was relatively moderate to severe, not exceeding -100 m/yr (Figure 4a). MB1 was accompanied by onshore welding (kilometre points (PK) 0-10), mangrove colonization and massive accretion exceeding 100 m/yr in places. Between 1987 and 1999, erosion became generalized throughout the study site with maximum values of over -100 m/yr in alternating sectors of shore-exposed marsh (as a result of inter-bank mangrove removal) and mangroves. Erosion was moderate throughout the rest of the shoreline, protected by the westward migrating MB1 (Figure 4b). It is interesting to note that this generalized erosion, despite the passage of MB1, is akin to the persistence of inter-bank conditions. From 1999 to 2006, the pattern was more irregular alongshore, with massive progradation following mangrove colonization of mudflats associated with a new mud bank, MB2 between PK 5 and 15 (Figure 4c). In the inter-bank area between MB1 and MB2, erosion began to strongly impact the polders from the east with shoreline retreat rates of 150 to 200 m/yr. A large and continuous sandy chenier appeared following the erosion of old inland cheniers exposed to waves as the shoreline retreated. Erosion attained its maximum, over the 38 years of shoreline change monitoring, in the wave-exposed marshes and polder sector, during this phase, whereas progradation occurred further west (PK 40-45), favoured by MB1. Between 2006 and 2014, the shoreline largely recovered, with progradation and mangrove colonization along much of the former marsh area, but erosion remained intense in the inter-bank area between MB1 and MB2, still exceeding -100 m/yr along several polder transects (Figure 4d).
Field observations of large-scale polder erosion
At the start of the field experiments in October 2013 the polder plot was in severe erosion. Three morphological units were observed in the field and are depicted in Figure 5:
a. an inter-tidal platform of highly bioturbated Holocene clay attacked by waves. This unit exhibited a concave profile or an erosion scarp in the sectors highly impacted by wave attack, with mud pebbles accumulating at the base of this scarp. Wherever exposed by erosion, the Holocene clay deposits were indurated to depths of 20 to 30 cm with traces of biofilms at the surface. The top of the platform comprised two layers: a 10 to 15 cm-thick peat layer inherited from the old swamp, and a layer (≈ 50 cm) of soft mud corresponding to the soil of the former rice field. The platform was cut in the western part of the polder by a tidal channel bounded by a dyke that was being broken down by erosion;
b. a sandy chenier overlying the platform and formed at the limits of swash runup at high tide. The chenier was 25 m wide and composed of medium to fine sand with a D50 of 170 µm (Créocéan, 2008).
c. a polder backshore zone behind the chenier corresponding to the former rice field. This unit was subject to overwash by waves as the tide rose, and then submerged by tidal flow at high tide. The high-tide water flux created channels against the dykes. This area was colonized by sparse mangrove stands in places.
Figure 5
Overview of the surveyed polder on 25th March 2014: (a) DEM; photographs: (b) erosion embayment with wave-reworked steep bluff and mud pebbles from bluff reworking; (c) close-up view of fresh and clear incisions at the top of the Demerara mud deposit (light grey mud layers). These deposits exhibit a peat layer 2 to 3 m in front of the bluff that is being progressively eroded at high tide; (d) washovers indicative of chenier onshore migration during high tide.
The WWIII hindcast data highlight a typical seasonal wave climate over the period October 2013-October 2014 (Figure 6; Table 3): relatively high waves from October to July associated with the onset and strengthening of the trade winds and North Atlantic swell, and a dry season from July to October 2014 with lower waves. Figure 6 shows an example of in situresults from the pressure sensors, focused on a tidal cycle, and the relevant offshore WWIII hindcast data for the measurement period. The sensors located at the seaward edge of the mud platform showed relatively high Hs values that increased as the tide rose, thus highlighting a clear tidal modulation of incident waves. Hs over the platform showed a clear decrease compared to values measured at the seaward edge of the platform. From the results of these surveys, we deduced that during the beginning of the flood or at the end of the ebb, the seaward edge of the platform was affected by wave breaking, leading to continuous excavation of the substrate. During tidal submergence, the platform was flooded, and, depending on the water level and on platform morphology, the breaker zone moved from the seaward edge to the landward edge. Collapsing waves propagated over this zone, and this could explain the high and variable Tp values (Figure 6). The chenier was essentially affected by runup and overwash, and occasionally flooded briefly during high water levels.
Figure 6
Offshore wave climate during the survey period (a), and topographic profile along transect of deployment of pressure sensors and in situ hydrodynamic parameters measured by the sensors during a tidal cycle on July 1, 2014 (b). Also added are the erosion rates in m3 for each survey period.
Table 3. Average wave parameters: direction, significant height, peak period and incidence
angle, for each field survey
October 2013 - March 2014 March - July 2014 July - October 2014
Wave direction in degrees from North
October 2013 - March 2014 March - July 2014 July - October 2014
Significant wave height (Hs) 1.7 1.4 1
Peak wave period (Tp) 9.1 8.3 8.9
Wave incidence angle (θ) +17.2 +18 +20.6
The surface of the polder plot during the survey periods was subjected to intense erosion (Figure 7 and Table 4). Net surface and sediment losses of -70,000 m2 and -177,000 m3respectively occurred over a period of 380 days. This represents an average rate of -183 m2and -466 m3 per day. However, we noted a clear seasonal variability in erosion intensity. This, and a detailed description of the evolution of the surface of the polder, are presented below.
Figure 7
Polder sectors (a1); wave climate parameters (WWIII) offshore of the polder during the survey period (a2); DEMS of the polder from successive surveys (a3-a6); and volume losses over the one-year survey (b). The eastern sector is more exposed to waves and has eroded faster.
Table 4. Surface and volume losses for each survey period and for plot sectors from
comparison of DEM
Period Overall surface loss (m2) Daily surface loss (m2) Overall volume loss (m3) Daily volume loss (m3) Eastern sector October 2013 - March 2014 -17,651 -106 -44,676 -269 March 2014 - July 2014 -15,830 -161 -34,509 -352. July 2014 - October 2014 -9,594 -83 -27,826 -240 October 2013 - October 2014 -43,075 -113 -107,010 -282 Western sector October 2013 - March 2014 -9,062 -55 -28,638 -172 March 2014 - July 2014 -9,726 -99 -25,243 -258 July 2014 - October 2014 -7,796 -67 -16,114 -139 October 2013 - October 2014 -26,584 -70 -69,995 -184 Entire plot
Period Overall surface loss (m2) Daily surface loss (m2) Overall volume loss (m3) Daily volume loss (m3) October 2013 - March 2014 -26,713 -161 -73,313 -442 March 2014 - July 2014 -25,556 -261 -59,752 -610 July 2014 - October 2014 -17,390 -150 -43,940 -379 October 2013 - October 2014 -69,659 -183 -177,005 -466
The polder showed a dissymmetric erosion of the inter-tidal platform and chenier retreat (Figure 6). In March 2014, large erosion embayments, up to 50 m wide, appeared in the eastern sector. The erosion scarps were up to 1 m high, and fresh incision marks indicated clearly that large blocks of the mud substrate were being cut and reworked by waves, resulting in the formation of mud pebbles that accumulated in the bottom of the embayment. The face of the scarp and the bioturbated mud layer showed alveolar breaking along an exposed dense network of small burrows (Figure 5), whereas the top of the scarp exhibited mud cracks created following exposure to the sun and heat. These cracks evolved into fractures extended by wave action, resulting in block falls. The peat layer was abraded by waves at its stratigraphic plane 5 m from the scarp. However, the thickness of the layer appeared relatively insensitive to wave action. The muddy former rice-field soils did not resist wave reworking. The chenier migrated over these soft deposits, which were exposed progressively as more dewatered and consolidated mud on the foreshore in the wake of chenier migration. The shape and rate of migration of this sand body were strongly conditioned by the erosion scarp. Landward migration in front of the eroded embayment and a tidal channel was more rapid than in the central part and, in these zones of faster migration, the chenier was flattened by overwash at high tide. The beach profile was globally reflective with a relatively steep beach face slope where the mud platform was wider, and a gentler more dissipative face where the platform was more severely eroded. To summarize, the surface and volume losses corresponded to average removal rates of
-160 m2/day and -442 m3/day, respectively, over a period of 166 days but with a strong dissymmetry between the eastern and western part of the plot (Table 4).
As shown in Figure 7, at the end of the June-early July 2014 experiment, the erosion dynamic described above continued, but more intensively, following the widening of the erosion embayment in the east and deepening of the tidal channel in the west. The dyke in front of the channel and the backshore dyke were undermined by waves and progressively broken down. The western part of the chenier began to migrate over the backshore dyke, while the eastern part became more flattened and subjected to more frequent overwash. Chenier retreat between March 2014 and June/July 2014 was less than during the previous period, with 20 m in the central part and 40 m in the eastern part of the polder. However, the erosion rate of the muddy platform exceeded that of the previous period with a retreat of 40 m in the central part and 60-70 m in the eastern part. We measured net surface and volume losses of -25,556 m2 and -59,750 m3 during this short period (Table 4): -15,830 m2and -34,510 m3 for the eastern part and -9,726 m2 and 25,240 m3 for the western part of the plot. These values represent an average erosion rate of -260 m2/day and -610 m3/day over 98 days.
Erosion of the polder slowed down in October 2014, but was still significant (Figure 7). Both the platform and the chenier retreated by 20 and 40 m, respectively in the eastern and western sectors. The chenier appeared more flattened in its eastern part and generally more ‘curly’ in the centre. The western backshore dyke became completely breached, allowing the chenier to migrate towards the next plot inland. The surface changes and sediment balance over this period showed a net loss of -17390 m2 and -43,940 m3, values that correspond to erosion rates of -150 m2/day and -379 m3/day over 116 days (Table 4). The dissymmetric platform erosion was still marked with surface and volume losses, respectively, of -9,594 m2and -27,825 m3 for the eastern part and -7,796 m2 and -13,115 m3 for the western part. The hydrodynamic measurements showed the same conditions of wave dissipation as in the previous period. The deepening of the tidal channel in the backshore favoured further damage by waves at high tide of the longshore dyke enclosing the polder.
Discussion
Two aspects have been investigated in this study: (1) a comparison of shoreline change rates in a setting where three environments co-exist: mangroves, polders, and freshwater marshes, and (2) the mechanisms and rates of muddy substrate retreat where the original mangrove and marsh vegetation has been removed to make way for polders. Close field monitoring of these mechanisms has also yielded information on chenier migration and on the plan-shape expression of inter-bank erosion embayments. The shoreline changes in French Guiana determined from satellite images and aerial photographs over 38 years throw light on the complex intermeshing of the impacts of anthropogenic mangrove removal with the larger-scale
background mud-bank alongshore migration dynamics. The erosion rates observed in the course of the field experiments in 2013-2014 on the Mana polder are amongst the highest in the world on coasts subject to a seasonal ‘normal’ wave regime. These rates are not related to exceptional high-energy events such as storms or tsunami. They are inscribed in the long-term dynamics of alongshore-migrating mud banks between which erosion rates are commonly high (Anthony et al., 2014), but also reflect the intensification of erosion engendered by anthropogenic shoreline modification.
In the face of the inordinately large space- and time-varying shoreline advance and retreat associated with mud-bank migration, mangrove removal entails a loss of the buffering effect this vegetation has on wave energy (Massel et al., 1999; Mazda et al., 2002; Quartel et
al., 2007) and in slowing down erosion during inter-bank phases. This, in turn, has led to the exacerbated coastal erosion monitored in the polder in French Guiana. Figure 4 highlights two important aspects: (1) notwithstanding high erosion rates associated with mangroves, shoreline sectors where mangroves had not been removed (PK 0-32; PK 42-59) showed strong resilience, with recovery leading to massive accretion; (2) the polder sector showed no resilience over the 38-year period of monitored shoreline change.
The polder sector (PK 32-42) and marshes showed the largest retreat rates (peak rates of 200 m/yr). The extreme retreat rates in freshwater marshes probably reflect the poor capacity of this environment, once exposed along the shore following mangrove erosion, to withstand erosion. The continued erosion of the polder sector throughout the period 1976-2014 (Figure 4) reflects a poor propensity for bank-induced shoreline recovery and regeneration. The first (1976-1987) of the four phases depicted in Figure 4 corresponded to the predominance of an inter-bank phase that led to large-scale erosion (PK 18-59) at a time when the polders were still inland. Retreat was attenuated by the passage of mud bank 1 (1987-1999), but the intertidal mudflats that developed in the wake of this bank were not sufficiently large to permit large-scale mangrove colonization. Although wave dissipation was assured by the bank, thus mitigating erosion (Figure 4b), significant mangrove colonization may have been precluded because of insufficient intertidal accretion of the mudflat substrate, a key parameter in the success of mangrove establishment during bank phases (Proisy et al., 2009; Gensac et
al., 2011). Once MB1 went past this sector, erosion of the polder and marshes ensued (1999-2006), but much more intensely, to attain the peak rate of -200 m/yr (Figure 4c). This erosion was still prevalent between 2006 and 2014, associated with the inter-bank phase between MB1 and MB2 (Figure 4d). All other sectors of the coast associated with mangroves showed, over these four phases, a normal bank (accretion) and inter-bank (erosion) pattern.
The persistence of retreat in the polder sector seems to reflect the disruptive effect of empoldering on muddy accretion in the bank stage, replaced by abnormal erosive inter-bank
conditions, and impairment of the capacity for rapid mangrove colonization. An important negative effect of empoldering is that of wave reflection from dykes which favours mud liquefaction, offshore mud transport and shoreline erosion, thus eventually leading to the failure of these dykes (Winterwerp et al., 2013; Toorman et al., 2018). These processes generate a steep and low, retreating shoreface associated with wave reflection (Figure 8a). In this context, the intertidal foreshore cannot accrete to a level enabling rapid and widespread of mangrove colonization (Proisy et al., 2009; Gensac et al., 2011), a process necessary for stabilizing mud and which strongly contributes to shoreline advance in the Guianas. Without mangrove contribution to sedimentation and wave energy dissipation, enhanced mud-bank liquefaction and alongshore mobility ensue, leading to an abnormal persistence of inter-bank conditions (Figure 8b). These conditions are also favourable to the segregation of sand from mud and formation of sandy cheniers (Augustinus, 1978; Anthony et al., 2010, 2014). Engineered shoreline modifications have been shown to impede mangrove seedling dispersal in Guyana (Anthony and Gratiot, 2012), but this is not likely to have played a significant role in the case of the French Guiana polders, given the relatively small area of polder establishment alongshore and the proximity of widespread older mangrove forests.
Figure 8
Schematic illustration of the observed erosion processes along a cross-shore profile in (a), and at the scale of the polder plot in (b). Persistent inter-bank conditions have prevailed in the polder sector where both mud-bank welding and mangrove colonization have been hindered by polder influence on the shoreface dynamics.
Situations of aggravated erosion or low shoreline recovery have been reported from other coasts where mangroves have been removed (e.g., Mazda et al., 2002; van Wesenbeeck et al., 2015; Proisy et al., 2018). Unfortunately, these effects are not understood or considered in shoreline management perspectives in the Guianas. In Suriname, for instance, there is an entrenched belief in the virtues of dykes and seawalls that goes with a poor knowledge of the larger-scale shoreline processes and a misunderstanding of the role of mangroves in coastal protection. This situation is worsened by the belief that mangroves create an unhealthy environment (Nijbroek
(2014). Similar observations have also come from other tropical field sites where the muddy coastline is engineered, such as in Thailand (Winterwerp et al., 2005), and Vietnam (Albers and Schmitt, 2015).
‘Natural’ coastal dynamics unaltered by humans still prevails along large tracts of the coasts of Brazil, French Guiana, Suriname and Venezuela, unlike the highly human-modified Guyana coast. The variable but large spatial (multi-kilometric) and temporal (multi-decadal) scales of mud-bank dynamics are incompatible with rapid coastal modifications under the pressures of population growth, socio-economic development, and urbanization. This can lead to a whole spate of issues ranging from accelerated shoreline retreat to the necessity of rethinking coastal planning and management, including retreat strategies, shoreline protection, and mangrove replanting. This is especially the case within the overarching perspective of sea-level rise affecting these low coastal lands (Nijbroek, 2014; Anthony, 2016). The case of the Mana polder illustrates this very well because at the time of conversion into rice fields in the 1980s this area was simply considered as swamps and wet savannahs far from the sea. The mild buffering effect of mangroves associated with mud bank 1 probably clouded the perception of risk of coastal erosion in the inter-bank phase, a problem further exacerbated by the afore-mentioned strong spatial and temporal variability of bank–inter-bank morphology and phases (Figure 4).
In addition to contributing to a better understanding of impaired mangrove colonization, the results obtained from the one-year field survey have enabled us to establish the strong links and morphological feedback effects between erosion of the polder, the ensuing polder foreshore and shoreface characteristics, rapid shoreward chenier migration in the absence of mangroves, and peculiarities of the plan shape of the muddy shoreline undergoing erosion. Removal, during empoldering, of much of the peat from mangrove or freshwater swamp development lowered resistance to wave attack. Moreover, mangrove tree stumps and roots also constitute an efficient wave buffer that reduces erosion rates. Cheniers generally undergo more or less active landward migration over their mud substrate during inter-bank phases. This occurs by overwash as waves top the low-elevation beach and transfer sediments from the active beach face to the back-beach. This process can be slowed down considerably where the chenier migrates landward over mangrove trees (Anthony, 2016). Over the unvegetated polder, the chenier moved back freely and did not offer the same protective effect as on a natural coast. The bare mud layer was also more exposed to heat during low tide, which boosted mud cracking through intense evaporation. Landward chenier migration was strongly related to wave dissipation over the platform. The chenier retreated by overwash and this process was controlled by the distance between the breaking wave area at the scarp of the platform and the chenier seaward face. Where the platform is large, the chenier face is located 70–80 m from the platform scarp and adopts a reflective profile. The chenier gradually migrates onshore through small overwash events during high tide, with sand being washed over from the berm to runnel, generating a
coherent alongshore body (Figures 7, 8). This dynamic allows reworking of fresh mud which is moved by waves as the tide rises (Figure 8). In natural sectors where the chenier migrates over an eroding mangrove fringe, the muddy surface is less exposed to mud cracks and to breakdown by waves.
The highest erosion rates observed at the scale of the plot occurred from the end of March to July 2014. WWIII simulations over this period showed that the offshore wave energy decreased compared to the October 2013–March 2014 period. We suppose that the erosion embayment created during the previous period enhanced the breakdown of the platform by waves. The tidal cycle also appears to play an important role. The rising tide leads to immersion of the muddy intertidal platform 2 h after the low tide peak. Wave breaking then becomes efficient on the overall structure over a time window of 6 h centred on the high-tide peak. This creates the concave morphology of the platform basement. Wave forcing on a seasonal basis leads to the formation of the large erosion embayments observed during the strong wave season, between October 2013 and March 2014 (Figure 8). Anthony et al. (2010) suggested that these erosion embayments, also commonly referred to as a ‘happen coast’ since they were thus first identified by Geijskes (1952), could be due to orbital wave–wave interactions such as those that generate megacusps on sandy shores. Apart from those reported by Geiskes (1952) and further documented by Augustinus (1978) on the Guianas coast, we are not aware of any reports in the literature of such marked erosion embayments on muddy coasts elsewhere. Following our field experiments reported here, we hypothesize that the appearance of erosion embayments in the eastern part of the plot reflects the influence of the main wave approach direction. The trade-wind waves that dominate the coastal hydrodynamic regime between October and March come from the NE–E sectors and contributed actively to the formation of these embayments as a result of the relatively constant and regular angle of incidence and attack. The carving out of the embayments is most likely the expression of a combination of rheological factors, such as faulting at the top of the substrate due to mud cracks, and continuous alveolar dismantling at the scale of the numerous burrows (Figure 8). As reported in Fiot and Gratiot (2006), the formation of mud cracks following evaporation processes on intertidal mud mainly depends on the duration of emersion, which is controlled in turn by the tidal range and the elevation of the substrate. In our case, the duration of emersion appears to be high enough to enable thorough wetting and weakening of the surface of the mud deposits, preparing the terrain for wave reworking and breakdown into large blocks. This is illustrated in Figures 5 and 8 where we observed fresh sub-vertical incisions along the first 20 cm of the scarp while the rest of the profile was more oblique relative to the substrate.
We did not examine the role of rainfall, but several authors (e.g., Mwamba and Torres, 2002; Ryu et al., 2004; Torres et al., 2003; Voulgaris and Meyers, 2004; Fiot and Gratiot, 2006) have shown that rainfall can play an important role in mudflat erosion or consolidation. Rain
contributes to fluidization of the muddy surface. This is typical of the March to July period when heavy and sustained rainfalls occur in French Guiana.
Conclusions
This study has focused on the negative impact of polders on mangroves, and on their role in shoreline changes. The Guianas coast is strongly influenced by mud banks migrating northwestward from the Amazon. Shoreline changes are inscribed in bank (shoreline advance) and inter-bank phases (shoreline erosion). Over a 38-year period, erosion persisted along the polder shoreline, notwithstanding the alongshore passage of a mud bank, whereas adjacent sectors of coast where mangroves had not been removed showed resilience, following intensive inter-bank erosion, and remarkable accretion during bank phases. The lack of resilience along the polder shoreline reflects the disruptive effects of these artificial structures on normal mangrove colonization of shore-attached mud during bank stages. Polder dykes and seawalls favour the development and maintenance, in the course of shoreline retreat, of a steep, low reflective muddy shoreface and the persistence inter-bank conditions. A one-year field experiment highlighted the processes involved in the persistent erosion of the polder. Erosion was dissymmetric and more pronounced on the eastern part of the polder plot. This seemed to be related to the main incidence of offshore waves to the coast which came from the NE. The steep wave-reworked foreshore and shoreface formed following the persistent retreat of the muddy polder substrate entails a lower capacity for bank welding onshore and mangrove establishment. The reworking of the foreshore also favours the formation, in each polder compartment, of a sandy chenier. These cheniers freely and rapidly retreat landwards, under the influence of overwash processes, at rates that are largely exceeded compared to cheniers formed under natural inter-bank conditions. These results show that anthropogenic mangrove removal can lead to a durable modification of the morphodynamics of muddy shorefaces. This can, in turn, limit the capacity for shoreline recovery and mangrove re-establishment even when there is no sustained long-term deficit in mud supply, as in the case of the Amazon-influenced Guianas coast. At the regional scale, this work addresses a warning signal against large-scale removal, under the pressures of population growth, socio-economic development, and urbanization, of mangroves characterizing the muddy coastal plain deposits of the Guianas. The French Guiana example documented here highlights the need for more studies on the coastal bank and inter-bank dynamics.
Acknowledgements
We acknowledge support from CEREGE UM 34 for the October 2013 experiment, and the CNRS Mission Interdisciplinaire and the Pépinière Interdisciplinaire de Guyane GUIASANDBEACH project for funding in 2014. Important funding was provided by the Belmont Forum-ANR Project ‘BF-Deltas: Catalyzing Action Towards Sustainability of Deltaic Systems with an Integrated Modeling Framework for Risk Assessment’. Funding was
also provided by the ERDF OYAMAR project. Finally, we appreciate the operational support from the Amana Nature Reserve and the coastal team of the CNRS in French Guiana. Thanks also to the Western French Guiana Township Community Office (CCOG) for their support and for providing data from Créocéan. Salient suggestions for improvement were provided by two reviewers and by the Associate Editor.
References
• Acciarri A, Bisci C, Cantalamessa G, Di Pancrazio G. 2016. Anthropogenic influence on recent evolution of shorelines between the Conero Mt. and the Tronto R. mouth (southern Marche, Central Italy). CATENA 147: 545– 555. https://doi.org/10.1016/j.catena.2016.08.018.
• Albers T, Schmitt K. 2015. Dyke design, floodplain restoration and mangrove co-management as parts of an area coastal protection strategy for the mud coasts of the Mekong Delta,
Vietnam. Wetlands Ecology and Management 23: 991– 1004.
https://doi.org/10.1007/s11273-015-9441-3.
• Allison MA, Lee MT. 2004. Sediment exchange between Amazon mudbanks and fringing
mangroves in French Guiana. Marine
Geology 208: 169– 190. https://doi.org/10.1016/j.margeo.2004.04.026.
• Alongi DM. 2008. Mangrove forests: Resilience, protection from tsunamis, and responses to global
climate change. Estuarine, Coastal and Shelf
Science 76: 1– 13. https://doi.org/10.1016/j.ecss.2007.08.024.
• Anthony EJ. 2016. Assessment of peri-urban coastal protection options in Paramaribo-Wanica, Suriname. WWF Guianas, Paramaribo, Suriname, 53 pp.
• Anthony EJ, Gratiot N. 2012. Coastal engineering and large-scale mangrove destruction in Guyana, South America: Averting an environmental catastrophe in the making. Ecological
Engineering 47: 268– 273. https://doi.org/10.1016/j.ecoleng.2012.07.005.
• Anthony EJ, Gardel A, Gratiot N, Proisy C, Allison MA, Dolique F, Formard F. 2010. The Amazon-influenced muddy coast of South America: a review of mud bank-shoreline. Earth- Science Reviews103: 99– 121. https://doi.org/10.1016/j.earscirev.2010.09.008.
• Anthony EJ, Gardel A, Gratiot N. 2014. Fluvial sediment supply, mud banks, cheniers and the morphodynamics of the coast of South America between the Amazon and Orinoco river mouths. In: I. P. Martini, H. R. Wanless (eds), Sedimentary Coastal Zones from High to Low Latitudes:
Similarities and Differences. Geological Society London, Special Publications 388: 533– 560. https://doi.org/10.1144/SP388.8.
• Augustinus PGEF. 1978. The changing shoreline of Surinam (South America). Ph.D. dissertation, University of Utrecht, Utrecht.
• Augustinus PGEF. 2004. The influence of the trade winds on the coastal development of the
Guianas at various scale levels: a synthesis. Marine
Geology 208: 141– 151. https://doi.org/10.1016/j.margeo.2004.04.007.
• Augustinus PGEF, Hazelhoff L, Kroon A. 1989. The chenier coast of Suriname: modern and
geological development. Marine Geology 90: 269– 281.
• Carlton JM. 1974. Land-building and stabilization by mangroves. Environmental
Conservation 1: 285– 294. https://doi.org/10.1017/S0376892900004926.
• Créocéan 2008. Etude de l’érosion du littoral du Nord-Ouest guyanais – Rapport d'étude. Study report, unpublished.
• Fiot J, Gratiot N. 2006. Structural effects of tidal exposures on mudflats along the French Guiana coast. Marine Geology 228: 25– 37. https://doi.org/10.1016/j.margeo.2005.12.009.
• Gardel A, Gratiot N. 2006. Monitoring of coastal dynamics in French Guiana from 16 years of SPOT images. Journal of Coastal Research I39: 1503– 1506.
• Gedan KB, Kirwan ML, Wolanski E, Barbier EB, Silliman BR. 2011. The present and future role of coastal wetland vegetation in protecting shorelines: answering recent challenges to the
paradigm. Climate Change 106: 7– 29. https://doi.org/10.1007/s10584-010-0003-7.
• Geijskes DC. 1952. On the structure and origin of sandy ridges in the coastal zone of Suriname. Tijdschrift. Koninklijk Nederlandsch Aardrijkskundig Genootschap 69: 225– 237. • Gensac E, Gardel A, Lesourd S, Anthony EJ, Proisy C, Loisel H. 2011. Short-term prediction of
the evolution of mangrove surface areas: The example of the mud banks of Kourou and Sinnamary,
French Guiana. Journal of Coastal Research, Special
Issue 64: 388– 392 https://www.jstor.org/stable/26482199.
• Gratiot N, Gardel A, Anthony EJ. 2007. Trade-wind waves and mud dynamics on the French Guiana coast, South America: Input from ERA-40 wave data and field investigations. Marine
Geology 236(1-2): 15– 26. https://doi.org/10.1016/j.margeo.2006.09.013.
• Jonah FE, Boateng I, Osman A, Shimba MJ, Mensah EA, Adu-Boahen K, Chuku EO, Effah E. 2016. Shoreline change analysis using end point rate and net shoreline movement statistics: an application to Elmina, Cape Coast and Moree section of Ghana's coast. Regional Studies in Marine
Science 7: 19– 31. https://doi.org/10.1016/j.rsma.2016.05.003.
• Kazimi A, Van de Riet K, Curet OM. 2018. Drag coefficient and flow structure downstream of mangrove root-type models through PIV and direct force measurements. Physical Review
Fluids 3: 073801. https://doi.org/10.1103/PhysRevFluids.3.073801.
• Martinez JM, Guyot JL, Filizola N, Sondag F. 2009. Increase in sediment discharge of the Amazon
River assessed by monitoring network and satellite
data. Catena 79: 257– 264. https://doi.org/10.1016/j.catena.2009.05.011.
• Massel S, Furukawa K, Brinkman R. 1999. Surface wave propagation in mangrove forests. Fluid
Dynamics Research 24: 219– 249. https://doi.org/10.1016/S0169-5983(98)00024-0.
• Mazda Y, Magi M, Nanao H, Kogo M, Miyagi T, Kanazawa N, Kobashi D. 2002. Coastal erosion due to long-term human impact on mangrove forests. Wetlands Ecology and
Management 10: 1– 9. https://doi.org/10.1023/A:1014343017416.
• Mwamba MJ, Torres R. 2002. Rainfall effects on marsh sediment redistribution, North Inlet, South
Carolina, USA. Marine Geology 189: 267– 287. https://doi.org/10.1016/S0025-3227(02)00482-6.
• Nijbroek RP. 2014. Mangroves, mudbanks and seawalls: whose environmental knowledge counts
when adapting to sea level rise in Suriname? Journal of Political
Ecology 21: 533– 550. https://doi.org/10.2458/v21i1.21150.
• Paquier AE. 2014. Interactions de la dynamique hydro-sédimentaire avec les herbiers de phanérogames, Étang de Berre. PhD Thesis, Aix-Marseille University.
• Proisy C, Gratiot N, Anthony EJ, Gardel A, Fromard F, Heuret P. 2009. Mud bank colonization by opportunistic mangroves: a case study from French Guiana using lidar data. Continental Shelf
Research 29: 632– 641. https://doi.org/10.1016/j.csr.2008.09.017.
• Proisy C, Viennoisa G, Sidik F, Andayanid A, Enright JA, Guitet S, Gusmawatid N, Lemonnier
H, Muthusankar M, Olagoke A, Prosperia J, Rahmani R, Ricout A, Soulard B,
Suhardjono. 2018. Monitoring mangrove forests after aquaculture abandonment using time series of very high spatial resolution satellite images: A case study from the Perancak estuary, Bali, Indonesia. Marine Pollution Bulletin 131: 61- 71. https://doi.org/10.1016/j.marpolbul.2017.05.056
• Prost MT. 1989. Coastal dynamics and chenier sands in French Guiana. Marine
Geology 90(4): 259– 267. https://doi.org/10.1016/0025-3227(89)90128-X.
• Quartel S, Kroon A, Augustinus PGEF, Santen PV, Tri N. 2007. Wave attenuation in coastal
mangroves in the Red River delta, Vietnam. Journal of Asian Earth
Sciences 29: 576– 584. https://doi.org/10.1016/j.jseaes.2006.05.008.
• Ryu SO, Lee HJ, Chang JH. 2004. Seasonal cycle of sedimentary process on mesotidal flats in the semi enclosed Muan Bay, southern west coast of Korea: culminating summertime erosion. Continental Shelf Research 24: 137– 147. https://doi.org/10.2112/SI75-283.1.
• Thieler ER, Danforth WW. 1994. Historical Shoreline Mapping (II): Application of the Digital
Shoreline Mapping and Analysis. Journal of Coastal
Research 10(3): 600– 620 URL: http://WOS:A1994NU68900007.
• Toorman E, Anthony EJ, Augustinus PGEF, Gardel A, Gratiot N, Homenauth O, Huybrechts N, Monbaliu J, Moseley K, Naipal S. 2018. Interaction of mangroves, coastal hydrodynamics and
morphodynamics along the coastal fringes of the Guianas. Coastal Research
Library 25: 429– 473. https://doi.org/10.1007/978-3-319-73016-5_20.
• Torres R, Mwamba MJ, Goni MA. 2003. Properties of intertidal marsh sediment mobilized by
rainfall. Limnology and
Oceanography 48: 1245– 1253. https://doi.org/10.4319/lo.2003.48.3.1245.
• van Wesenbeeck B, Balke T, van Eijk P, Tonneijck F, Siry H, Rudianto M, Winterwerp J. 2015. Aquaculture induced erosion of tropical coastlines throws coastal communities back into
poverty. Ocean and Coastal
Management 116: 466– 469. https://doi.org/10.1016/j.ocecoaman.2015.09.004.
• Victor S, Golbuu Y, Wolanski E, Richman RH. 2006. Sedimentation in mangroves and coral reefs
in a wet tropical island, Pohnpei, Micronesia. Estuarine, Coastal and Shelf
Science 66: 409– 416. https://doi.org/10.1016/j.ecss.2005.07.025.
• Voulgaris G, Meyers ST. 2004. Net effect of rainfall activity on salt-marsh sediment distribution. Marine Geology 207: 115– 129. https://doi.org/10.1016/j.margeo.2004.03.009. • Walcker R, Anthony EJ, Cassou C, Aller RC, Gardel A, Proisy C, Martinez JM, Fromard
F. 2015. Fluctuations in the extent of mangroves driven by multi-decadal changes in North Atlantic waves. Journal of Biogeography 42: 2209– 2219. https://doi.org/10.1111/jbi.12580.
• Winterwerp JC, Borst WG, de Vries MB. 2005. Pilot study on the erosion and rehabilitation of a
mangrove mud coast. Journal of Coastal Research
21-2: 223– 230 URL: http://www.jstor.org/stable/4299409.
• Winterwerp JC, Erftemeijer PLA, Suryadiputra N, van Eijk P, Zhang L. 2013. Defining
Eco-Morphodynamic Requirements for Rehabilitating Eroding Mangrove-Mud
• Wong Th. E, De Kramer R, De Boer PL, Langereis C, Sew-A-Tion J. 2009. The influence of sea level changes on tropical coastal wetlands: the pleistocene coropina formation, Suriname.