I N T E R N A T I O N A L
SÉRIE ÉTUDES ET DOCUMENTS
Innovation, productivity, exports and the investment climate:
A study based on Indian manufacturing firm-level data
Patrick Plane, Marie-Ange Véganzonès-Varoudakis
Études et Documents n° 1
January 2019To cite this document:
Plane P., Véganzonès-Varoudakis M.-A. (2019) “ Innovation, productivity, exports and the investment climate : A study based on Indian manufacturing firm-level data”, Études et Documents, n° 1, CERDI.
CERDI
PÔLE TERTIAIRE 26 AVENUE LÉON BLUM F- 63000 CLERMONT FERRAND TEL. + 33 4 73 17 74 00 FAX + 33 4 73 17 74 28 http://cerdi.uca.fr/
2 The authors
Patrick Plane
Director of Research at CNRS
Université Clermont Auvergne, CNRS, IRD, CERDI, F-63000 Clermont-Ferrand, France. Email address: patrick.plane@uca.fr
Marie-Ange Véganzonès-Varoudakis CNRS Researcher
Université Clermont Auvergne, CNRS, IRD, CERDI, F-63000 Clermont-Ferrand, France. Email address: veganzones@aol.com
Corresponding author: Marie-Ange Véganzonès-Varoudakis
This work was supported by the LABEX IDGM+ (ANR-10-LABX-14-01) within the program “Investissements d’Avenir” operated by the French National Research Agency (ANR).
Études et Documents are available online at: https://cerdi.uca.fr/etudes-et-documents/ Director of Publication: Grégoire Rota-Graziosi
Editor: Catherine Araujo Bonjean Publisher: Mariannick Cornec ISSN: 2114 - 7957
Disclaimer:
Études et Documents is a working papers series. Working Papers are not refereed, they constitute research in progress. Responsibility for the contents and opinions expressed in the working papers rests solely with the authors. Comments and suggestions are welcome and should be addressed to the authors.
3 Abstract
We study the interactions between firm-level innovation, productivity and exports in the case of the Indian manufacturing sector. To differentiate the incentives to innovate from the ability to innovate, we distinguish the inputs of innovation (R&D and training), from the outputs. Our findings highlight a virtuous circle between the three components of innovation, as well as between firm-level R&D, innovation and exports. The results suggest a positive effect of R&D on innovation (product innovation in particular), of innovation on exports (product and marketing innovation especially), and of exports on R&D. Furthermore, it seems that training and R&D reinforce each other in the Indian firm-level innovation process: doing R&D incites firms to train their workforce, and training stimulates R&D in return. Productivity of the Indian manufacturing firms seems to benefit from that dynamics, as exporting and innovating would improve firm-level TFP. As for the investment climate, our results suggest that the differences in the Indian firm-level environment participate in the firms’ performance gaps. These results are all the more important in the context of the Make in India campaign and the business environment deficiencies.
Keywords
Innovation, Productivity, Exports, Investment climate, Manufacturing, Firm-level data.
JEL Codes
C31, C36, D22, L25, O12, O14, O30, O53.
Acknowledgments
Ce travail a été soutenu par l’Agence nationale de la recherche du gouvernement français à travers le programme « Investissements d’avenir » [ANR-10-LABX-14-01]. Les auteurs tiennent à remercier Baptiste Souillard, stagiaire à la FERDI, pour son excellente assistance de recherche.
1- Introduction
Since 1991, reform in the manufacturing sector has witnessed major policy changes. Industrial de-licensing and removal of restrictions on foreign investment have modified the profile of this sector considerably (Aghion et al., 2008). Trade policies have stimulated exports and imports since tariff rates have been reduced and the quantitative restrictions on imports were by and large abolished (Topalova and Khandelwal, 2011). To encourage firms to innovate and conduct R&D activities, the government has developed a system of fiscal incentives and financial benefits (Unido, 2005; Sharma, 2012). These reforms aimed at making Indian manufacturing firms more efficient, technologically up-to-date and competitive. However, despite these policy changes, the share of the manufacturing sector at 16% of GDP in 2012 was still low compared to other Asian emerging countries1, as well as
exports and productivity (Trivedi et al., 2000; Goldar and Kumari, 2003 ; Kathuria et al., 2014). In the literature, manufacturing is traditionally considered as the sector of most rapid growth through innovation, technical progress, scale economies, externalities and knowledge spillovers (Kaldor 1966; Murphy et al. 1989). Improving productivity in manufacturing, in particular, is recognized as an effective way of enhancing performance and catching up with other better performers, what is widely known as the convergence hypothesis (Howitt, 2000). Despite the recent surge of the Indian service sector, the central role of manufacturing has also been debated by Lin (2012), Aghion (2012) and Stiglitz et al. (2013) who think that manufacturing remains the only realistic path toward sustained growth for low-income, low-skilled, and labor-abundant countries such as India.
With the “National Manufacturing Policy” (NMP) in 2012, and the “Make in India” campaign launched by the Prime Minister Narendra Modi on September 2014, objectives are to enhance further manufacturing so that the sector emerges as a new engine of growth to provide jobs to a large number of unemployed and under-employed workers. Poor quality of governance, the regulatory environment, deficiencies in physical, economic, and social infrastructure are reported as major reasons of the retarded industrial growth and the wide inter-state differences in performances in the country (Mitra, et al., 2002 and 2014; Lall and Mengistae, 2005; Hulten et al., 2006; Gupta et al. 2008). The central policy agenda of these new national-level programs is thus to address manufacturing firms weaknesses to unlock the potential of growth, innovation and competitiveness of the Indian manufacturing sector2. By studying the interactions between firms' innovation,
productivity and exports, this paper can be seen as a contribution to the present debate.
This study relates to different strands of the literature. The role of trade in enhancing firms' performance has been the subject of extensive discussions (Balassa, 1988; Krugman, 1994).The issue has taken on added importance since the pioneering work of Bernard and Jensen (l995, 1999) that found exporting firms more productive, larger in size, more skill and capital intensive than non-exporting ones. On the theoretical front, some analysts argue that, due to the fixed costs of non-exporting, the higher productivity of exporters reflects the self-selection of more efficient producers into highly competitive export markets (Melitz, 2003, Bernard and Jensen, 2004). This "self-selection" model has however been challenged by others who stress that it is international trade, exporting in particular, which improves firms' productivity, through a learning process. This "learning by exporting" hypothesis has been illustrated by Clerides et al. (1998), Alvarez and Lopez (2005), Van Biesebroeck (2005), Greenaway and Keller (2007), Lileeva and Trefler (2010), and Aw et al. (2011).
1 This share was of 34% in Thailand, 32% in China, 31% in Korea and 24% in Indonesia in 2014.
2 The “National Manufacturing Policy” (NMP) mainly aims at increasing the sector employment and growth, improve its technological depth, create appropriate skills and enhance competitiveness, through a rationalisation and simplification of the business regulation, industrial training, leveraging infrastructure deficit and improving access to financing. The “Make in India” agenda builds on the NMP with more openness to foreign companies who are invited to invest in India, with the promise of an effective and easy governance, to help the country becoming a global manufacturing hub (Government of India, Ministry of Commerce and Industry, Department of Industrial Policy and Promotion: http://dipp.nic.in/policies-rules-and-acts/policies/national-manufacturing-policy and
Other studies focus on the relation between innovations and exports. Pioneer authors are Ito and Pucik (1993) who analyze this link in the case of Japan, and Lefebvre et al. (1998) of Canada. One strand of the literature pictures the "exporting by innovating" hypotheses. This is the case of Caldera (2009) and Cassiman et al (2010), who illustrate that innovation increases the probability of exporting, with in addition an external effect enhancing productivity and exports of all the other firms. Van Beveren et al (2010) however, do not validate this link. Using instrumental variable, they depict the "self-selection into innovation" hypotheses by showing that it is exporting which is an incentive for firms to innovate. This is also the case of Girma et al (2008) and Damijan et al (2009). Aghion (2018), on his side, highlights two opposite effects: as exporting extends market size, it fosters innovation by increasing innovation gains. But since it also toughens competition, all in all, only the most productive firms may innovate.
Innovation has also been identified as a key channel to raise firms' productivity. Endogenous growth models explain that R&D expenditures, in addition to directly enhancing firms' performances through innovation, contribute to this process through their industry-wide spillover effect (Grossman and Helpman, 1990b; Romer, 1986). Several studies describe the productive role of innovation (Hall, 2011 for a review of the literature), some of which supports the idea that firms self-select into innovation according to their productivity (Bustos, 2011), others that it is innovation that boosts productivity (Aw et al., 2011). Two empirical approaches are mainly used in the literature. A major contribution can be found in Crépon et al. (1998), which propose a four-equation model and whose approach has been used in other studies (Loof and Heshmati, 2002; Griffith et al., 2006; Parisi et al., 2006; Garcia-Quevedo, 2014). In the model, firms invest in knowledge inputs (R&D in particular), that are transformed into innovation outputs, that finally impact firms' productivity. Because firms' decisions are taken simultaneously, the model is solved as a system with Asymptotic Least Squares (ALS) to integrate the feedback effects at the various levels of the firms' decisions. Closer to the international trade literature, Bustos (2011) relies on sequential estimations for their empirical validations, the first stage predicted value of the endogenous variables being introduced in the following stages in a process less demanding than in Crépon et al. (1998).
In this study, we differentiate the incentives to innovate from the ability to innovate, and distinguish the inputs of innovation, from the outputs. Two innovation’s inputs are considered: the implementation of a research and development (R&D) program, and the implementation of a training program. The innovation’s output follows the OECD Oslo manual, which defines 4 types of innovation: (i) product, (ii) process, (iii) organisational and (iv) marketing. Data are from the World Bank Enterprise Surveys (WBES) conducted in India between June 2013 and December 2014. Each enterprise is interviewed only once. The survey is stratified to ensure the representativeness of the Indian manufacturing sector. In addition to innovation, several indicators are available for productivity and exports as well.
We consider a much larger number of interactions between firms' innovation (in the broad sense), productivity and exports than in previous studies. It is assumed that undertaking a training program can stimulate innovation and productivity, as well as encourage firms to engage into R&D. Symmetrically, R&D can lead to engage into training, but can also help businesses to innovate more. It is assume however that R&D has no direct effect on productivity and export, but an indirect one through innovation only. Innovation, productivity and exports are central to the system since they can have a direct effect on each of the 4 other variables of interest. Firm productivity for example can directly influence the firms' decision to engage into R&D and training, to innovate more (self-selection into innovation) and to export (self-(self-selection into exporting).
innovating, exporting and being productive3. A main hypothesis in the literature is that a good
investment climate facilitates the functioning of markets and reduces the transaction risks and costs associated with investing in, starting, operating, and closing down a business. It can also create new opportunities (for example through trade, innovation or access to technology) and put competitive pressures on firms. The World Bank reports as well that a better business environment contributes to the effective delivery of public goods necessary for productive business (World Bank, 2004; Straub, 2011). Previous works have shown that business environment is decisive for firms' performance in developing countries (see Dethier et al, 2008, for a review of the literature). Because India only ranked
130th out of 190 countries in 2015 in the World Bank Ease of Doing Business Index, important gains
could be made by improving the investment climate of the Indian manufacturing firms. In this study, we classify investment climate into 9 categories: (i) infrastructure, (ii) information & communication technology (ICT), (iii) human capacity, (iv) access to financing, (v) government relations, (vi) security, (vii) international openness or access to global knowledge, (viii) agglomeration and (ix) competition.
Several biases may distort estimation results of these relations. Because of the interactions between the 5 variables of the system, there is a risk of reverse causality. A simultaneity bias can also result from the interactions between the investment climate and the firms' performances. Actually, while investment climate may affect firms’ innovation, productivity or exports, the reverse can be true. The most productive firms for example have probably more ease to adapt their environment to their needs. In addition, measurement errors are possible, especially for investment climate opinion variables. These issues will be treated by using the most adequate than possible statistical approaches (instrumental estimations in particular).
Our results suggest a virtuous circle between R&D, innovation and exports of the Indian manufacturing firms. An innovative firm would be tempted to engage more into R&D, which in turn would materialise into more innovations (product innovation in particular). These innovations would
increase firm exports, what would encourage the firm to undertake more research in return (and to
innovate and export more consequently). Training is associated to the process. Trained workers would stimulate R&D, which in turn would materialize into innovation, then exports. Trained workers would allow more innovation directly as well (process, organizational and marketing innovations in particular). These findings highlight a virtuous circle between the 3 components of innovation: the 2 innovation inputs (R&D and training) and the innovation output. In addition, it would seem that training and R&D reinforce each other in the innovation process: doing R&D would incite Indian firms to train their employees, and training would stimulate R&D in return.
Productivity seems to benefit from that dynamics. When considering Total Factor Productivity (TFP), exporting and innovating would increase firms’ productive performance, validating the learning by exporting hypothesis. The reverse would be partly true, as it is low productive firms that would be willing to innovate more (and more productive firms that would have less incentive to do so). However, we do not see any effect of firms’ productive performance on the level of exports (no self-selection into exporting), or on the decision to launch a R&D or training program. As for the investment climate, our results suggest the importance of the differences in firms' environment in explaining the performance gaps across the Indian manufacturing firms. These results are robust to various proxies of innovation, productivity and exports, as well as to different indicators of investment climate, methods of estimations and bias corrections.
This study contributes to the literature in different ways. First, we define a broad concept of
innovation by differentiatingthe inputs ofinnovationfrom the outputs, what is lessoften the case in
3 Investment climate is defined by the World Bank as "all factors specific to firms' location that affect market opportunities or their desire to invest for productive purposes, create jobs and develop their activities” (World Bank, 2004).
previous studies, especially on developing countries. Second, research and development (R&D) is not the only input of innovation considered, as mainly done in the literature. Third, we look at multiple interactions between our broad concept of innovation, productivity and exports and do not limit our research to one or two of them, as most previous studies do. Fourth, having access to an extensive dataset on Indian manufacturing firms, we control for a large number of variables not usually used in the literature. In particular, we broaden the scope of the analysis to the investment climate in which
the firms operate and who may participate in the dynamics we study. Fifth, our topic of research rarely
covers developing countries, for which data are very limited. The study of India is of particular interest in line of its emerging nature and the recent “Make in India” campaign. Sixth, the robustness of our results is tested in several ways, not frequent in previous studies, especially on developing economies. Instrumental estimations allow us to address endogeneity at work in the interactions, as well as linked to the nature of the investment climate data. Other issues are considered, such as
measurement errorsand multicollinearity.
The paper is organized as follows. In the second section, we introduce the WBES dataset and define our variables of interest. Based on the literature, the third section presents our system and specifies the interactions between firm-level innovation (in the broad sense of the Oslo Manual), productivity and exports. Details on the equations and their estimation are given in section four. The fifth section exposes our results and the sixth one concludes with policy recommendations.
2- Presentation of the Data and Definition of Variables 2.1- The World Bank Enterprise Surveys (WBES)
The World Bank Enterprise Surveys (WBES) questionnaire is organized in two parts. The first one concerns general information on firms and the environment in which they operate. The second one
provides information on their costs and other accounting information4.
In the first part, the questions that firms are asked to answer are of two types. The vast majority of them refer to information that can be verified, also called “objective” or quantitative questions, such as the State in which they are located or the part of the skilled workforce. The other questions are “subjective” or qualitative ones, whose answer is a matter of opinion. More specifically, firms are expected to assess the obstacle that some aspects of the investment climate presents for their
operations, such as access to finance, corruption, or the quality of infrastructure5. They are generally
called "obstacle” variables.
How to handle the variables of opinion is a subject of debate (Dethier et al, 2008). These variables are subject to measurement errors since firms answer the related questions in different ways. For example, does their answer relate to their own environment, or to the “macroeconomic” environment? A performing firm that has acquired a generator to overcome power outages might answer that power shortages do not represent an obstacle to operate. The contrary can be true if their answer considers the real situation of the power utilities. Aside these “anchoring” effects, it might be that some firms are unable to distinguish what is due to their functioning, to what comes from outside. The respondent may also ignore some elements, or be influenced by his mood, personality (be optimistic or pessimistic) or cultural environment.
Another issue is the question of the endogeneity of the investment climate variables. Simultaneity in particular is possible because competitive firms have most probably the possibility to modify their
4 For details on the content of the surveys, see http://www.enterprisesurveys.org
5 Firms have to choose between 5 modalities: 0 for not an obstacle, 1 for minor obstacle, 2 for moderate obstacle, 3 for major obstacle and 4 for very severe obstacle.
own environment. This is the case when buying a generator to address power shortages, or when lobbying the authorities to get advantageous conditions. A two way causality between performance and investment climate is thus plausible, although adapting the investment climate is costly and takes time, and it is most probably the past financial condition and performance that give the enterprise the possibility to do so. In the empirical part, we'll come back to these questions and on how to handle measurement errors and endogeneity issues of the investment climate variables (see sections 2.4.1 and 2.4.2).
2.2- The Indian Sample
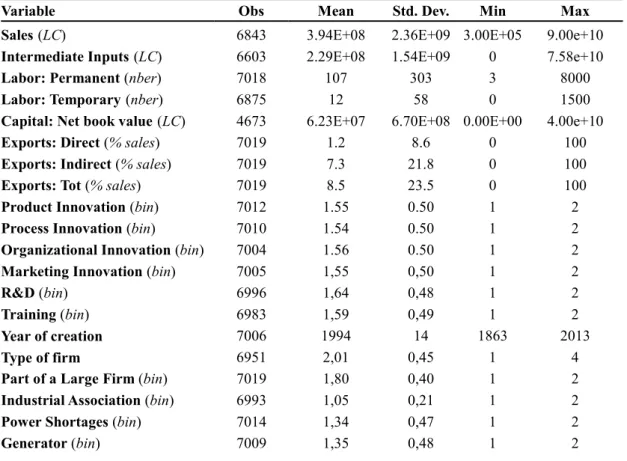
The Indian survey includes 7130 registered private manufacturing firms of more than 5 employees, belonging to 27 States (out of 29) et one territory (out of 7) which represent more than 95% of the manufacturing wealth of the country. The sample is representative of the Indian manufacturing firms’ universe and stratified by size, sector and State. We retained, for the purpose of the study, the sectors for which information was sufficient, and dropped the ones too specific or with a small number of
observations6. Firms have been polled only one time between June 2013 and December 2014. In total,
our sample is constituted of 6249 firms belonging to 11 sectors (out of 20 in the survey), namely: (i) food, (ii) textile, (iii) garment, (iv) chemicals, (v) rubber and plastics, (vi) non-metallic products, (vii) basic metal products, (viii) fabricated metal products, (ix) machinery and equipment, (x) electronics and (xi) transport machinery.
2.3- The Variables of the System
2.3.1- Training of Employees and Research and Development (R&D)
The WBES do not indicate the amounts allocated to R&D. Only a binary variable, which distinguishes enterprises that have spent on R&D in the past 3 years from others, is available. Since firms do not necessarily have the same vision of R&D, they are told that any approach with a creative aim and supposed to increase the stock of knowledge can be considered as R&D, what is a rather broad
definition.About 36% of the Indian firms declare that they have undertaken R&D during the 3 years
preceding the survey (see Table A1 in Appendix A), what is most probably overestimated because of
this definition (Sharma, 2012 and Mitra, et al., 2014).
Similarly, the WBES have only one question dedicated to training. It is also a binary variable indicating if the firms have implemented a training program during the last 3 years. In the Indian sample, nearly 42% of the firms indicate that they have trained their workers (see Table A1 in Appendix A).
2.3.2- Innovation
Introducing a new product is not the only way to innovate. The OECD Oslo Handbook, which states "The proposed guiding principles for the collection and interpretation of innovation data", distinguishes 2 types of innovations: “technological” innovations, which mainly refer to “product” and “process” innovations, and “non-technological” innovations, which include “organizational”, “management” and “marketing” ones. The manual defines innovation not only as something new, but as a significant change or improvement as well. This makes innovation subject to interpretation, since there is no threshold from which such improvement can be considered as an innovation. In addition, innovation can be new for the firm only, and therefore already exist in the sector in which the firm operates, what is closer to the notion of imitation than of innovation.
The innovation-related part of the WBES follows the Oslo Manual definition. The survey contains 4
questions on innovation: “During the last 3 years, has this establishment introduced any new or significantly improved (i) product, (ii) method of manufacturing products, (iii) organisational structure or (iv) management practice and marketing methods. On average, at each question, almost
half of the Indian firms answer that they have innovated (45% for “product”, 47% for “process” ,
44% for “organisational” and 45% for “marketing” innovation, see Table A1 in Appendix A), a share that is most probably overestimated for all the above mentioned reasons (Cirera et Muzi, 2016). For the purpose of the study, 2 proxies of innovation are built:
(i) A binary variable for introducing at least one of the four types of innovation. This variable may
not reflect the innovative character of the Indian firms since 68% of them declare that they have innovated.
(ii) A variable representing the number of innovations and taking values of 0 to 4. This variable, although intuitive, would mean that each type of innovation is equivalent, what is not necessarily the case. This is why we will also introduce in the empirical part the 4 types of innovation individually, to test separately the effect of each of them.
2.3.3- Productivity
In the surveys, several variables can be used to assess the productivity of the Indian manufacturing firms. Production levels in t and t-3 are available, and so is the number of permanent workers. For the present period, enterprises also provide their number of part time and temporary workers, along with the contracts' length and work duration. This information is used to convert temporary/ part time work in full time equivalent7. Enterprises are also asked to indicate the value of their capital (net book value), their purchase of intermediate inputs and expenses in energy (electricity, fuel …, see Table A1 in Appendix A).
This information has been used to compute several indicators of productivity:
(i) The past (t-3) and present apparent labor productivity, calculated as the ratio of firms’ sales to the total number of workers (permanent and temporary) for the present period, and to the number of permanent workers only for the past one (t-3).
(ii) The current value-added per worker, or labor productivity, calculated as the difference between
firms' sales and the cost of intermediate inputs, on the total number of workers. Two other measures have consisted in deducting (1) electricity and (2) electricity and fuel costs from the sales as well. (iii) The current TFP calculated as the residual of an estimated Cobb-Douglas production function (see Annex B for the estimation results by sector).
2.3.4- Export
In the WBES, several questions concern firms' export activity. When surveyed, firms are asked if they export (directly or indirectly), how much, and for how long they had been exporting. We use the share of production exported (directly or indirectly) as our variable of firms' exports. In total, 20% of firms export on average 8.5 % of their production, directly or indirectly (see Table A1 in Appendix A).
2.4- The Control Variables 2.4.1- The Investment Climate
7 For some firms, this information is not provided in the survey. In that case, the variables are replaced by their State average, which seem to be a satisfactory approximation based on their variance decomposition.
In the surveys, many questions concern the environment in which firms operate, several of them covering similar topics. For the purpose of this study, and based on the literature, we classify this environment into 9 categories: (i) infrastructure, (ii) information & communication technology (ICT), (iii) human capacity, (iv) access to financing, (v) government relations, (vi) security, (vii) international openness and access to global knowledge (viii) agglomeration and (ix) competition. For each of these categories, we take into account not only verifiable or quantitative information, but also questions of opinion to get a better picture of the overall environment. The questions are also chosen
such as to cover, for as many firms as possible, key dimensions in each category without
overweighting some aspects unintentionally8. All variables are interpreted as to improve the
investment climate. This has implied to change the direction of some of them9. All investment climate
variables are reported in Appendix C.
In each category, several variables are significantly correlated. This poses the question of how to handle this issue in the empirical part of the study. Introducing all the variables at the same time into the regressions, in addition to reduce the degree of freedom, would undermine the precision of the estimations because of high multicolinearity. One solution could be to introduce one variable of each category. If all variables in each category are strongly correlated, one of them probably resumes the information. This is the choice usually made in the literature (Basto and Nasir, 2004). However, it is not sure that the selected variables provide enough information to represent the firm-level investment climate, leading to a potential missing variable bias. We choose to generate, for each category, a composite indicator, which has the advantage to embody as much information as possible, and to describe the firm-level investment climate in a more precise way. Aggregate indicators are a good alternative to the trade-off “quantity of information” versus “multicolinearity and “degrees of freedom”.
As discussed in section 2.1, most investment climate variables are subject to endogeneity and measurement errors. The usual IV procedure cannot be used in our case because we do not have, for each variable, an instrument, exogenous in each of the 5 equations, and sufficiently correlated with
the variable it represents. One way to deal with this issue could be to introduce States fixed-effects in
the regressions10 or to replace the firms' observation by their State-size average, like in Dollars and
al. (2005)11. In both cases, however, the correction would be insufficient and information would be
lost12. To limit endogeneity, we instrument investment climate variables with a same set of exogenous
variables13. This kind of instrumentation is shown as addressing endogeneity in a better way than
what is most of the time done in the literature (Nguyen and Véganzonès-Varoudakis, 2017).14
8 This will be useful for the construction of the aggregated indicators (see next section).
9 This is the case for example of the obstacle variables for which the codification has been reversed: 4 for not an obstacle, 3 for minor obstacle, 2 for moderate obstacle, 1 for major obstacle and 0 for very severe obstacle.
10 Variance decompositions show that investment climate is principally a question of State and size. Fixed-effects would thus capture the main effect of the investment climate. In addition, it can be thought that one firm cannot influence the environment of all firms of same size, State, or sector. Fixed-effects thus are a mean to limit simultaneity, measurement errors, and omitted variables bias at once. 11 This method consists in calculating firms' averages by State and size, excluding the observation of the firm concerned to limit the simultaneity and measurement errors bias. It relies on the assumption that firms of the same size and in the same region experience a similar investment climate and have a same perception of it. As seen before, variance decompositions validate this hypothesis.. 12 Because we already control for firm’s State, size and sector, this approach consists in omitting investment climate as explanatory variable.
13 In order for this method to differ from the introduction of fixed-effects, it is necessary to add quantitative and non-binary instruments. Instruments are: the age of the firm, the size (proxied by the number of workers) and production in t-3, the experience of the manager, the share of capital belonging to foreign companies, the type of firm, belonging to a big enterprise, power and water shortages, States and sectors fixed-effects.
14 For their study, the authors benefit from a panel of firms surveyed at two periods in time. They show that both, with and without time dimension instrumentation, validate the role of the investment climate in firms performance, although with a few differences in coefficients.
2.4.2- Investment Climate Composite Indicators
Although different techniques of data analysis exist, we opt for the Principal Component Analysis (PCA) for its simplicity15. When processing the indicators, decision has to be made on the number of
components to keep16. Because the interpretation of the axes is not always easy, we choose a statistical
approach17. Any aggregation, however, orders the variables in a certain way that may be questionable
and sometimes does not make sense18. It is the case of the infrastructure and government relation
indicators that will not be used in the empirical part (see section 4.3.).
In the empirical work, different composite indicators were processed, based on different combinations of investment climate variables, and including or not the subjective ones. Two versions of the same indicators are also proposed: one processed from the initial variables, another one from their prediction after instrumentation (see previous section). In our case, 3 types of investment climate variables have to be predicted: continuous, binary and obstacle variables (taking 4 to 5 modalities in that case). The predictions were made as linear combinations of the selected exogenous variables, as
well as based on probit, logit, or multinomial specifications19. All the indicators obtained were used
to test the robustness of our econometric results. . 2.4.3- The Characteristics of the Firms
In addition to investment climate, we consider several characteristics of the firms such as the age and size, the partnership with a large company, the fact to belong to an industrial association, and the sector and the State in which they operate (see Table A1 in Appendix A).
3- Presentation of the System 3.1- Training of Employees
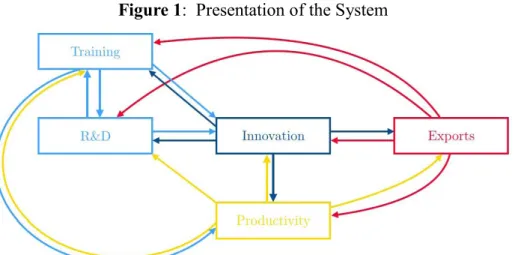
Training can be a factor of innovation and be set up in that purpose (Cirera et al., 2016). This is true for “non-technological” innovation such as “organisational” or “marketing”, and for “technological” ones, also through channels such as R&D. Training can also aim at improving firms’ productivity. Trained workers may be more efficient and organise better their work. They can make a better use of new equipment and handle better various situations (Bresnahan et al., 2002; Lima et al., 2004). Training can have a direct effect on R&D as well (Barge-Gil and Lopez, 2014; Crépon and Mairesse, 1993). It is the case, for example, if training is undertaken in view of starting a R&D program, or to give managers a new strategic vision and encourage them to risk and innovate. Nevertheless, there is no reason to believe that training affects firm's exports, if not indirectly through innovation or productivity (see Figure 1).
3.2- Research and Development (R&D)
15 PCA is a widely-used aggregation technique, designed to linearly transform a set of initial variables into a new set of uncorrelated components, which account for all of the variance in the original variables. Each component corresponds to a virtual axis on which the data are projected. Composite indicators are constructed as a weighted sum of these components. The weight attributed to each component corresponds to its relative contribution to the variance of the initial variables (calculated from the cumulative R²). 16 The number of components is proportional to the number of initial variables introduced in the PCA. The earlier components explain more of the variance of the series than do the later ones. Usually, only the first components are retained, because they explain most of the variance in the data-set.
17 We retain the most significant components which explain all together around 70% of the variance of the underlying variables. 18 To ensure the relevance of the processed indicators, we regress them on the variables involved in their construction.
19 Two criteria are used for the prediction of binary variables: the maximization of the Youden statistic and the minimization of the distance to the ROC curve. For the obstacle variables, the predicted response is the highest probability of occurrence.
The above hypotheses are also true for R&D, with one exception: it is supposed that firms' R&D has
no direct effect on their productivity, in addition to exports. On the one hand, a company who invests
in R&D may be willing to launch a training program, for example if skills for research are missing in the firm or outside, or to divulge and apply the results of the R&D (Cohen and Levinthal, 1989; Lopez-Acevedo and Tan, 2003). On the other hand, the first aim of R&D is innovation, and it will be through innovation that R&D will eventually have an impact on productivity and export (Crépon et al., 1998; Parisi et al., 2006, see Figure 1).
3.3- Innovation
Innovation, unlike training and R&D, can have a direct effect on each of the 4 other variables of the system (see Figure 1). Innovation can impact R&D and training. An innovative company may want
to reinforce its advance by doing more R&D and training (Crépon et al., 1998; Bresnahan et al.,
2002). The opposite can be true if a less innovative firm undertakes R&D and training to innovate more. In this case, it can be assumed that less innovating firms will first spend on training, less expensive and risky than R&D, in order to invest more effectively in R&D afterwards. Innovation can also increase the productivity of a company (Griffith et al., 2006; Parisi et al., 2006). This is
particularly true for “process” and “organizational” innovations (Griffith et al., 2006; Polder et al.,
2010). Finally, innovation is also described as an incentive to exports (the “exporting by innovating”
hypothesis, Caldera, 2009; Cassiman et al., 2010 ), what may be the case of “product” and
“marketing” innovations, but also of “process” and “organisational” innovation. 3.4- Productivity
A productive company, with adequate resources, is a priori more able to innovate than a less
productive one (Bustos, 2011). However, it may not be motivated to do so20. On the contrary, a
low-productive firm may want to innovate to catch up with competitors, although it may not have enough resources to do it. For these reasons, the effect of productivity on training, R&D and innovation is unsure. This uncertainty is due to the fact that the innovation equations reflect the capacity to
innovate, but also the incentive to do so. The effect of productivity on exports seems clearer. It is
expected to be positive (the “self-selection into exporting”, see Melitz, 2003, and Bernard and Jensen,
2004) or insignificant, but never negative (see Figure 1).
3.5- Exports
As for innovation, exports can have a direct (and positive) effect on each of the 4 other variables of
the system (see Figure 1): on productivity (the “learning by exporting” hypothesis, Clerides et al.,
1998; Greenaway and Keller, 2007; Aw et al., 2011), on R&D and training (as incentive in
particular)21, and on innovation (the “innovating by exporting” or “self-selection into innovation”
hypothesis, Girma et al., 2008; Damijan et al., 2009). However, as for productivity, because the equations of innovation do not allow dissociating enough the capacity from the incentive to innovate, the direction of the impact of exports on innovation (in the broad sense) is uncertain. Exports may provide financial resources or act as an incentive to innovate, but exporting firms may not be willing
to innovate if for example they are dominant on the export market.
20 Innovation usually aims at discouraging new firms from entering the market or eliminating competitors. However, a monopoly firm may have less incentive to innovate. To distinguish between these two opposite effects, we will control for the degree of competition. 21 As exporting firms face increased competition, they have a greater interest in innovating to differentiate themselves from their competitors and preserve their market share.
Figure 1: Presentation of the System
3.6- Competition
Competition, as factor of performance, can influence firms' decision to innovate, spend on training
and R&D, and be more productive (Crépon and Duguet, 1997; Aghion et al., 2001; Ospina and Schiffbauer,
2010). There is no reason to think however that domestic competition represents an incentive for firms
to export. This effect is possible only indirectly, via innovation and productivity.
Among the 5 variables of interest, productivity could directly influence the degree of competition, proxied by the variable indicating the number of competitors of each firm (see Appendix C). Since we have cross-section data, we'll consider competition as exogenous in the productivity equation as in the other equations. Although a high productive firm can lead the less productive ones to exit the market, this mechanism takes time. Nevertheless, a more exogenous variable: the presence of
informal firms in the sector in which the firm operates, can be used as another proxy of competition22
(see Appendix C and Table A1 in Appendix A). It is still possible that the competition of the informal
sector pushes firms to perform better. However, if the informal "unfair" competition prevents firms
from innovating and being more productive, it will be possible to know which effect prevails (Ospina
and Schiffbauer, 2010).
4- Estimation of the System 4.1- Estimation Methodology
If the interactions mentioned in section 3 are found in the Indian manufacturing sample, OLS estimates are biased due to the endogeneity of the variables of the system. We choose instrumental estimations to correct for the simultaneity bias. Multivariate instrumental estimations (such as 3SLS, FIML or GMM-3SLS) are not always possible because of convergence issues. In addition, a single specification error is sufficient to "contaminate" the entire system. Potential problems may be encountered at finite distance and efficiency gains are possible in case of over-identification only.
22 The share of firms reporting informal competition as a constraint is an increasing function of the size of the market on which they operate (positive correlation). This binary variable is also less subject to measurement errors than the variable indicating the number of competitors of each firm.
Finally, the exclusion-restrictionconditions are not easy to verify, especially in a 5 equations system. These conditions ask to find at least one variable specific to each equation, exogeneous in all the equations of the system, and significant in the equation in which it is introduced. This variable is then excluded from the other equations. If the 5 equations are estimated in a univariate mode, no causal link between the instrument and the variable instrumented is needed, a simple correlation is
sufficient23. In addition, because of the large number of control variables introduced in the equations,
the correlation between the 5 variables of the system and the variables used as "instruments" does not always seem high. It is possible, in that case, that the "instruments" be weak in the sense of Staiger
and Yogo (1997)24. For all these reasons, we choose to use the univariate estimations to estimate the
system (as in Bustos, 2011).
In an univariate frame, the 2SLS are the simplest and most commonly used approach among the instrumental methods. However, although there are no robust estimators in case of weak instruments, the 2SLS are considered as the least efficient in that case. Other methods, such as the Limited Information Maximum Likelihood (LIML) and the Continuously Updating Estimator (CUE), are generally preferred in that situation.
4.2- The Equations of the System 4.2.1- Equation of Training
The decision to start a training program can be influenced by doing R&D, innovating, the productivity level, exporting and competition (see section 3). The investment climate and characteristics of the
firms may also play a role in this decision (see equation 1)25. To estimate the system, we need to
introduce in the equation one variable correlated with training, exogeneous in all 5 equations, and excluded from the 4 other ones. We use the obstacle variable related to the access to a skilled labor
force as instrument26. One can think that the more a firm is constrained in its recruitment of skilled
labor, the more it may decide to train its own workers. Since this variable was part of the "human capacity" indicator (see Appendix C), it has been excluded when processing this aggregate indicator. The equation of training is as follows:
Training i = α1+ β1;1 R&D i + β1;2 Innovation i + β1;3 Productivity i + β1;4 Exports i + δ1 X i + γ1 Y i + μ1
Access to Qualified Labor i + λ1 Competition i + ε1 (1)
where X and Y are the matrix of the investment climate variables and the individual characteristics of the firms respectively, α1, β1;1 to 4, δ1, γ1, μ 1, λ 1 the parameter to be estimated, ε1 the error term, and i the indicator of the firm.
4.2.2- Equation of Research and Development (R&D)
Similarly, R&D is regressed on the 4 other variables of the system, a set of control variables composed of competition, firms' investment climate and characteristics, and the instrument variable (see equation 2). It may be thought that the more difficult it is to obtain permits and licenses, the more difficult it will be to patent an invention. Thus, the answer to the question "On a scale of 0 to 4, to what degree are licenses and permits an obstacle to the operations of the firm?” can be decisive to
23 It is then possible that the instrument is not one of the explanatory variables
24 "Instrument" usually refers to the univariate environment. In the multivariate case, they are in fact exclusion variables. Because the first step of the 3SLS is a 2SLS-based estimate of reduced forms, these exclusion variables are interpreted here as instruments. 25 The characteristics of the firms that we retrained in section 2.4.3. are: firms' age and size (proxied by the number of workers in t-3), the partnership with a large company, the fact to belong to an industrial association, the sector and the State in which they operate. 26 Answer to the question "On a scale of 0 to 4, to what degree is access to a skilled workforce an obstacle for the operation of the firm?» (see Appendix C).
explain R&D. This investment climate variable will not be introduced in the 4 other equations and
thus will not be used as proxy of government relation in all regressions27.The equation of R&D is as
follows:
R&D i = α2 + β2;1 Training i + β2;2 Innovation i + β2;3 Productivity i + β2;4 Exports i + δ2 X i + γ2 Y i +
μ2 Access to Permits & Licenses i + λ2 Competition i + ε2 (2)
where X and Y are the matrix of the investment climate variables and the individual characteristics of the firms respectively, α2, β2;1 to 4, δ2, γ2, μ2, λ2 the parameter to be estimated, ε2 the error term, and i
the indicator of the firm. 4.2.3- Equation of Innovation
In the innovation equation, we control for the 4 other variables of the system, competition, the investment climate and characteristics of firms (see equation 3). We choose the fact of having a foreign license as instrument for innovation. Having a foreign license makes possible to use an invention from abroad and introduce something new at home. We make the reasonable assumption that this variable has no effect on the 4 other variables of the system, as it does not seem very
correlated with them.The equation of innovation is as follows:
Innovation i = α3 + β3;1 Training i + β3;2 R&D i + β3;3 Productivity i + β3;4 Exports i + δ3 X i + γ3 Y i +
μ3 Foreign Licenses i + λ3 Competition i + ε3 (3)
where X and Y are the matrix of the investment climate variables and the individual characteristics of the firms respectively, α3, β3;1 to 4, δ3, γ3, μ3, λ3 the parameter to be estimated, ε3 the error term, and i
the indicator of the firm.
4.2.4- Equation of Productivity
We regress the indicator of productivity on the variables of training, innovation, exports and control for competition, the investment climate and the characteristics of the firms (see equation 4). Several instruments are possible:
-the output per worker in t-3. Because of its strong auto-regressivity, this variable may capture the effect of the investment climate and other explanatory variables. This is why this variable is not retained, although it is exogenous in the other equations.
-the stocks of capital and of intermediate consumption. Since we control for the sector, introducing
these variables would make it possible to distinguish their effect within the same sector
The exclusion of these two variables from the other equations makes sense. In the R&D, training and innovation equations, the effect of equipment goes more likely through the information and
communication technologies (ICT), especially since we already control for sectors and firms size. In
the export equation, the effect of capital and intermediate consumption, if any, passes through
productivity, in addition to thefirms’ size andsector fixed-effects who control for the effect of each
sector capital intensity. The equation of productivity is as follows:
Productivity i = α4 + β4;1 Training i + β4;2 Innovation i + β43 Exports i + δ4 X i + γ4 Y i + μ4.1 Capital i
+ μ4.2 Intermediate Consumption i + λ4 Competition i + ε4 (4)
27 As for infrastructure, no aggregate indicator of government relation was constructed for the reasons explained in section 2.4.2. It is corruption that we chose as proxy, as explained in section 4.3.
where X and Y are the matrix of the investment climate variables and the individual characteristics of the firms respectively, α4, β4;1 to 4, δ4, γ4, μ4.1 and 2, λ4 the parameter to be estimated, ε4 the error term,
and i the indicator of the firm. 4.2.5- Equation of Exports
The variables introduced in the export equation are innovation, productivity, investment climate and
the characteristics of the firms (see equation 5). Two instruments are chosen: international quality
certification and being located in an export zone. The second variable is certainly more exogenous than the first one in the 5 equations of the system. In addition, it does not seem correlated with the other 4 variables of interest. The equation of exports is as follows:
Exports i = α5 + β5;1 Innovation i + β5;2 Productivity i + δ5 X i + γ5 Y i + μ5.1 International Quality
Certification i + μ5 .2 Export Zone i + ε 5 (5)
where X and Y are the matrix of the investment climate variables and the individual characteristics of the firms respectively, α5, β5;1 to 4, δ5, γ5, μ5.1 and 2, λ5 the parameter to be estimated, ε5 the error term,
and i the indicator of the firm.
4.3- Other Methodological Aspects: Instruments and Investment Climate Indicators
Univariate instrumental estimations require instrument variables to be exogenous in the equation in which they appear, but also in the other 4 equations. Starting a training or a R&D program, innovating, being productive and exporting must not have any effect on these variables. Having undertaken R&D and innovated during the last 3 years, for example, must not have a direct impact on having an international quality certification, what can be a strong assumption. Because there are two possible instruments for productivity and exports, it will be possible to verify, ex post, the exogeneity of these
instruments through the Hansen test.
The variables used to compute the indicators of access tofinance, ICT and security are those listed in
Appendix C. The “human capacity” indicator, however, cannot include the variable “access to a skilled workforce”. This variable serves as instrument in the training equation and has to be removed
from the other equations of the system. Regarding the international openness and access to global
knowledge indicator, the share of capital held by foreign companies is omitted because the variable is never significant. Two other variables are also excluded: having a foreign licence and exports, the first one being the instrument variable in the innovation equation, and the second one, a main variable of the system. The variable used as proxy of access to global knowledge is therefore the rate of inputs from foreign origin.
All the variables of the government relation indicator have not been used either. Actually, many of these variables are difficult to interpret and low in quality. For clarity purpose, we choose corruption through alternatively two variables: “obstacle for the operations of the firms” and “gifts when inspected” as proxy of government relation, since corruption is considered as the main constraint faced by Indian firms (see Table A1 in Appendix A). The omission of most variables of “government relation” does not seem detrimental since we introduce size, and State and sector fixed-effects in all regressions.
For the same reasons, no aggregate indicator of infrastructure is constructed. Electricity being, with corruption and tax rate one of the 3 main obstacles encountered by the Indian firms (see Table A1 in
Appendix A), only the quality of the electricity network is taken into account. We choose the variable
on generators as proxy of power outages, since this variable seems more reliable than the other ones28.
Since agglomeration may have two opposite effects (a positive one linked to synergies between agents, and a congestion one due to insufficient space and facilities), no aggregate indicator is constructed in that case either. We choose the size of the city,and its square to capture the two opposite effects, as well as the fact of being located in an industrial zone to proxy the agglomeration indicator. In next section, we present the results of the univariate instrumental estimations when the Limited Information Maximum Likelihood (LIML) methodology is used. This method is preferred to the 2SLS in case of weak instruments. Results of main tests are reported in the tables. In addition to the 5 variables of the system, investment climate can also be endogenous. The results presented are the ones when the investment climate variables are supposed exogenous (Table D1 in Appendix D), as
well as those using their predicted values, as explained in section 2.4.1 (see Tables D2 and D3 in
Appendix D).
More generally, conclusions are not very sensitive to the way in which the investment climate is introduced in the regressions. They change little according to the different proxies used when processing the aggregated indicators, depending on whether the investment climate is instrumented
or not, and according to the instrumentation method. Conclusions are also not very sensitive to the
different proxy of innovation, productivity and export. Finally, because the form of heteroscedasticity is unknown, the estimated standard deviations are corrected according to the White's method. This method is preferred to clustering because it is controlled for States and agglomeration effects in the regressions.
5- Estimation Results
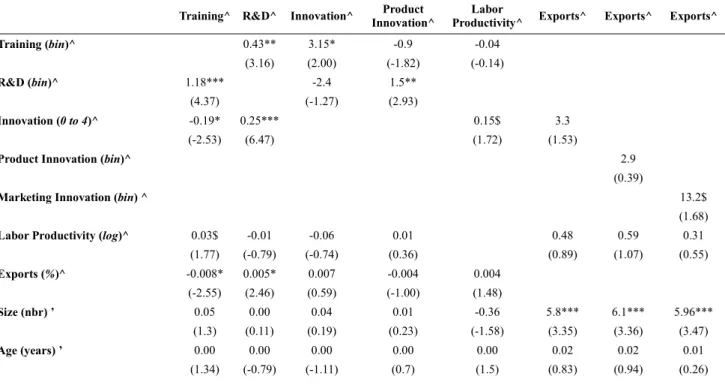
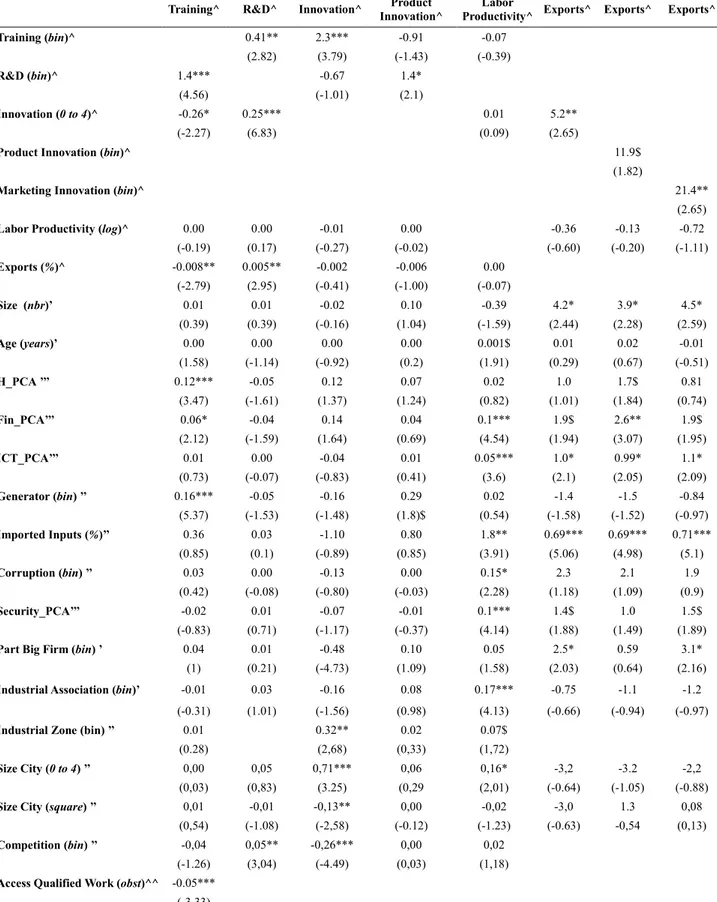
As mentioned in previous section, we present the results of the univariate instrumental estimations
when the Limited Information Maximum Likelihood (LIML) methodology is used. Estimations
results in Appendix D (Tables D1, D2 & D3) are discussed below29. The main objective of this work
being to analyse the interactions between firm-level R&D, training, innovation, productivity and exports, the role of the other variables (ie. investment climate in particular) is briefly presented. 5.1- Equation of Training
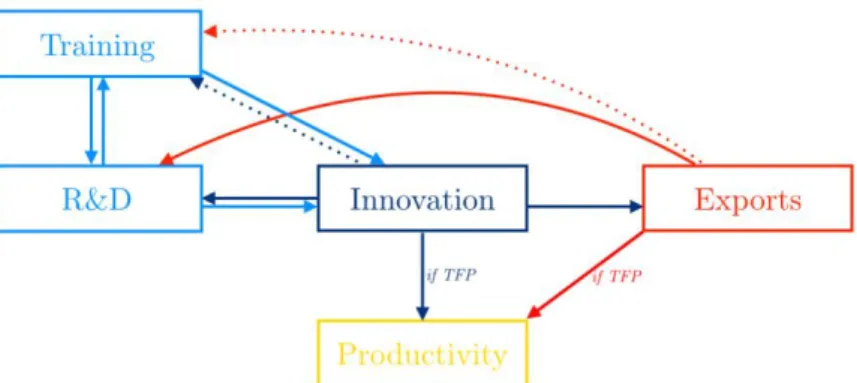
Undertaking R&D seems to push Indian manufacturing firms to train their workers (see Figure 2). On the opposite, a negative and significant effect of innovation and exports is found. This result suggests that low innovation and low export rate act as an incentive for firms to train the workforce in order to innovate and then export more. For low performing firms, training is less costly to finance than R&D (see section 3.3). For more performing firms, the incentive to undertake a training programme is indirect and goes, in both cases, through R&D (see next section).
Productivity does not appear as an incentive to train staff, suggesting that training is part of another dynamics, linked to R&D and innovation more specifically. High or low productivity does not look like an incentive to launch a training program in order to innovate or be more productive30.
(2) the number of power outages depends largely on the State. When regressed on the States fixed-effects, half of the variance is explained by States. However, State fixed-effects are already included in the equations.
29 For simplicity, we only present the results when using the number of different types of innovations in the last three years (variable between 0 and 4), the labor productivity (LP) and total factor productivity (TFP), and the total share of production exported (directly and indirectly).
30 In the case of TFP, effect on training is indirect, through innovation, for low productive firms (see section 5.3) and increased productivity is expected from innovation, not directly from training (see section 5.4).
As for the investment climate, it appears to have a positive effect on the Indian firms' decision to initiate training, especially human capacity, access to financing and to infrastructure (proxied by power supply). In a satisfactory environment, it is worth investing in training to reduce the deficit in skilled labor and to innovate. These results are all the more important in the context of Indian States investment climate deficiencies.
5.2- Equation of Research and Development (R&D)
Results suggest that exporting and innovating encourage Indian manufacturing firms to undertake
R&D (see Figure 2), what is more costly than to initiate a training program, the solution chosen by
the less innovative and less exporting firms (see previous section). Similarly, the more firms train their workers, the more they are willing to embark on R&D, what highlights a virtuous circle between these two components.
As for training, productivity does not seem to play a role in the Indian manufacturing firms’ decision
to initiate R&D. Investment climate does not look to be determinant either, as only competitionwould
stimulate Indian firms R&D. The effect of the investment climate on R&D, thus, would be indirect,
through the incentives of firms to train employees and through innovation (see next section), for human capacity, infrastructure and financing in both cases.
5.3- Equation of Innovation
Trained workforce looks determinant to improve firms’ capacity to innovate (see Figure 2). This is particularly true for process, organizational, management and marketing innovations. R&D, on its side, stimulates product innovation mainly (Griffith et al. 2006; Polder et al., 2010). These findings highlight a virtuous circle between the 3 components of innovation: the 2 innovation inputs (R&D and training) and the innovation output. Undertaking training and R&D supports innovation, which in return encourages firms to do more R&D and training. In addition, training and R&D seem to reinforce each other in the innovation process: doing R&D would incite Indian firms to train their workers, and training would stimulate R&D in return (see previous section). These results are significant given the low investment in research by Indian manufacturing companies (Sharma, 2012; Mitra et al., 2014).
As for training and R&D, a high productivity does not prove to be a factor of innovation, invalidating
the self-selection into innovation hypothesis. It looks like that the incentive to innovate of the Indian manufacturing firms comes predominately from R&D, training and the investment climate. Low productive firms, however, seem willing to innovate more to improve their performances, as shown in Table D3 for TFP. Similarly, it seems that exporting firms do not self-select themselves into innovation. As for
firms' environment, human capacity, access to infrastructure and to financing seems to count for
innovation.
5.4- Equation of Productivity
In the case of TFP (Table D3), the Indian manufacturing firms seem to benefit from a learning process when exporting, as well as from innovating in the case of marketing, management and organizational innovation in particular (like in Polder et al., 2010; see Figure 2). This result validates the “learning by exporting” hypothesis. As for training, the effect proves indirect, through R&D and innovation. Investment climate participates in the Indian manufacturing firm-level differences in productivity when the corresponding variables are instrumented by their predictions (Tables D2 and D3). This is the case of all aspects of the firms' environment: human capacity, infrastructure, ICT, financing, international openness, corruption and security. This finding is all the more important in the context
of the Indian States business environment deficiencies where firm-level productivity is often low (Mitra et al, 2002 and 2014). Improving exports, innovation and the investment climate would thus boost the manufacturing productive performance.
Coefficients, thus, vary according to whether the investment climate variables are instrumented or not. This sensitivity, higher than in the other 4 equations, should come from the simultaneity bias of the investment climate variables, higher in the productivity equation. Indeed, firms can change their environment only if they have the means to do so. Since we control for productivity in the other 4 equations, the simultaneity bias is then less likely. This result justifies the instrumentation of the investment climate variables.
Figure 2: Main Estimation Results -
An arrow represents a positive and significant effect, and a dashed arrow a significant and negative effect
5.5- Equation of Exports
It does not seem that the Indian firms "self-select themselves into exporting". This effect is not found
in the Indian sample, as productivity does not appear decisive to explain firms' exports (see Figure
2). Main determinants of exports are innovation (product, management and marketing innovation in
particular), what validates the “self-selection into exporting” assumption of innovation, the investment climate, especially access to financing, ICTs and to global knowledge (through imports of intermediate goods more specially) as well as international quality certification and to be located
in an export zone. These results are in line with the Make in India campaign which aims at making
the manufacturing sector more integrated into the world economy. 6- Conclusion and Policy Recommendations
The objective of this study was to identify the interactions between firm-level innovation (in the broad sense of the Oslo Manual), productivity and exports in the case of the Indian manufacturing industry. Our results suggest the existence of a virtuous circle between R&D, innovation and exports, in which innovation plays a central role. Innovative firms would engage into R&D, which in turn would materialize into more innovations. These innovations would increase firm exports, which would encourage firms to undertake more research in return (and to innovate and export more consequently). Training is associated to the process. Trained workers would stimulate R&D, which in turn would materialize into innovation, and then, into more exports. Trained workers would allow more innovation directly as well. These findings highlight a virtuous circle between the 3 components of innovation as well: the 2 innovation inputs (R&D and training) and the innovation output. These results are noteworthy because the Indian manufacturing firms are known for not investing enough in research (Sharma, 2012; Mitra et al., 2014).
Innovation thus is central to export, as Indian innovative firms self-select themselves into exporting. Innovation seems important for productivity as well, as it would increase firm-level TFP. These findings are all the more significant in the context of low exports and low productivity of the Indian manufacturing sector (Mitra et al., 2002 and 2014). Helping the Indian manufacturing firms to innovate (in the broad sense of the Oslo Manual) would certainly participate in the effort of the government to make this sector more productive and more integrated into the world economy. As shown by our results, this could pass by an increased access to training, R&D and foreign licences, as well as through competition and the improvement of the investment climate, all these actions being part of the National Manufacturing Policy program and the Make in India campaign. This would also be important for the Indian manufacturing firm-level productive performances since our results highlight a learning process when exporting. Firm-level productivity would thus be even more enabled if export rates were increased.
In addition to innovation, exports are sensitive to the investment climate in which the firms operate, as well as to obtaining international quality certifications and to be located in an export zone. All these results also go in the direction of the recent programs launched by the Indian governments to make of the manufacturing a sector of growth and competitiveness.
As for the investment climate, our results confirm its significance in explaining the performance gaps across Indian manufacturing firms. This is true for the productivity gaps for all dimensions of the investment climate. Improving human capacity, infrastructure (power supply especially), ICT, access to financing, international openness, corruption and security would enhance firms productivity. Furthermore, it looks like a better access to financing, ICT and global knowledge (through importing in particular) would help the Indian manufacturing firms to export more. Access to financing, infrastructure and human capacity would be of particular importance for the Indian manufacturing firms to innovate, both directly and through training. Finally, competition would incite firms to undertake R&D and be more productive.
Investment climate thus appears as an essential dimension of the innovation process in India. Investment climate looks also critical for enhancing productivity and exports, both directly and through innovation. Improving investment climate would thus contribute to the Indian manufacturing firm-level performances in a cumulative process. These results are all the more significant in the context of the Indian States business environment deficiencies, as well as the recent Make in India campaign which aims at making of the manufacturing sector a new engine of growth, innovation and export.
To conclude, we will however recall the main limitations of the present work. The reliability of the
data can be discussed. Innovation (in the broad sense of the Oslo Manual) in particular is probably
overestimated (Cirera and Muzi, 2016). The tests also show that the instrumentation may not always
be strong enough (in the innovation equation more specifically). Although robust tests with weak instrumentation are carried out, the econometric literature is very recent on this point and will be further developed in the future. This is why, although attempts have been made to limit the various possible biases (measurement error and simultaneity in particular), it would still seem too uncertain to definitively conclude on causalities
![[PDF] Formation avancé pour apprendre à travailler avec Photomatix Pro et l’imagerie HDR | Cours informatique](data:image/gif;base64,R0lGODlhAQABAIAAAP///wAAACH5BAEAAAAALAAAAAABAAEAAAICRAEAOw==)