Publisher’s version / Version de l'éditeur:
Optics Letters, 33, April 1 7, pp. 732-734, 2008-04-01
READ THESE TERMS AND CONDITIONS CAREFULLY BEFORE USING THIS WEBSITE. https://nrc-publications.canada.ca/eng/copyright
Vous avez des questions? Nous pouvons vous aider. Pour communiquer directement avec un auteur, consultez la première page de la revue dans laquelle son article a été publié afin de trouver ses coordonnées. Si vous n’arrivez pas à les repérer, communiquez avec nous à PublicationsArchive-ArchivesPublications@nrc-cnrc.gc.ca.
Questions? Contact the NRC Publications Archive team at
PublicationsArchive-ArchivesPublications@nrc-cnrc.gc.ca. If you wish to email the authors directly, please see the first page of the publication for their contact information.
NRC Publications Archive
Archives des publications du CNRC
This publication could be one of several versions: author’s original, accepted manuscript or the publisher’s version. / La version de cette publication peut être l’une des suivantes : la version prépublication de l’auteur, la version acceptée du manuscrit ou la version de l’éditeur.
For the publisher’s version, please access the DOI link below./ Pour consulter la version de l’éditeur, utilisez le lien DOI ci-dessous.
https://doi.org/10.1364/OL.33.000732
Access and use of this website and the material on it are subject to the Terms and Conditions set forth at
Artifact removal in Fourier-domain optical coherence tomography with
a piezoelectric fiber stretcher
Vergnole, Sébastien; Lamouche, Guy; Dufour, Marc
https://publications-cnrc.canada.ca/fra/droits
L’accès à ce site Web et l’utilisation de son contenu sont assujettis aux conditions présentées dans le site LISEZ CES CONDITIONS ATTENTIVEMENT AVANT D’UTILISER CE SITE WEB.
NRC Publications Record / Notice d'Archives des publications de CNRC:
https://nrc-publications.canada.ca/eng/view/object/?id=7b3e6c2b-220e-4d22-b47a-2b2c1e2d83f1 https://publications-cnrc.canada.ca/fra/voir/objet/?id=7b3e6c2b-220e-4d22-b47a-2b2c1e2d83f1
Artifact removal in Fourier-domain optical
coherence tomography with a piezoelectric fiber
stretcher
Sébastien Vergnole,1,*Guy Lamouche,1and Marc L. Dufour
1
Industrial Materials Institute, National Research Council Canada, 75 Boulevard de Mortagne, Boucherville, Quebec, J4B 6Y4, Canada
*Corresponding author: Sebastien.Vergnole@cnrc-nrc.gc.ca
Received September 26, 2007; revised February 15, 2008; accepted February 18, 2008; posted March 4, 2008 (Doc. ID 87957); published March 31, 2008
We describe an artifact removal setup swept-source optical coherence tomography (OCT) system that en-ables high-speed full-range imaging. We implement a piezoelectric fiber stretcher to generate a periodic phase shift between successive A-scans, thus introducing a transverse modulation. The depth ambiguity is then resolved by performing a Fourier filtering in the transverse direction before processing the data in the axial direction. The dc artifact is also removed. The key factor is that the piezoelectric fiber stretcher can be used to generate discrete phase shifts with a high repetition rate. The proposed experimental setup is a much improved version of the previously reported B-M mode scanning for spectral-domain OCT in that it does not generate additional artifacts. It is a simple and low-cost solution for artifact removal that can easily be applied. © 2008 Optical Society of America
OCIS codes: 110.4500, 170.4500, 100.5070.
In Fourier-domain optical coherence tomography (FD-OCT), the signal is collected as a function of the wavelength and the spatial information is recovered by Fourier transform. The main drawback of such a technique is that, since a real signal is acquired, the Fourier transform is symmetric around the origin. Therefore, one cannot distinguish the positive depth from the negative depth. Additionally, autocorrela-tion terms in the recorded signal lead to a spurious component at zero frequency (dc artifact). In spectral-domain OCT (SD-OCT) [1], a broadband source is used to illuminate the sample and the wavelengths are separated upon detection. A common solution to remove artifacts is to introduce phase shifts between measurements [2–4]. In swept-source OCT (SS-OCT) [5], the wavelengths are separated upon generation with a wavelength sweeping source. Efficient setups have been proposed to remove artifacts by shifting the frequency using electro-optic [6] or acousto-optic modulators [7,8]. Although efficient, these ap-proaches increase significantly the cost of the OCT system.
In SD-OCT, a solution that uses the B-M scanning method with a mirror mounted on a piezoelectric transducer has been proposed by Yasuno et al. [9]. In this approach, a phase shift (M-scan) is introduced between successive A-scans to generate a B-scan with transverse modulation that is used to remove both the depth degeneracy and the dc artifact. The main advantage of this approach is that it has a higher sta-bility with respect to phase and amplitude fluctua-tions than for phase-shifting techniques that use suc-cessive spectra during continuous scanning for complex signal reconstruction. A very similar ap-proach has also been proposed by Wang [10,11] in SD-OCT. In [9], the experimental setup does not al-low discrete increments in phase shift at a high speed. Consequently, a triangular ramp is used that generates other artifacts that require further data
processing to be removed. In [10,11], a sawtooth waveform is applied, and this technique does not re-move the autocorrelation and cross-correlation arti-facts. We present an alternative method applied to SS-OCT and using a piezoelectric fiber stretcher (PFS). The use of a fiber stretcher improves over pre-vious papers by allowing the fast generation of dis-crete steps in the phase shift generated between A-scans. This avoids the introduction of additional artifacts and leads to a more efficient technique. We recently reported preliminary results for this ap-proach [12], and we provide here a detailed descrip-tion of the technique.
The signal processing approach has some similar-ity with phase-shifting interferometry [2]. We illus-trate it by considering the trivial case of a single re-flector. For a B-scan, a simplified version of the interferometric signal is i共x ,兲 = k0+ cos共kxx + k兲, where k0is a constant that includes the autocorrela-tion terms, kx is linked with the phase shift
intro-duced by the PFS, x is the transverse position, k is linked with the wavelength sweeping of the source, and is the optical frequency. We first compute the Fourier transform of i共x ,兲 along the x transverse di-rection: I共u,兲 = k0␦共u兲 + 1 2␦共u − kx兲e −ik+1 2␦共u + kx兲e ik, 共1兲
where u is the spatial frequency (Fourier conjugate of
x), k0␦共u兲 is the dc component, the second term on the right hand side is the OCT data, and the last term is the complex conjugate of the second one. A high-pass filtering with a rectangular window is then per-formed to keep only the data corresponding to the OCT signal to yield: Iˆ共u ,兲 = 1 / 2关␦共u − kx兲兴e−ik. Then,
the inverse transverse Fourier transform is evaluated:
732 OPTICS LETTERS / Vol. 33, No. 7 / April 1, 2008
iˆ共x,兲 = Fx−1关Iˆ共u,兲兴 =1 2共e
−ikxx兲e−ik. 共2兲
Finally, as usually performed in FD-OCT, the axial inverse Fourier transform is evaluated:
Iˆ共x,z兲 = Fz−1关iˆ共x,兲兴 =
1 2关e
−ikxx兴关␦共z − k兲兴, 共3兲
where z is the Fourier conjugate of and is propor-tional to the depth position. It must be noted that we display the OCT image by computing 20⫻ log共兩Iˆ共x , z兲兩兲.
Figure1shows an experimental implementation of the proposed SS-OCT setup. It is a Mach–Zehnder fiber-based interferometer. The source is a Thorlabs swept source with a 1325 nm center wavelength and an 85 nm FWHM. The theoretical axial resolution is
␦z = 9.1m in air. The A-scan rate is 16 kHz when us-ing both the backward and the forward wavelength scans. The setup is fitted with a PFS from Optiphase (PZ1-STD-FC/APC). This device consists of 10 m of fi-ber wound around a cylindrical piezoelectric trans-ducer. Figure2gives the shape of the low voltage ap-plied to the PFS. The PFS drive signal is adjusted to achieved a / 2 phase shift between two successive forward wavelength scan interferograms. For the current work, the system operates at a reduced rate of 8 kHz since we use only the forward wavelength scans.
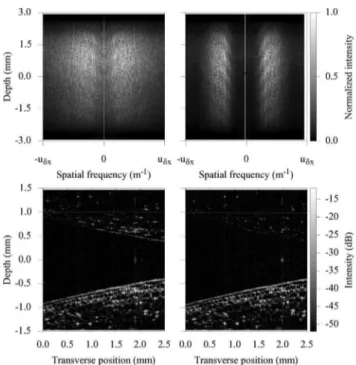
One of the key adjustments is to choose a trans-verse step small enough to ensure efficient artifact removal. Introducing a periodic phase shift between A-scans can be seen as introducing a carrier spatial frequency in the transverse direction. By taking the Fourier transform in the transverse direction, one ob-tains three components in the spectrum: a positive part centered around the carrier frequency, a zero component, and a negative part centered around the negative of the carrier frequency. The width of the positive and negative parts is related to the spatial frequency content of the image in the transverse di-rection. The amplitude of the transverse Fourier spectrum from an OCT image of an onion is shown in Fig.3for two step sizes: 1.2 and 2.5m. Let␦x be the
transverse step and u␦x= 1 /关2共␦x兲兴 the Nyquist
spa-tial frequency. The OCT data are associated in Fig.3 to the positive part of the spectrum 共兴0 : u␦x兴兲, while
the conjugate OCT data are linked to the negative
part共关−u␦x: 0关兲. For the larger transverse step,
corre-sponding to a low carrier frequency, the negative part of the spectrum leaks into the positive part (Fig. 3, top left). This leads to the mixing of the OCT data and their conjugate and to an insufficient artifact re-moval (Fig.3, bottom left). By selecting a small trans-verse step, thus a large carrier frequency, the positive and negative parts of the spectrum are well sepa-rated (Fig. 3, top right) and the artifact removal is very efficient (Fig. 3, bottom right). Decreasing the transverse step size adversely increases the mea-surement time, so a trade-off must be selected. A con-venient criterion is a step size that corresponds to a Nyquist frequency that is two times larger than the full width of the transverse spectrum of the OCT im-age (⌬u defined at 1 / e): 1 /关共2␦x兲兴 ⬎ 2⌬u. The width ⌬u is related to the speckle size s (full width at 1 / e) by ⌬u = 4 /共s兲. The speckle size is given by s = 共0.68 ⫻ 4f兲 / 共
冑
2d兲, taking into account the illuminatingFig. 1. (Color online) SS-OCT setup. Cp1 and Cp2,
cou-plers; PFS, piezoeletric fiber stretcher; PC, polarization controller; Cir1 and Cir2, circulators; BD, balanced detection.
Fig. 2. (Color online) Variation of the voltage applied to
the PFS.
Fig. 3. Top view of the normalized transverse Fourier
transform for different transverse steps [2.5 m (top left) and 1.2 m (top right)] and the corresponding OCT images (bottom) of an onion with artifact removal processing. The onion was put under the zero path delay to better appreci-ate the efficiency of the artifact removal.
and detecting optics along with contribution from a high density of scatterers [13]. The parameter d is the diameter of the incoming light beam, and f is the focal length of the illuminating and collecting optics. Therefore, this leads to the condition for the trans-verse step size:
␦x ⬍0.68
4
冑
2 fd. 共4兲
In the example of Fig. 3, we have = 1.325m, f = 14.5 mm, and d = 2 mm, which gives a speckle size of 6m and thus to the condition: ␦x ⬍ 1.2m. The results of Fig.3illustrate the validity of the criterion. The rightmost image meets the upper limit of the cri-terion, whereas the leftmost image was obtained with a twice larger transverse step size.
To validate our approach, we first evaluate the at-tenuation of the mirror artifact: a mirror was used as a sample and the ratio of the surface signal to its complex conjugate was measured to be greater than 32 dB in the range 关−0.5: + 0.5兴 mm. Then, a cross section of a finger tip of a healthy human volunteer was acquired. Figure 4 shows the images without (left) and with (right) artifact removal processing. The imaged area is 3 mm wide and 3 mm deep with the zero path delay set in the middle of the depth scale. As seen on the image on the right, the dc arti-fact is completely removed and the mirror image is greatly reduced with our postprocessing technique. The apparent structure below the skin of the finger that can hardly be seen on the left image is clearly resolved in the right one, providing a good apprecia-tion of the efficiency of the proposed method. The op-tics used to acquire this image is different from that of Fig. 3. The transverse step size is half the value determined by the condition in Eq.(4).
To our knowledge, this is the first report of a trans-verse scanning method applied to SS-OCT and using a PFS. The implementation of a PFS solves the addi-tional artifact problem encountered in [9]. Our post-processing enables the removal of autocorrelation
noise, which is not the case in [10,11]. The main ad-vantages of using such a technique are as follows. First, it is very easy to implement experimentally be-cause the PFS is a fiber-based device with conven-tional connectors (type FC/APC) and thus easy to connect with other photonic devices. Second, it is very efficient in terms of transmission power since the only small losses are due to the fiber connections. Third, it is low cost compared with the techniques us-ing electro-optic or acousto-optic modulators. Finally, it must be noted that the PFS does not affect the measurement nor request any changes in the setup when not in use. This technique can also be applied to SD-OCT setups.
It came to our attention that three articles [14–16] that used a similar approach to ours to achieve full-range complex FD-OCT imaging have been published during the reviewing process of this letter. However, these papers use the galvanometer scanning system to perform the transverse modulation and are ap-plied to SD-OCT systems. Our proposed approach is of more general application since it does not depend on the transverse scanning technique.
We thank Bruno Gauthier for his technical contri-bution. We acknowledge the financial support of the Genomics and Health Initiative of the National Re-search Council Canada.
References
1. A. F. Fercher, C. K. Hitzenberger, G. Kamp, and S. Y. El Zaiat, Opt. Commun. 117, 43 (1995).
2. M. Wojtkowski, A. Kowalczyk, R. Leitgeb, and A. F. Fercher, Opt. Lett. 27, 1415 (2002).
3. E. Götzinger, M. Pircher, R. A. Leitgeb, and C. K. Hitzenberger, Opt. Express 13, 583 (2005).
4. A. Bachmann, R. Leitgeb, and T. Lasser, Opt. Express
14, 1487 (2006).
5. S. R. Chinn, E. A. Swanson, and J. G. Fujimoto, Opt. Lett. 22, 340 (1997).
6. J. Zhang, J. S. Nelson, and Z. Chen, Opt. Lett. 30, 147 (2005).
7. S. H. Yun, G. J. Tearney, J. F. de Boer, and B. E. Bouma, Opt. Express 12, 4822 (2004).
8. A. M. Davis, M. A. Choma, and J. A. Izatt, J. Biomed. Opt. 10, 064005 (2005).
9. Y. Yasuno, S. Makita, T. Endo, G. Aoki, M. Itoh, and T. Yatagai, Appl. Opt. 45, 1861 (2006).
10. R. K. Wang, Appl. Phys. Lett. 90, 054103 (2007). 11. R. K. Wang, Phys. Med. Biol. 52, 5897 (2007).
12. S. Vergnole, G. Lamouche, M. Dufour, and B. Gauthier, Proc. SPIE 6627, 66271J (2007).
13. G. Lamouche, C.-E. Bisaillon, S. Vergnole, and J.-P. Monchalin, Proc. SPIE 6847, 684724 (2008).
14. B. Baumann, M. Pircher, E. Götzinger, and C. K. Hitzenberger, Opt. Express 15, 13375 (2007).
15. R. A. Leitgeb, R. Michaely, T. Lasser, and S. C. Sekhar, Opt. Lett. 32, 3453 (2007).
16. L. An and R. K. Wang, Opt. Lett. 32, 3423 (2007). Fig. 4. Image of a finger tip (a) without processing and (b)
with processing. Images are 3 mm wide and 3 mm deep with a transverse step of 1 m.