Publisher’s version / Version de l'éditeur:
Vous avez des questions? Nous pouvons vous aider. Pour communiquer directement avec un auteur, consultez la première page de la revue dans laquelle son article a été publié afin de trouver ses coordonnées. Si vous n’arrivez pas à les repérer, communiquez avec nous à PublicationsArchive-ArchivesPublications@nrc-cnrc.gc.ca.
Questions? Contact the NRC Publications Archive team at
PublicationsArchive-ArchivesPublications@nrc-cnrc.gc.ca. If you wish to email the authors directly, please see the first page of the publication for their contact information.
https://publications-cnrc.canada.ca/fra/droits
L’accès à ce site Web et l’utilisation de son contenu sont assujettis aux conditions présentées dans le site LISEZ CES CONDITIONS ATTENTIVEMENT AVANT D’UTILISER CE SITE WEB.
Journal of Building Physics, pp. 1-21, 2020-12-27
READ THESE TERMS AND CONDITIONS CAREFULLY BEFORE USING THIS WEBSITE. https://nrc-publications.canada.ca/eng/copyright
NRC Publications Archive Record / Notice des Archives des publications du CNRC :
https://nrc-publications.canada.ca/eng/view/object/?id=3df7072e-a7df-4467-8f2b-f324a3f360c3 https://publications-cnrc.canada.ca/fra/voir/objet/?id=3df7072e-a7df-4467-8f2b-f324a3f360c3
NRC Publications Archive
Archives des publications du CNRC
This publication could be one of several versions: author’s original, accepted manuscript or the publisher’s version. / La version de cette publication peut être l’une des suivantes : la version prépublication de l’auteur, la version acceptée du manuscrit ou la version de l’éditeur.
For the publisher’s version, please access the DOI link below./ Pour consulter la version de l’éditeur, utilisez le lien DOI ci-dessous.
https://doi.org/10.1177/1744259120980032
Access and use of this website and the material on it are subject to the Terms and Conditions set forth at
Determining the thermal resistance of a highly insulated wall
containing vacuum insulation panels through experimental, calculation
and numerical simulation methods
Moore, Travis V.; Cruickshank, Cynthia A.; Beausoleil-Morrison, Ian;
Lacasse, Michael
Determining the thermal resistance of a highly insulated wall containing vacuum insulation panels
1
through experimental, calculation and numerical simulation methods
2
Travis V. Moorea,b,*, Cynthia A. Cruickshankb, Ian Beausoleil-Morrisonb, Michael Lacassea 3
a National Research Council Canada, 1200 Montreal Road, Ottawa, Ontario, Canada, K1A0R6 4
b Carleton University, 1125 Colonel By Drive, Ottawa, Ontario, Canada, K1S 5B6 5
* Corresponding author: Travis.Moore@nrc-cnrc.gc.ca, +1 613-949-0194
6 7
1. Abstract
8
The purpose of this paper is to investigate the potential for calculation methods to determine the thermal 9
resistance of a wall system containing vacuum insulation panels (VIPs) that has been experimentally 10
characterized using a guarded hot box (GHB) apparatus. The VIPs used in the wall assembly have not been 11
characterized separately to the wall assembly, and therefore exact knowledge of the thermal performance 12
of the VIP including edge effect is not known. The calculations and simulations are completed using 13
methods found in literature as well as manufacturer published values for the VIPs to determine the 14
potential for calculation and simulation methods to predict the thermal resistance of the wall assembly 15
without the exact characterization of the VIP edge effect. 16
The results demonstrate that disregarding the effect of VIP thermal bridges results in overestimating the 17
thermal resistance of the wall assembly in all calculation and simulation methods, ranging from 18
overestimates of 21% to 58%. Accounting for the VIP thermal bridges using the manufacturer advertised 19
effective thermal conductivity of the VIPs resulted in three methods predicting the thermal resistance of 20
the wall assembly within the uncertainty of the GHB results: the isothermal planes method, modified zone 21
method and the 3D simulation. Of these methods only the 3D simulation can be considered a potential 22
valid method for energy code compliance, as the isothermal planes method requires too drastic an 23
assumption to be valid and the modified zone method requires extrapolating the zone factor beyond 24
values which have been validated. 25
The results of this work demonstrate that 3D simulations do show potential for use in lieu of guarded hot 26
box testing for predicting the thermal resistance of wall assemblies containing both VIPs and steel studs. 27
However, knowledge of the VIP effective thermal conductivity is imperative to achieve reasonable results. 28
Keywords: Thermal resistance calculation methods, thermal bridges, vacuum insulation panels, guarded
29
hot box, two and three-dimensional heat transfer simulations. 30
Funding: This work was supported by the Construction Research Centre of the National Research Council
31
of Canada; however this research did not receive any specific grant from funding agencies in the public, 32
commercial, or not-for-profit sectors. 33
2. Introduction
34
Determining the effective thermal resistance of a building envelope assembly is an important component 35
in building design. Primarily, the thermal resistance of a building envelope assembly is required to meet a 36
minimum prescriptive value for energy code compliance. Additionally, knowledge of the effective, or 37
apparent, thermal conductivity, specific heat and density of each component in the assembly is necessary 38
to perform whole building energy simulations. The effective thermal resistance is determined as a steady 39
state value, dependent on both the specific temperature difference and surface temperatures at which it 40
is measured as it represents the three modes of heat transfer in a single value (conduction, convection 41
and radiation). The primary method of determining thermal resistance of a wall assembly is through 42
guarded hot box testing, however in many instances calculation methods can be used in lieu of testing. 43
Historically several calculation methods have been developed and validated through laboratory testing, 44
typically consisting of reducing the thermal resistance of a building envelope system to a one-dimensional 45
(1D) result (Gorgolewski, 2007; Kosny, 1995; ISO 10211-07, 2007; ISO 14683-07, 2007; ISO 6946-07, 2007). 46
For building envelope components in which the system is made of homogenous layers with isotropic 47
properties this typically results in accurate calculations. However, most building envelope assemblies are 48
non-homogenous containing several materials of differing thermal properties which intersect. In 49
situations where materials of relatively high thermal transmittance dissect highly insulated materials, 50
thermal bridges occur, and heat transfer in two and three dimensions can become dominant. In these 51
situations, 1D calculation methods can result in significant overestimates of thermal performance and 52
additional calculations are necessary. 53
North American Energy codes, such as the National Energy Code of Canada for Buildings (NECCB) (National 54
Research Council Canada, 2016) and ASHRAE 90.1 (ASHRAE, 2016), reference several methods to 55
determine the thermal resistance of a wall assembly including both experimental and calculation methods 56
(ISO 10211-07, 2007; ISO 6946-07, 2007; ISO 14683-07, 2007). Although accounting for thermal bridges is 57
mentioned in the energy codes, these typically apply to large thermal bridges such as parapets, balconies, 58
or slab edges. Little information is provided to calculate the effect of thermal bridges for individual 59
components in wall assemblies other than framing components, such as steel and wood studs (National 60
Research Council Canada, 2016; ASHRAE, 2016; ASHRAE, 2016). Accounting for individual component 61
thermal bridges in wall assemblies becomes more important as the overall thermal resistance of the 62
assembly increases, which is becoming more common with recent focus on increases to the insulation 63
requirements in energy codes and requirements for up to net-zero construction. Obtaining the high 64
thermal resistances required in these instances, and maintaining achievable wall thickness, leads to use 65
of advanced insulation technologies, such as vacuum insulation panels (VIP). However, the centre of panel 66
thermal conductivity value of a single panel, derived from the partial vacuum in the core material, is not 67
representative of a VIPs actual performance in an assembly due to two main sources of thermal bridges: 68
the barrier film and joints between panels (Simmler, et al., 2005; Schwab, Stark, Wachtel, Ebert, & Fricke, 69
2005). To maintain the partial vacuum a gas barrier film is required to limit the migration of atmospheric 70
gases and water vapour to the core material and is typically made of metal or metallized components, 71
creating a thermal bridge around the perimeter of the panel itself. As such, the gas barrier film cannot be 72
perforated which necessitates a combination of panels required for wall construction, to allow for 73
cladding fasteners, duct and pipe penetrations, etc. This causes a second thermal bridge through the joints 74
between panels, as the material in the joints will have a higher thermal transmittance than the centre of 75
the panel (Brunner, Stahl, & Ghazi Wakili, 2012; Lorenzati, Fantucci, Capozzoli, & Perino, 2014; Ghazi 76
Wakili, Bundi, & B.Binder, Effective thermal conductivity of vacuum insulation panels, 2004; Van Den 77
Bossche, Moens, Janssens, & Delvoye, 2010; Simmler, et al., 2005). 78
Significant work has been completed on determining the effective thermal resistance of VIPs accounting 79
for the thermal bridges, through calculation, simulation and experiments – both in-situ and in the lab. 80
Nussbaumer et al. (Nussbaumer, Ghazi Wakili, & Tanner, 2006) investigated the performance of VIPs 81
incorporated into a concrete wall system using a guarded hot box and compared the results to numerical 82
simulations with good agreement. The effects of the barrier foil were accounted for by modelling the 83
layers of the foil, and the performance of the VIPs were measured separately using a heat flow meter. 84
They additionally investigated the effects of damaged VIPs and noted that a VIP which had lost its vacuum 85
resulted in a thermal conductivity of 0.020 W/mK. Nussbaumer et al. (Nussbaumer, Bundi, & Muehlebach, 86
2005) also investigated a wooden door system with undamaged and damaged VIPs, noting that the 87
damaged VIP reduced the overall performance of the door system by 8.5% for a single VIP, and 14% for 88
two damaged VIPs; the damaged VIP had a corresponding thermal conductivity of 0.019 W/m*K. Grynning 89
et al. (Grynning, et al., 2010) performed hot box measurements of several wall structure arrangements of 90
VIPs with various edge and overlap effects and compared the results to numerical simulations. The linear 91
thermal transmittance was calculated in two dimensions in THERM following the methods in ISO 10211. 92
They also measured 20mm and 40mm thick VIPs in both single and double layer configurations in a heat 93
flow meter. The average width of the air gap was simulated as 2mm, however the measured air gap varied 94
from 0mm to 7mm in the experiments. The effect of the air gap was not measured, rather calculated as 95
an equivalent resistance as per ISO 6946. They also noted that a punctured VIP (i.e. loss of vacuum) 96
resulted in a thermal conductivity of the panel of 20 mW/m*K. Haavi et. al (Haavi, Petter Jelle, & 97
Gustavsen, 2012) measured the thermal resistance of three different wall assemblies containing VIPS, 98
each incorporating different stud profiles and compared the results with numerical simulations. The VIPs 99
were installed between the studs and measured 40mm thick by 600mm wide by 1000mm long with a 100
0.1mm thick barrier foil and a 0.3mm thick fire retardant barrier. The thermal conductivities of the VIPs 101
were measured as 0.004 W/m*K in a pristine condition, 0.008 W/mK in an aged condition and 0.02 W/MK 102
in a punctured condition. Atsonios et al. (Atsonios, Mandilaras, & Founti, 2019) determined the thermal 103
performance of a novel drywall system insulated with VIPs. The VIPs used in this system were 1.0 m long 104
by 0.60m wide by 0.020m thick. They determined the VIP thermal transmittance and effective thermal 105
conductivity for the panels at two mean temperatures of 10°C and 23°C using a guarded hot plate 106
apparatus. The effective thermal conductivity was measured as 0.00444 and 0.00461 W/m*K at 10°C and 107
23°C respectively. Fantucci et al. (Fantucci, Lorenzati, Capozzoli, & Perino, 2019) also investigated the 108
temperature dependence of the effective thermal conductivity of 10mm thick VIPs and determined that 109
the thermal conductivity varied from 0.0049 to 0.0075 W/m*K for mean temperatures from -7.5°C to 110
55.5°C. Berardi et al. (Berardi & Naldi, 2017) investigated the temperature dependence of several 111
insulating materials with a heat flow meter at various mean temperatures, including Fiberglass, Rock-112
wool, Polyisocyanurate and XPS. For all materials except Polyisocyanurate the temperature dependant 113
thermal conductivity decreases with decreasing mean temperature due to decreases in the contribution 114
of the convection and radiation effects in the overall heat transfer rate. 115
Sprengard and Holm (Sprengard & Holm, 2014) used numerical simulation to investigate the thermal 116
losses at the edges of panels considering differences in thickness of the panels, type of edge design (single 117
or multilayer foils), inorganic barrier material and thickness of barrier layers, the material used between 118
the joints, and fasteners used to mount the panels, as well as encasement material in various construction 119
types. In general they determined that larger panels are less susceptible to edge losses versus smaller 120
panels (due to the higher area to perimeter ratio) and that new panels generally exhibited high thermal 121
transmittance values so slightly aged panels should be used for more reasonable values. This work 122
simulated the layers in the foils separately, not as a combined representative value. They determined that 123
the equivalent thermal conductivity for panels measuring 1.0 m in length by 0.5 m in width by 0.02m in 124
depth was 0.051 to 0.074 W/mK depending on the barrier film type. Ghazi Wakili et al. (Ghazi Wakili & 125
Nussbaumer, 2005) used a previously validated numerical model to determine the linear transmittance 126
of two different thicknesses of VIPs in a massive stone wall with floor slab and terrace with continuous 127
transition between inner and outer floors by modelling the multi-layer barrier film as a single 128
representative layer. Additionally, values were produced for VIPs surrounded by 10 mm of insulating 129
material of varying thermal conductivities, ranging from 0.025 to 1 W/m*K. In general the results 130
demonstrate that increasing thickness of the VIP results in a reduced linear thermal transmittance value 131
for the assemblies investigated. 132
In-situ measurements of the thermal performance of steel stud walls and walls incorporating VIPs has also 133
been investigated. Mandilaras et al. (Mandilaras, Atsonios, Zannis, & Founti, 2014) compared the in-situ 134
performance of a full scale wall clad in ETICs containing both EPS and 0.60m long by 0.40m wide by 0.20 135
m thick VIPs, with an effective thermal conductivity of 6.3 mW/m*K. Atsonios et al. (Atsonios I. , 136
Mandilaras, Manolitsis, Kontogeorgos, & Founti, 2007) analyzed the in-situ performance of a lightweight 137
steel stud wall incorporating VIPs and used the results to benchmark a whole building simulation model. 138
The resulting model predicted that the VIPs have the potential to reduce the energy demand of the 139
structure by an average of 19% considering the climates of Athens, New York, Oslo and Kuwait. 140
Kontogeorgos et al. (Kontogeorgos, Atsonios, & Mandilaras, 2016) investigated a lightweight steel frame 141
wall incorporating VIPs on the internal surface of a two-storey wall assembly and determined that the 142
VIPs decreased the total thermal transmittance of the structure by 33%. The effective VIP thermal 143
conductivity was determined as 0.007 W/mK. 144
Several numerical, analytical, and experimental investigations have been used to determine linear thermal 145
transmittances for VIPs in various configurations. Isaia et al. (Isaia, Fantucci, Capozzoli, & Perino, 2016) 146
completed a series of experiments and numerical analysis to develop an empirical model to determine 147
the thermal transmittance of a VIP accounting for the barrier film details, wall assembly insulation 148
configuration and joint material/configuration. In this work the VIP barrier foil was modelled as a single 149
layer, and the bounding layers were modelled as a single representative layer of equivalent thermal 150
conductivity. The air gaps in the joints between VIPs were modelled using an equivalent thermal 151
conductivity following the ISO 6946 simplified method. Tenperik et al. (Tenperik & Cauberg, 2007) 152
developed a method to analytically calculate the corresponding edge thermal transmittance of VIPs 153
accounting for: the heat transmission coefficient at the boundary surface, VIP thickness, laminate 154
thickness, laminate thickness at the panel edge and laminate thermal conductivity. The accuracy was 155
claimed at 5% however, no experimental comparisons were completed. Additionally, the model does not 156
account for air gaps that occur between two abutting VIPs. Van Den Bossche et al. (Van Den Bossche, 157
Moens, Janssens, & Delvoye, 2010) compared the method proposed by Tenpirek to experiment results 158
and determined that the method underestimated the thermal transmittance of the edge values by 159
approximately 8% and 23% for a 20 mm and 30 mm thick panel respectively. The experiment results also 160
determined that methods which do not account for the gap between panels are unreliable. Wakili et al. 161
(Ghazi Wakili, Bundi, & B.Binder, Effective thermal conductivity of vacuum insulation panels, 2004) 162
determined edge thermal transmittance values for 1m by 1m VIPs with two different barrier films 163
containing 90 nm and 300 nm thick metal layers through numerical simulation by combining the multiple 164
thin barrier layers (metal and polymers) into a single layer; the authors caution the use of these results 165
for VIPs of different barrier foil types. Also, the air gap between the VIP panels were not measured, rather 166
‘adjusted’ in the numerical simulations to tune the numerical results to the experiment results. Lorenzati 167
et al. (Lorenzati, Fantucci, Capozzoli, & Perino, 2014) determined the linear thermal transmittance of 20 168
mm thick VIPs with three different metallized barriers and four different joint materials (air, XPS, MDF and 169
rubber) between abutting VIPs using a heat flow meter apparatus and normalized the results for various 170
VIP sizes using the perimeter to area ratio. 171
Overall, the literature review has demonstrated that the effective thermal conductivity of a VIP is 172
dependent on many factors and can easily vary from as low as approximately 4 mW/mK up to 8 W/mK 173
when a partial vacuum is maintained in the core, and up to 20 mW/M*K when the barrier film is 174
punctured. Determining the effective thermal conductivity of a VIP in a wall assembly generically (i.e. 175
without testing the specific assembly) requires detailed knowledge the exact barrier film composition, the 176
temperature difference and global temperatures at which the VIP is tested, the joint material and spacing, 177
the thickness of the panels, type of edge design (single or multiplayer foils), and fasteners used to mount 178
the panels. Having detailed knowledge of each of these factors for a given assembly is unlikely to occur in 179
practice. 180
Thus, determining the accuracy of typical calculation and numerical simulations using generic material 181
properties (including barrier film effects) in predicting the thermal resistance and condensation risk in 182
comparison to a guarded hot box test provides context for designers, engineers, architects and code 183
officials to judge what level of calculation detail is necessary to provide confidence in the results for energy 184
compliance. Therefore the purpose of this paper is to investigate the potential for industry standard 185
calculation methods, 2D simulations and 3D simulations to be used in predicting the thermal resistance 186
of a wall assembly for which the exact thermal performance of the barrier film is not known. The 187
calculations and simulations were completed with material properties found in either industry standard 188
references, manufacturer advertised values, or literature references (in the case of the temperature 189
dependent thermal conductivities). The results and conclusions will provide guidance to designers, 190
practitioners, and code officials on the potential inaccuracies that can occur from using established 191
calculation methods and simulations with generic material properties, as compared to completing 192
guarded hot box tests on representative wall assemblies containing VIPs and steel studs. 193
3. Calculation Methods
194
The calculation methods used in this paper consist of reducing the heat transfer through a building 195
envelope to a one-dimensional analogous electrical circuit of resistors. The analogous circuit is then 196
reduced to a single combined resistance. The established calculation methods for stud frame 197
construction, from the ASHRAE Handbook of Fundamentals (ASHRAE, 2013), consist of the following: 198
1. Parallel path method 199
2. Isothermal planes method 200
3. Modified zone method 201
Methods 1 and 2 (parallel path, isothermal planes) can be as considered general methods. The parallel 202
path method assumes that heat transfer occurs in the shortest path in the direction of the temperature 203
difference without any contribution from lateral heat flow. The overall thermal resistance is then 204
determined as an area weighted average of the parallel path conductance values. The isothermal planes 205
method assumes that heat transfer is equalized laterally at each material interface before transferring to 206
the next plane, and the total thermal resistance is determine as the sum of thermal resistances of each 207
layer (ASHRAE, 2016). Both of these methods are applicable to a wide variety of wall systems in which the 208
components of the wall assembly have similar thermal transmittance properties. This assumption is not 209
valid for wall assemblies where the majority of heat transfer occurs through thermal bridges (ASHRAE, 210
2011). It has been estimated that using these methods to solve for the thermal resistance of wall 211
assemblies which contain significant heat transfer due to thermal bridges can lead to overestimating the 212
thermal resistance by 20-70% (Morris and Hershfield, 2014). 213
Method 3, the modified zone calculation method (Kosny, 1995), was developed to account for the effects 214
of steel studs on the thermal resistance of the wall assembly. It accounts for the lateral heat transfer that 215
occurs in the components around the steel stud by determining a “thermally effected zone”. This 216
calculation method does account for heat transfer effects due to the thermal bridges caused by the steel 217
studs, however is obviously only applicable to steel stud wall assemblies. 218
4. Calculation and simulation set-up
219
The thermal resistance calculations and numerical simulations are completed on a wall assembly that has 220
been previously characterized using a guarded hot box apparatus in accordance with ASTM C1363. The 221
experiment conditions, wall assembly configuration and results are presented in detail in Moore et al. 222
(Moore, Cruickshank, Beausoleil-Morrison, & Lacasse, 2020). This section presents a brief summary of the 223
experiment and wall configuration used to complete the calculations and simulations. 224
4.1 Wall assembly
225
The wall assembly consisted of a 2.44 m x 2.44 m x 0.20 m specimen including both steel studs and VIP’s. 226
The materials and dimensions used in the wall assembly are listed in Table 1 and a sketch of the layers of 227
the wall assembly is shown in Figure 1, Figure 2 and Figure 3. The wall assembly did not include a cladding. 228
Table 1: Summary of wall assembly materials and dimensions.
229
Layer Description
1 15.875 mm (5/8 in.) Gypsum board
2 6 mil (0.254 mm) polyethylene vapour barrier 3 Mineral fibre insulation (89mm, 3.50 in.)
4 18 gauge (1.09 mm) thick Steel Stud, with fiberglass clips for mounting VIP sandwich panels, spaced at 400mm on centre
5 XPS-VIP-XPS sandwich panel layer (from interior to exterior) – 12.7mm (1/2 in.) XPS, 25mm (1 in.) VIP panel, 50mm (2 in.) XPS.
Figure 1: Schematic of wall assembly layers.
231 232
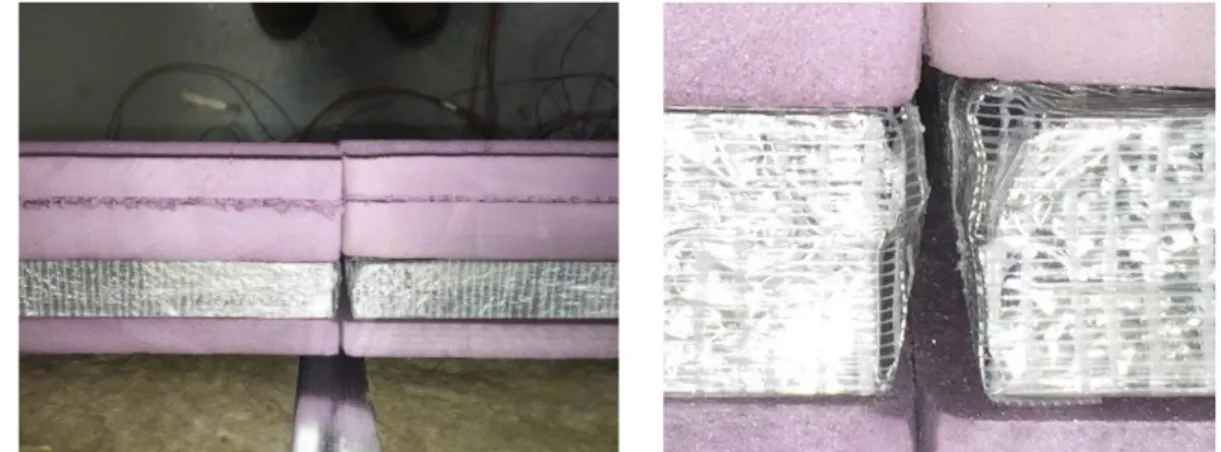
Figure 2: Example of joint width variation between VIPs in wall assembly.
233 234
Figure 1 layer 5 represents the XPS (expanded polystyrene)-VIP-XPS sandwich layer, which was made by 235
adhering XPS to the interior and exterior side of 600 mm x 1200 mm x 25 mm VIPs. The XPS layers were 236
added to the VIP to protect the surface from coming in to contact with sharp or abrasive objects, such as 237 2 3 1 4 5
the steel studs, the fiberglass clips holding the panels in place, and the fasteners from the exterior 238
strapping. 239
4.2 Geometry for industry standard calculation and two-dimensional simulations
240
The 2D numerical simulations were completed on a plan view of the wall assembly (Figure 3 b, c) and the 241
3D geometry was drawn based on average measurements in as close an approximation as possible to the 242
actual wall assembly as per the dimensions given previously and in Figure 3. The geometries were drawn 243
in COMSOL (COMSOL AB, 2017). The 2D plan view orientation was selected to account for the effect of 244
thermal bridges due to the steel studs. This orientation assumption ignores thermal bridges that occur 245
due to the fiberglass clips and horizontal air spaces. The effect of this assumption is investigated with the 246
3D modelling. The air joint between the VIPs in the centre of the wall assembly was measured at several 247
points and is modelled as an average width of 7.44mm, however the air gap width varied from 4.44mm 248
to 11.7mm. 249
(a)
(b)
(c)
Figure 3: Representative top and side view cross sections depicting the dimensions of the horizontal gaps
250
surrounding the fiberglass clips, all dimensions are in millimetres. (a) Depicts the horizontal air gaps
surrounding the clip at each layer; (b) Depicts a zoom in around the stud and centre VIP gap; (c) shows a top
252
view with each stud location and material labelled
253 254
Using the geometry depicted in Figure 3c the assembly was divided up into separate heat transfer paths 255
and isothermal planes for the parallel path method and isothermal planes method respectively, as shown 256
in Figure 4. The modified zone geometry was in the same manner as the isothermal planes method, 257
however the stud cavity was calculated based on the procedure outlined in the ASHRAE Handbook of 258
Fundamentals. 259
(a)
(b)
Figure 4: Geometry from Figure 3c divided into respective heat transfer paths for the parallel path method (a),
260
and isothermal planes for the isothermal planes method (b).
261 262
4.3 Material properties
263
The thermal conductivities for all materials are presented in Table 2 and were derived from a 264
combination of industry material properties (ASHRAE, 2013), manufacturer literature and the literature 265
review. The temperature dependent thermal conductivities were used for XPS and mineral fibre, taken 266
from Berardi & Naldi (Berardi & Naldi, 2017). The VIP thermal conductivities were only available from the 267
manufacturer. These consisted of the centre of panel value, which includes no contributions due to the 268
heat transfer through the barrier foil at the edges of the panel, and the design value which includes 269
adjustments due to heat transfer through the barrier foil at the edges and service life aging. These values 270
are reported to be measured at a mean temperature of 10°C; temperature dependency is not provided. 271
As reported by Fantucci et al. (Fantucci, Lorenzati, Capozzoli, & Perino, 2019) the effective thermal 272
conductivity of VIPs decreases as temperature decreases, so the values used could be considered 273
conservative compared to if the temperature dependent thermal conductivity values were used, as the 274
VIPs are installed in the wall assembly close to the exterior. Temperature dependent thermal 275
conductivities were not available for the gypsum or steel stud; the thermal conductivities for these two 276
materials were obtained from the ASHRAE Handbook of Fundamentals. 277
Table 2: Effective thermal conductivities
278
Material Reference Effective thermal conductivity [W/mK]
XPS Berardi & Naldi (Berardi & Naldi,
2017) k = 0.00014*T[°C] + 0.02602
Steel stud (18
gauge) ASHRAE Handbook of Fundamentals 48.0 Mineral fibre Berardi & Naldi (Berardi & Naldi,
2017) k = 0.00014*T[°C] + 0.03150
Gypsum ASHRAE Handbook of Fundamentals 0.16
VIP
Manufacturer centre of panel value,
“CoP” 0.0042
Manufacturer design effective VIP
thermal conductivity, “VIP_eff” 0.0061
279
4.3.1 Air joint material properties
280
The air joint material properties were determined using the method outlined in ISO 6946 Annex B.4 as per 281
Isaia et al. (Isaia, Fantucci, Capozzoli, & Perino, 2016) and (Grynning, et al., 2010). The dimensions used to 282
calculate the effective thermal resistance of the air space were taken based on the largest air joint 283
corresponding to the vertical joint between the VIPs at each layer. The dimensions consisted of an average 284
air joint width of 7.44 mm, a depth of 25 mm, and a height of 600mm. The average temperature of and 285
temperature difference across the airspace were determined by extracting data from the 3D simulation 286
with the air space modelled as purely conductive heat transfer. The thermal conductivity of the air in the 287
3D simulation used the temperature dependent thermal conductivity native to the COMSOL material 288
property database. This resulted in an average air temperature of -6.6°C and a temperature difference 289
across the air space of 18.38°C. Using these values and the procedure in ISO 6946 Annex B.4 resulted in 290
an equivalent thermal conductivity of the airspace of 0.096 W/mK. This was implemented into the final 291
3D model by multiplying the COMSOL temperature dependent thermal conductivity curve by a scaling 292
factor of 4.05. The scaling factor was determined by dividing the effective thermal conductivity 293
determined using the ISO 6946 Annex B.4 procedure by the corresponding air thermal conductivity value 294
in COMSOL at a temperature of -6.6°C. One aspect not accounted for in this analysis is the potential for 295
air to circulate around the corner of the VIP, given that the air joints on the top and bottom of the VIP is 296
connected to the vertical air joint. It is assumed that the potential for the air to wrap around the corner 297
of the VIP does not have a significant effect on the overall thermal resistance of the wall assembly. 298
4.3.2 Barrier film description
299
The manufacturer describes the barrier film in the VIPs used in the experiments as a tri-layer aluminized 300
film with a total thickness of 97 microns (0.097mm) consisting of three layers of aluminized olyester and 301
a single layer of linear low density polyethylene for heat sealing. The core material is made up of opacified 302
silica consisting of pyrogenic silica and a silicon carbide based opacifier with reinforcing fibers made of 303
glass, polyester or cellulose. There are no getters in the core material. No information is provided on the 304
orientation or individual thickness of the layers in the barrier film. The design thermal conductivity is 305
reported as 0.0061 W/m*K and is stated to account for both the thermal bridges at the edges of the panel 306
due to the barrier foil and an adjustment for service life. Comparing this value to the range of values in 307
the literature review (0.003 to 0.008 W/mK) shows that this value seems in the appropriate range for 308
thermal bridging effects. 309
4.4 Numerical simulation governing equations
310
The numerical simulations were completed assuming all heat transfer through the solid components was 311
due to conduction. The simulations solved the general governing equation for heat conduction (COMSOL 312
AB, 2017), given for one dimension in Equation 1. 313 𝑞" = −𝜆 ∗𝑑𝑇 𝑑𝑥 Equation 1 𝑞" – heat flux [W/m2] 314 𝜆 – thermal conductivity [W/mK] 315
𝑑𝑇 – temperature difference between nodes [K] 316
𝑑𝑥 – length between nodes [m] 317
318
4.4.1 Boundary conditions
319
The boundary conditions (BCs) in the numerical models were implemented as per the BC’s from in the 320
GHB testing described in Moore et al. (Moore, Cruickshank, Beausoleil-Morrison, & Lacasse, 2020). 321
During the GHB test the surfaces of the wall assembly was exposed to three different boundary conditions. 322
The interior surface is exposed to the metering box air, the exterior surface is exposed to weather side 323
air, and the lateral surfaces are exposed to the insulated mask. 324
The interior and exterior surface boundary conditions were assumed to be the average surface heat flux 325
coefficients (determined using characterization specimens as per ASTM C1363) and the ambient air 326
temperatures for each side of the GHB. The boundary conditions for the interior and exterior surfaces are 327
presented in Table 3. The modelling imposes the surface heat flux coefficient and the ambient 328
temperature and solves for the corresponding surface temperature and heat flux using conservation of 329
energy at the surface, as shown in Equation 2. 330
𝜆 (𝑇y−1− 𝑇y
𝑑y ) = ℎs(𝑇y− 𝑇∞)
Equation 2
𝜆 – is the apparent thermal conductivity of the material [W/mK] 331
𝑇y−1 – is the temperature at the previous element to the surface [°C]
332
𝑇y – is the temperature at the surface element [°C]
333
𝑑𝑦 – is the distance between the elements [m] 334
ℎs – is the average surface heat flux coefficient from the GHB characterization tests [W/m2k]
335
𝑇∞ - is the ambient temperature of the air during the VIP wall GHB tests [°C]
336
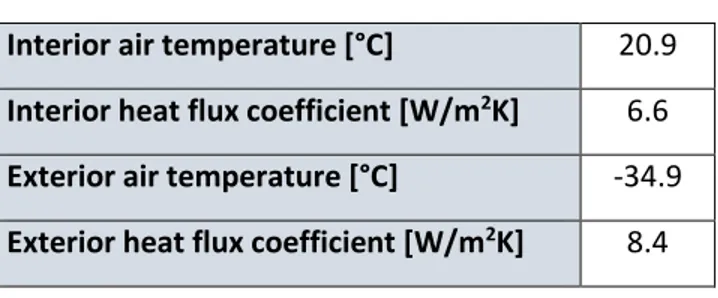
Table 3: Interior and exterior boundary conditions.
337 338
Interior air temperature [°C] 20.9
Interior heat flux coefficient [W/m2K] 6.6
Exterior air temperature [°C] -34.9
Exterior heat flux coefficient [W/m2K] 8.4 339
The lateral surfaces of the specimen in the GHB are in contact with an insulated mask, assumed to be a 340
perfect thermal insulation condition, with zero heat flux normal to the lateral edges. This is represented 341
in the model as shown Equation 3. 342
343
𝜆 (𝑇x−1− 𝑇x
𝑑𝑥 ) = 0
Equation 3
𝜆 – is the apparent thermal conductivity of the material [W/mK] 344
𝑇x−1 – is the temperature at the previous element to the surface [°C]
345
𝑇x – is the temperature at the surface element [°C]
346
𝑑𝑥 – is the distance between the nodes [m] 347
5. Calculation and simulation results and uncertainty
348
This section presents the comparison between the calculated and simulated thermal resistance of the wall 349
assembly to the GHB experiment result. Additionally, this section presents the estimated uncertainty of 350
the experiment, calculation and simulation results. 351
5.1 Uncertainty
352
The uncertainty of the GHB test results was determined for the temperature measurements and the 353
thermal resistance calculation. The combined thermocouple uncertainty was determined as ±0.45°C, and 354
the combined uncertainty in the thermal resistance of the GHB test was ±11.7%. Further detail on the 355
thermal resistance uncertainty can be found in Moore et. al (Moore, Cruickshank, Beausoleil-Morrison, & 356
Lacasse, 2020). 357
The overall uncertainty for the industry standard calculation methods was determined as +/-5.5%. This 358
estimate is made based on the estimated combined uncertainty of ±2% for the material properties which 359
were measured by a heat flow meter (Lackey, Normandin, Marchand, & Kumaraman, 1994; Berardi & 360
Naldi, 2017), plus an assumed +/-3% for the potential VIP panel thermal conductivity uncertainty and an 361
uncertainty caused by the variance in air joint width of +/-0.5% (this was determined in the 3D 362
simulations). There could be considerable higher uncertainty due to the VIP thermal conductivity given 363
other measurements in literature and given that this component provides a significant portion of the 364
thermal resistance to the wall assembly. 365
Similarly the uncertainty in the 2D simulation results is estimated at +/-5.5% considering uncertainty due 366
to the material properties, discretization of the geometry, convergence and rounding of the numerical 367
solution. The uncertainty due to the discretization, convergence and rounding error of the numerical 368
solution is estimated from the difference between the heat flux in to and heat flux out of the geometry. 369
It is assumed that discretization error is negligible in this case, as the difference in heat fluxes are less than 370
0.1%. The convergence of the simulations is 0.001% and is also assumed to not significantly increase the 371
uncertainty of the simulation results. 372
The 3D simulation uncertainty is estimated as +/-6.5% and considers uncertainty due to the material 373
properties, discretization, convergence and rounding of the numerical solution. The increased uncertainty 374
in the 3D results compared with the 2D results is from the mesh convergence of the 3D numerical 375
simulations resulting in a slight difference between the heat flux in to and out of the assembly due to the 376
mesh being limited in the number of elements, of approximately ±1.0%. 377
5.2 Results and discussion
378
The thermal resistance calculation and simulation methods are compared to the guarded hot box test 379
results for two cases. The first case is using the centre of panel thermal conductivity from the 380
manufacturer, so these values do not include any contributions due to the thermal bridges at the edges 381
of the panel. The second case is using the manufacture advertised design value, which is stated to include 382
contributions due to both the thermal bridges due to the barrier film edges and a service life aging factor. 383
Additionally, the surface temperature around the steel stud is compared between the three- dimensional 384
simulation results and the GHB measurements. These values help indicate the potential for determining 385
condensation risk due to the studs on the interior surface using calculation methods. All experiment 386
results are described in further detail in Moore et al. (Moore, Cruickshank, Beausoleil-Morrison, & Lacasse, 387
2020). 388
5.2.1 Thermal Resistance Comparison
389
The results of each thermal resistance calculation method (parallel path, isothermal planes and modified 390
zone method) and the two- and three-dimensional numerical simulations are provided in Figure 5. As 391
discussed the results for each method are presented for two cases of VIP thermal conductivity: with (VIP 392
0.0061) and without (VIP 0.0042) accounting for barrier foil thermal bridges. As could be expected, all 393
calculations and simulations that did not account for thermal bridges due to the barrier film resulted in 394
significant overestimates of the thermal resistance. For instance, in a worst case scenario, completing a 395
1D calculation neglecting all thermal bridge effects (steel studs, fibreglass clips, air joints and VIP barrier 396
film) results in a thermal resistance of 11.3 m2K/W, indicating that the effects due to thermal bridges in 397
this wall assembly reduce the potential thermal resistance by 40% as compared to the GHB test result. 398
Comparing the calculation results with the results from the guarded hot box show that no results are 399
within the upper limit of the uncertainty of the GHB results. The closest value to the experiment results is 400
from the isothermal planes, with an overestimate of 21%, followed by the 3D results which overestimates 401
by 24%. The parallel path method results in the highest overestimate, not surprising considering it does 402
not account for any lateral heat transfer effects, with an overestimate of 58%. The modified zone method 403
results in an overestimate of 40% and the 2D simulation results in an overestimate of 53%. 404
Considering the results that account for the thermal bridges at the edges of the VIP shows a much better 405
comparison to the experiment results. In all, three of the methods give results within the uncertainty of 406
the experiment result: the isothermal planes method, the modified zone method and the 3D simulations. 407
The parallel path method overestimates the experiment result by approximately 31% and the 2D 408
simulation overestimates the experiment result by approximately 28%. 409
Considering these results, it would seem that the most accurate method to determine the thermal 410
resistance would be the isothermal planes method, as this results in the least overestimate when thermal 411
bridges are not considered, and is within the uncertainty of the experiment results when thermal bridges 412
are considered. This is an unexpected result, as although this method does account for the potential of 413
lateral heat transfer, the 2D geometry that the calculation is completed over does not account for the 414
thermal bridging due to the horizontal fiberglass clips, bottom track stud or top track stud so one would 415
have expected it to still overestimate the thermal resistance of the wall assembly. However, analyzing the 416
thermal resistance breakdown given in Figure 4 demonstrates that these results are not valid, as the 417
reason for the low thermal resistance estimate is due to a significant underestimate of the contribution 418
to the thermal resistance from the mineral fibre insulation. This is due to the base assumption of the 419
method that all heat transfer occurs laterally within a given plane in the wall assembly, which in this case 420
is too extreme. The other calculation result that shows promise from the results considering thermal 421
bridges is the modified zone method. However, determining the thermal resistance of the wall assembly 422
using the modified zone method required extrapolating the zone factor beyond that which was validated 423
in its development. Therefore, further validation on other steel stud wall assemblies with VIPs is required 424
before this method can be recommended as a valid calculation method for steel stud wall assemblies with 425
VIP insulation on the exterior. 426
Comparing the results of the simulations demonstrates that the 2D simulation overestimates the thermal 427
resistance in both cases. The most likely reason for this is due to the 2D geometry neglecting the heat 428
transfer due to thermal bridges due to the horizontal components (fiberglass clips, top track stud, and 429
bottom track stud), as well as the horizontal air joints. 430
The 3D simulations do account for the horizontal thermal bridges mentioned, and correspondingly when 431
the thermal bridges due to the barrier foil are accounted for predicts a thermal resistance within the 432
uncertainty of the experiment result. However, performing the 3D simulations does require significant 433
detail of the wall assembly being tested, including the width of all joints surrounding the VIP panel. Given 434
that the 3D result predicts a thermal resistance that is at the higher end of the uncertainty band of the 435
experiment results, one could conclude that the true effective thermal conductivity of the VIP including 436
thermal bridges is slightly higher than that used in the simulations. This provides evidence, as discussed 437
in the literature review, the fact that accurate calculations and simulations of wall assemblies that 438
incorporate VIPs need measured data of the actual VIP used in the wall assembly to provide the most 439
confidence in the calculated/simulated results. Additionally, comparing the 3D simulation results between 440
the centre of panel (VIP 0.0042) and effective (VIP 0.0061) thermal conductivities indicates that a 441
reduction in the thermal bridge effect due to the barrier films could improve the overall wall performance 442
by approximately 12%. Comparing the calculated effective thermal conductivity of the airspace between 443
the VIPs and to the centre of panel thermal conductivity (0.096 to 0.0042 W/m*K) also indicates that 444
reducing the air gap between the VIPs would result in improved thermal resistance of the wall assembly. 445
These improvements to the wall design could be achieved by more tightly butting the VIPs and by using 446
two staggered (offset joints) layers of thinner VIPs instead of the single layer VIP used in this wall assembly, 447
as was explored by Brunner et al. (Brunner, Stahl, & Ghazi Wakili, 2012). 448
Figure 5: Thermal resistance results comparing industry standard calculations and two and three-dimensional
449
simulations to guarded hot box test results.
450 451
5.2.2 Steel stud effect on interior surface temperature
452
The interior surface temperature in proximity to the steel stud was also compared between the 3D 453
simulation which considered thermal bridges due to the VIP and the experiment. The temperature in 454
proximity to the stud is an important indicator of the potential for condensation to occur due to the steel 455
studs. The comparison is shown in Figure 6, and demonstrates that the 3D simulation can accurately 456
predict the surface temperature in proximity to the steel stud within the uncertainty of the experiment. 457
This indicates that 3D simulations can be used to determine the potential for condensation with good 458
agreement to the experiment. 459 0.0 1.0 2.0 3.0 4.0 5.0 6.0 7.0 8.0 9.0 10.0 11.0 12.0
Paralell Path Isothermal Planes Modified Zone 2D 3D Th erm al re sis ta n ce (m 2K/W)
Thermal resistance comparison
VIP 0.0042 VIP 0.0061 GHB test GHB Test +Unc. GHB Test -Unc.
Figure 6: Comparison of the surface temperature in proximity to the steel stud between the 3D simulation and 460 the experiment. 461 462
6. Conclusions
463This paper presented the results of typical standard calculation methods and two- and three-dimensional 464
simulations in determining the thermal resistance of a wall assembly that incorporates both VIPs and steel 465
studs and was characterized in a guarded hot box. In addition to the thermal bridges due to the barrier 466
film in the VIP and the steel studs the wall assembly also included thermal bridges due to horizontal 467
fiberglass clips used to hold the insulation on the exterior of the wall assembly and air joints surrounding 468
the VIPs. 469
The calculations and simulations were completed for two VIP thermal conductivity scenarios, both from 470
the manufacturer data. The first scenario used the centre of panel thermal conductivity, meaning it did 471
not account for any thermal bridging around the panels. The second scenario used the manufacturer 472 17 17.5 18 18.5 19 19.5 20 20.5 21 21.5 22 -225 -200 -175 -150 -125 -100 -75 -50 -25 0 25 50 75 100 125 150 175 200 225 Te m p era tu re ( °C)
Comparison to Stud Location, mm (centre of stud flange at 0mm)
Surface Temperature comparison around stud
GHB Experiment 3D Simulation 3D simulation +Unc. 3D Simulation
Unc.-advertised design value, which included contributions due to the thermal bridging of the barrier foil at the 473
panel edges. The exact barrier film composition for the VIPs used in the wall assembly were not known, 474
and the VIP was unable to be characterized separately due to limitations in test equipment. This scenario 475
would be representative of a designer, engineer or code official who is seeking to evaluate the potential 476
use of VIPs in a wall system for energy code compliance. 477
As might be expected, the results for the calculations and simulations for the scenario in which the thermal 478
bridges due to the barrier films in the VIPs were not accounted for resulted in significant overestimations 479
of the wall thermal resistance, ranging from a 21% overestimation to a maximum overestimation of 58%. 480
For the scenario considering the barrier film thermal bridges three methods predicted the thermal 481
resistance of the wall assembly within the uncertainty of the experiment: specifically, the isothermal 482
planes method, the modified zone method and the 3D simulation. However, the isothermal planes 483
method result was deemed not applicable, as due to the drastic assumption of complete lateral heat 484
transfer at each layer it grossly underestimated the contribution of the mineral fibre insulation to the 485
overall thermal resistance of the wall assembly. Due to the high level of exterior insulation in the wall 486
assembly from the VIPs, the modified zone method required extrapolation of the zone factor – beyond 487
that which had been validated during its development. Therefore more validation with other wall 488
assemblies is needed before this calculation method can be considered valid for use in energy compliance 489
calculations of steel stud wall assemblies with VIP exterior insulation. 490
The 3D simulations also predicted the thermal resistance of the wall assembly within the uncertainty of 491
the experiment, and from the results in this paper can be considered a viable method of determining 492
thermal resistance of a wall assembly containing steel studs and VIPs in lieu of testing for energy code 493
compliance. However, specific details of the wall assembly are required, especially regarding the VIP 494
effective thermal conductivity and the joints between VIP panels. Additionally, the interior surface 495
temperature in proximity to the steel stud was compared between the 3D simulations and the 496
experiment. The results of this comparison also indicate that 3D simulations can predict the surface 497
temperature of these type of wall assemblies within the uncertainty of a GHB experiment and can be 498
considered valid for assessing the potential for the steel stud to cause condensation on the interior 499
surface. 500
7.
Acknowledgments/Declarations
501
This work was completed with the support of the National Research Council of Canada, however this 502
institution did not have influence in study design; in the collection, analysis and interpretation of data; in 503
the writing of the report; nor in the decision to submit the article for publication. 504
505 506
8. References
507
ASHRAE. (2011). RP-1365 Thermal Performance of Building Envelope Details for Mid- And High-Rise 508
Buildings. ASHRAE.
509
ASHRAE. (2013). 2013 ASHRAE Handbook Fundamentals. Atlanta, GA, U.S.: ASHRAE. 510
ASHRAE. (2016). ANSI/ASHRAE/IES Standard 90.1-2019 -- Energy Standard for Buildings Except Low-Rise 511
Residential Buildings. Atlanta, GA: ASHRAE.
512
ASHRAE. (2016). ASHRAE Handbook of Fundamentals. Atlanta, GA: ASHRAE. 513
Atsonios, I., Mandilaras, I., & Founti, M. (2019). Thermal Assessment of a Novel Drywall systm Insulated 514
with VIPs. Energies , 12, 18. 515
Atsonios, I., Mandilaras, I., Manolitsis, A., Kontogeorgos, D., & Founti, M. (2007). Experimental and 516
Numerical investigation of the Energy Efficiency of a Lightweight Steel Framed building 517
incorporating Vacuum Insulation Panels. 6th International Energy in Buildings Conference. 518
Berardi, U., & Naldi, M. (2017). The impact of temperature dependant thermal conductivity of insulating 519
materials on the effective building envelope performance. Energy and Buildings, 144, 262-275. 520
Brunner, S., Stahl, T., & Wakili, K. G. (2012). Single and double layered vacuum insualtion panels of the 521
same thickness comparison. Building Enclosure Science Technology Conference (BEST3). Atlanta. 522
COMSOL AB. (2017). COMSOL Multiphysics(R) v. 5.2. Stockholm, Sweden: COMSOL AB. 523
Fantucci, S., Lorenzati, A., Capozzoli, A., & Perino, M. (2019). Analysis of temperature dependance of the 524
thermal conductivity in Vacuum Insulation Panels. Energy & Buildings, 183, 64-74. 525
Ghazi Wakili, K., & Nussbaumer, T. B. (2005). Thermal Performance of VIP assemblies in Building 526
Constructions. 7th Itnernational Vacuum Insulation Symposium, 131-138. 527
Gorgolewski, M. (2007). Developing a simplified method of calculating U values in light steel framing. 528
Building and Environment, 42, 230-236.
529
Grynning, S., Petter Jelle, B., Uvslokk, S., Gustavsen, A., Baetens, R., & Meloysund, V. (2010). Hot Box 530
investigations and theoretical assessments of miscellanious vacuum insulation panel 531
configurations in building envelopes. Journal of Building Physics, 34(4), 297-324. 532
Haavi, T., Petter Jelle, B., & Gustavsen, A. (2012). Vacuum insulation panels in wood frame wall 533
constructions with different stud profiles. Journal of Building Physcis, 36(2), 121-226. 534
Isaia, F., Fantucci, S., Capozzoli, A., & Perino, M. (2016). Thermal bridges in vacuum insulation panels at 535
building scale. Engineering Sustainability, 170(ES1), 47-60. 536
ISO 10211-07. (2007). Thermal bridges in building constructions - Heat flows and surface temepratures - 537
Detailed Calculations. Geneva, CH: ISO.
538
ISO 14683-07. (2007). Thermal bridges in building construction - Linear thermal transmittance - Simplified 539
methods and default values. Geneva, CH: ISO.
ISO 6946-07. (2007). Building components and building elements -- Thermal resistance and thermal 541
transmittance -- Calculation method. Geneva, CH: Internation Organization for Standardization.
542
Kontogeorgos, D., Atsonios, I., & Mandilaras, I. F. (2016). Numerical investigation of the effect of vacuum 543
insulation panels ont eh thermal bridges of a lightweight drywall envelope. Journal of Facade 544
Design and Engineering 4, 3-18.
545
Kosny, J. (1995, July). Comparison of Thermal Performance of Wood Stud and Metal Frame Wall Systems. 546
Thermal Insulation and Budiling Environments, 19.
547
Lackey, J., Normandin, N., Marchand, R., & Kumaraman, M. (1994). Calibration of a Heat Flow Meter 548
Apparatus. Journal of Thermal Insulation and Buidling Envelopes, 128-144. 549
Lorenzati, A., Fantucci, S., Capozzoli, A., & Perino, M. (2014). The effect of different materials joint in 550
vacuum insulation panels. 6th International Conference on Sustainability in energy and Buidlings, 551
(pp. 374-381). 552
Mandilaras, I., Atsonios, I., Zannis, G., & Founti, M. (2014). Thermal performance of a building envelope 553
incorporating ETICS with vacuum insulation panels and EPS. Energy and Buildings 85, 654-665. 554
Moore, T., Cruickshank, C., Beausoleil-Morrison, I., & Lacasse, M. (2020). Thermal evaluation of a highly 555
insulated steel stud wall with vacuum insulation panels using a guarded hot box apparatus. 556
Journal of Building Physics - Accepted, under revision, 21.
557
Morris and Hershfield. (2014). Building Envelope Thermal Bridging Guide. 558
National Research Council Canada. (2016). National Energy Code for Buildings Canada. Ottawa, ON: 559
National Research Council Canada. 560
Nussbaumer, T., Bundi, R. T., & Muehlebach, H. (2005). Thermal analysis of a wooden door system with 561
integrated vacuum insulation panel. Energy and Buildings 37, 1107-1113. 562
Nussbaumer, T., Ghazi Wakili, K., & Tanner, C. (2006). Experimental and numerical investigation of thermal 563
perfromance of a protected vacuum-insulation system applied to a concrete wall. Applied Energy 564
83, 841-845.
565
Schwab, H., Stark, C., Wachtel, J., Ebert, H.-P., & Fricke, J. (2005). Thermal Bridges in Vacuum-insulated 566
Building Facades. Journal of Thermal Env. and Bldg. Sci., 345-355. 567
Simmler, H., Brunner, S., Heinemann, U., Schwab, H., Kumaran, K., Mukhopadyaya, P., . . . Stramm, C. T. 568
(2005). Vacuum Insulation Panels - Study on VIP Components and PAnels for service Life Prediction 569
in Building Applications (Subtask A). International energy agency. Switzerland: EMPA.
570
Simmler, H., Brunner, S., Heinemann, U., Schwab, H., Kumaran, M. K., Mukhopadhyaya, P., . . . Kucukpinar-571
Niarchos, E. (2005). International Energy Agency Annex 39: High Performance Thermal Insulation 572
Materials, Subtask A: Vacuum insulation panels - study on VIP-components and panels for service
573
life prediction of VIP in building applications. Paris, France: IEA/ECBCS.
574
Sprengard, C., & Holm, A. (2014). Numerical examination of thermal bridging effects at the edges of 575
vacuum insulation panels (VIP) in various constructions. Energy and Buildings 85, 638-643. 576
Tenperik, M., & Cauberg, H. (2007). Effects Caused by Thin High Barrier Envelopes around Vacuum 577
Insulation Panels. Journal of Building Physics. 578
Van Den Bossche, N., Moens, J., Janssens, A., & Delvoye, E. (2010). Thermal Performance of VIP panels: 579
Assessment of the edge effect by experimental and numerical analysis. Ghent: Ghent University,
580
Department of Architecture and Urban Planning. 581
Wakili, K. G., Bundi, R., & B.Binder. (2004). Effective thermal conductivity of vacuum insulation panels. 582
Building Research and Information, 293-299. doi:10.1080/0961321042000188644
583 584