Publisher’s version / Version de l'éditeur:
Vous avez des questions? Nous pouvons vous aider. Pour communiquer directement avec un auteur, consultez la première page de la revue dans laquelle son article a été publié afin de trouver ses coordonnées. Si vous n’arrivez pas à les repérer, communiquez avec nous à [email protected].
Questions? Contact the NRC Publications Archive team at
[email protected]. If you wish to email the authors directly, please see the first page of the publication for their contact information.
https://publications-cnrc.canada.ca/fra/droits
L’accès à ce site Web et l’utilisation de son contenu sont assujettis aux conditions présentées dans le site LISEZ CES CONDITIONS ATTENTIVEMENT AVANT D’UTILISER CE SITE WEB.
CIB World Building Congress 2004 [Proceedings], pp. 1-10, 2004-05-01
READ THESE TERMS AND CONDITIONS CAREFULLY BEFORE USING THIS WEBSITE. https://nrc-publications.canada.ca/eng/copyright
NRC Publications Archive Record / Notice des Archives des publications du CNRC :
https://nrc-publications.canada.ca/eng/view/object/?id=b3338439-1ef6-48d8-b922-2f950bdf935d https://publications-cnrc.canada.ca/fra/voir/objet/?id=b3338439-1ef6-48d8-b922-2f950bdf935d
Archives des publications du CNRC
This publication could be one of several versions: author’s original, accepted manuscript or the publisher’s version. / La version de cette publication peut être l’une des suivantes : la version prépublication de l’auteur, la version acceptée du manuscrit ou la version de l’éditeur.
Access and use of this website and the material on it are subject to the Terms and Conditions set forth at
Service life tests for roofing membranes
Cash, C. G.; Bailey, D. M.; Davies, A. G.; Delgado, A. H.; Niles, D. L.; Paroli,
R. M.
Service life tests for roofing membranes
Cash, C.G.; Bailey, D.M.; Davies, A.G.;
Delgado, A.H.; Niles, D.L.; Paroli, R.M.
NRCC-47699
A version of this document is published in / Une version de ce document se trouve dans: CIB World Building Congress 2004, Toronto, ON., May 2-7, 2004, pp. 1-10
Service Life Tests for Roofing Membranes
Carl G. Cash, P.E1.; David M. Bailey2; Arthur G. Davies,Jr.3; Ana H. Delgado4; David L. Niles5; Ralph M. Paroli, PhD6
Abstract: Twelve roofing membranes were exposed to oven heat, ultra-violet and condensing humidity cabinet, and two-year outdoor exposure at United States Department of Defense (DOD) sites at Phoenix, Arizona (hot dry climate); Key West, Florida (hot and moist climate); and Champaign, Illinois (moderate mid-continent climate). Selected mechanical properties were measured before and after exposure. Each membrane was rated before and after exposure and the membranes ranked as to relative performance.
INTRODUCTION
This research continues the work previously reported (Cash et al 1993, 2001 and Bailey et al 2002, 2003). We measured selected mechanical properties and the glass transition temperature of 12 roofing membranes before and after two-year outdoor exposure at Phoenix, Arizona, Key West Florida, and Champaign, Illinois. We report the unexposed and the exposed data. We used a rating system to enable us to include all the diverse physical values measured (such as tensile load at first peak, water absorption, glass transition temperature, and impact resistance) into a single value for each pre-exposure membrane and each post-exposure membrane modified by the change exhibited after exposure. We then ranked the membranes from the “best” to the “worst” in each exposure used.
Membranes Tested
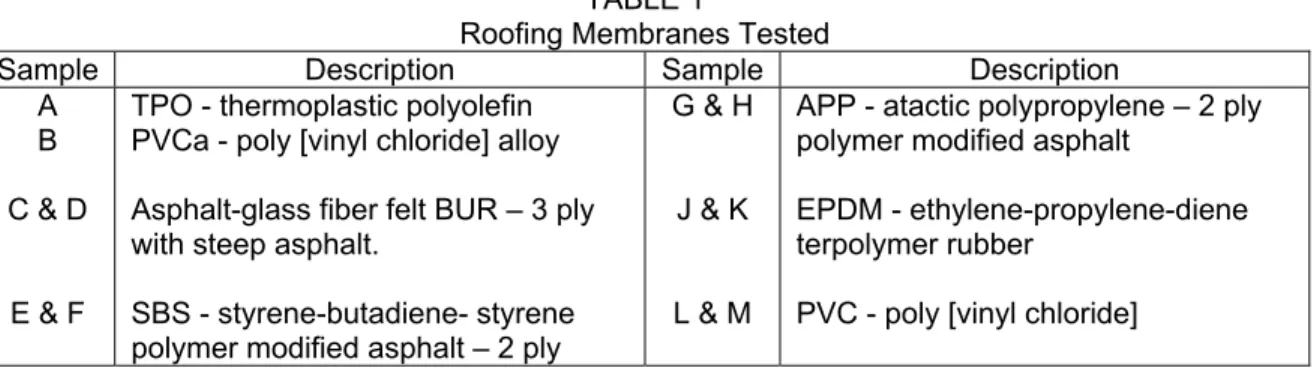
Table 1 lists the 12 popular membranes that are at the core of this on-going study. With the exception of some polymer-modified membranes that were prepared by the manufacturer, the multi-ply bituminous membranes were prepared in the laboratory under carefully controlled conditions.
TABLE 1
Roofing Membranes Tested
Sample Description Sample Description
A B
C & D
E & F
TPO - thermoplastic polyolefin PVCa - poly [vinyl chloride] alloy
Asphalt-glass fiber felt BUR – 3 ply with steep asphalt.
SBS - styrene-butadiene- styrene polymer modified asphalt – 2 ply
G & H
J & K
L & M
APP - atactic polypropylene – 2 ply polymer modified asphalt
EPDM - ethylene-propylene-diene terpolymer rubber
PVC - poly [vinyl chloride]
1
C.G. Cash, Principal and Vice President of Simpson Gumpertz & Heger Inc. consulting engineers, Waltham, MA; Washington, D.C.; San Francisco, CA; and Los Angeles, CA, USA.
2
D. M. Bailey, Civil Engineer, US Army Corps of Engineers, Construction Engineering Research Laboratory, Champaign, IL, USA.
3
A. G. Davies Jr., Senior Staff Engineer-Materials Laboratory Manager, Simpson Gumpertz & Heger Inc. consulting engineers, Waltham, MA; Washington, DC; San Francisco, CA; and Los Angeles, CA, USA.
4
A. H. Delgado, Research Council Officer, Building Envelope and Structure, Institute for Research in Construction, National Research Council, Ottawa, Ontario, Canada
5
D. A. Niles, Senior Laboratory Technician, Simpson Gumpertz & Heger Inc. consulting engineers, Waltham, MA, Washington, DC, San Francisco, CA, and Los Angeles, CA, USA.
6
R. M. Paroli, Director, Building Envelope and Structure, Institute for Research and Construction, National Research Council, Ottawa, Ontario, Canada.
Test Methods
For a given test, the same personnel tested all the samples using the same equipment under identical conditions in an effort to avoid some of the errors inherent in testing. Table 2 lists the test methods used to measure the parameters we selected.
TABLE 2
Test Methods used to Measure Selected Parameters Parameter ASTM Method Test Conditions Load-Strain properties
Load at first peak Elongation
Energy to first peak Water absorption
Glass transition temperature Dynamic puncture resistance
D2523
D570 DMA (D6382)
D5635
25 mm (1 in.) wide strips, 100 mm (4 in.) jaw gap, 0.85 mm/s (2 in./min) extension, 23ºC (73ºF).
1 week in water at 60ºC (140ºF). Change in fee volume
-18ºC (0ºF) Legend: DMA= Dynamic mechanical analysis.
Accelerated Exposures
As previously reported (Bailey et al 2003), we tested pre-exposure samples before and after heat conditioning in a forced draft oven at 70ºC (158ºF) for 28 days, and before and after 1500 hours of cycles of 20 hours of ultra-violet light at 60ºC (140ºF) and 2 hours of condensing humidity.
Rating Method
We used an arbitrary rating system to estimate the physical condition of each sample. We rated the “best” sample in each test as “100” and the “worst” as “0”. As examples: the sample with the greatest tensile strength was rated “100”; the weakest sample was rated “0”; and all the other samples rated linearly in between these extremes. The sample with the highest water absorption was rated “0”; the sample that absorbed the least water was rated “100”. We averaged the ratings for each parameter to get a single rating for each sample without using any weighting factors. Table 3 shows the ratings the unexposed samples. These ratings are different from those reported earlier (Bailey et al 2003) because three of the tests, cyclic fatigue, static puncture resistance and thermal expansion coefficient were not performed on the samples after outdoor exposure. These three tests showed little change in our previous work.
TABLE 3
Ratings for Unexposed Membranes
Sample Rating Sample Rating Sample Rating A TPO B PVCa C BUR D BUR 19 35 24 35 E SBS F SBS G APP H APP 41 76 52 57 J EPDM K EPDM L PVC M PVC 66 64 44 52
We rated the change due to exposure. We rated a parameter “100” when a change was not statistically significant and “0” for the parameter that showed the greatest change. We averaged these change ratings with the pre-exposure ratings to obtain the post-exposure rating for each sample after each exposure.
RESULTS The following tables contain data and ratings on the unexposed and exposed samples:
• Table 5 – Data before and after Exposure - Inch-Pound Units • Table 6 – Ratings before an after Exposure.
• Table 7 – Rankings by Exposure.
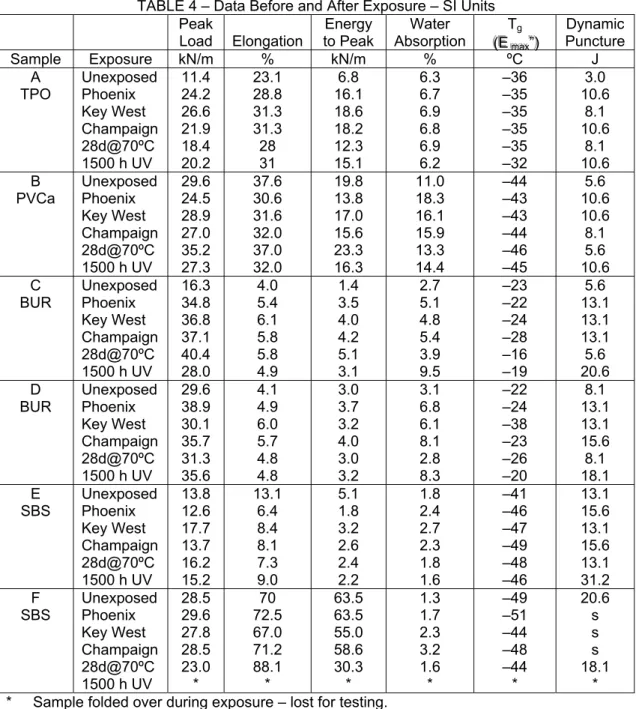
TABLE 4 – Data Before and After Exposure – SI Units Peak Load Elongation Energy to Peak Water Absorption Tg ( ((EEE mmmaaaxxx”””))) Dynamic Puncture Sample Exposure kN/m % kN/m % ºC J A TPO Unexposed Phoenix Key West Champaign 28d@70ºC 1500 h UV 11.4 24.2 26.6 21.9 18.4 20.2 23.1 28.8 31.3 31.3 28 31 6.8 16.1 18.6 18.2 12.3 15.1 6.3 6.7 6.9 6.8 6.9 6.2 –36 –35 –35 –35 –35 –32 3.0 10.6 8.1 10.6 8.1 10.6 B PVCa Unexposed Phoenix Key West Champaign 28d@70ºC 1500 h UV 29.6 24.5 28.9 27.0 35.2 27.3 37.6 30.6 31.6 32.0 37.0 32.0 19.8 13.8 17.0 15.6 23.3 16.3 11.0 18.3 16.1 15.9 13.3 14.4 –44 –43 –43 –44 –46 –45 5.6 10.6 10.6 8.1 5.6 10.6 C BUR Unexposed Phoenix Key West Champaign 28d@70ºC 1500 h UV 16.3 34.8 36.8 37.1 40.4 28.0 4.0 5.4 6.1 5.8 5.8 4.9 1.4 3.5 4.0 4.2 5.1 3.1 2.7 5.1 4.8 5.4 3.9 9.5 –23 –22 –24 –28 –16 –19 5.6 13.1 13.1 13.1 5.6 20.6 D BUR Unexposed Phoenix Key West Champaign 28d@70ºC 1500 h UV 29.6 38.9 30.1 35.7 31.3 35.6 4.1 4.9 6.0 5.7 4.8 4.8 3.0 3.7 3.2 4.0 3.0 3.2 3.1 6.8 6.1 8.1 2.8 8.3 –22 –24 –38 –23 –26 –20 8.1 13.1 13.1 15.6 8.1 18.1 E SBS Unexposed Phoenix Key West Champaign 28d@70ºC 1500 h UV 13.8 12.6 17.7 13.7 16.2 15.2 13.1 6.4 8.4 8.1 7.3 9.0 5.1 1.8 3.2 2.6 2.4 2.2 1.8 2.4 2.7 2.3 1.8 1.6 –41 –46 –47 –49 –48 –46 13.1 15.6 13.1 15.6 13.1 31.2 F SBS Unexposed Phoenix Key West Champaign 28d@70ºC 1500 h UV 28.5 29.6 27.8 28.5 23.0 * 70 72.5 67.0 71.2 88.1 * 63.5 63.5 55.0 58.6 30.3 * 1.3 1.7 2.3 3.2 1.6 * –49 –51 –44 –48 –44 * 20.6 s s s 18.1 * * Sample folded over during exposure – lost for testing.
s Sample delaminated upon impact.
Discussion
When you study these data, you will find that in 42 percent of the cases two years of outdoor exposure causes a greater change in the physical properties of the membranes than 28 days in an oven at 70ºC (158ºF) oven or 1500 hours of condensing ultra-violet exposure cycles.
The changes due to outdoor exposure are quite similar – regardless of the exposure site in many cases. Not too surprisingly, exposure at Phoenix and Key West causes greater changes than exposure at Champaign, but not by a large increment.
TABLE 4 (Continued) Date Before and After Exposure – SI Units Peak Load Elongation Energy to Peak Water Absorption Tg (E” max) Dynamic Puncture Sample Exposure kN/m % kN/m % ºC J G APP Unexposed Phoenix Key West Champaign 28d@70ºC 1500 h UV 28.0 29.6 26.8 25.6 22.0 17.8 10.8 7.6 7.2 7.1 6.3 15.0 7.7 4.9 4.9 4.2 2.6 5.5 2.5 3.1 3.2 3.2 3.2 3.9 –34 –38 –37 –37 –38 –36 18.1 23.2 15.6 15.6 13.1 26.1 H APP Unexposed Phoenix Key West Champaign 28d@70ºC 1500 h UV 23.6 24.0 21.9 22.6 24.2 23.4 89.0 71.1 70.5 72.2 68.0 58.0 59.7 48.3 44.6 45.3 47.2 38.5 1.8 3.3 3.0 2.6 2.5 2.6 –30 –34 –33 –30 –30 –28 15.6 23.2 20.6 23.2 13.1 33.7 J EPDM Unexposed Phoenix Key West Champaign 28d@70ºC 1500 h UV 8.6 12.4 11.2 11.0 9.7 10.8 537 499 511 527 562 620 96.6 134.6 124.8 123.9 110.1 134.4 2.6 2.4 2.7 2.2 2.9 2.6 –54 –53 –54 –53 –53 –54 5.6 13.1 13.1 13.1 5.6 13.1 K EPDM Unexposed Phoenix Key West Champaign 28d@70ºC 1500 h UV 8.8 9.5 9.6 9.5 7.7 8.1 510 374 391 441 468 523 100.1 81.6 91.4 102.0 83.5 96.6 2.9 3.1 2.9 2.5 3.2 2.9 –50 –50 –50 –50 –50 –52 5.6 10.6 10.6 10.6 3.0 10.6 L PVC Unexposed Phoenix Key West Champaign 28d@70ºC 1500 h UV 25.2 25.4 24.5 26.1 24.2 25.7 39.2 35.0 32.6 33.8 28.0 37.0 18.7 16.8 15.4 17.2 14.0 12.9 2.9 3.1 3.3 3.5 3.5 2.8 –42 –41 –40 –38 –44 –42 5.6 10.6 10.6 10.6 8.1 15.6 M PVC Unexposed Phoenix Key West Champaign 28d@70ºC 1500 h UV 28.9 26.8 25.4 26.6 23.4 24.7 33.3 38.5 38.9 40.4 36.0 39.0 19.3 19.6 18.9 20.0 16.5 26.1 2.2 2.6 2.6 2.5 2.4 2.3 –45 –43 –44 –42 –45 –44 8.1 13.1 13.1 13.1 10.6 18.1 Mean Unexposed Phoenix Key West Champaign 28d@70ºC 1500 h UV 21.0 24.3 24.0 23.8 22.9 21.5 114 98 100 106 112 125 34 34.0 32.7 34.7 32.2 32.4 3.4 4.9 4.7 4.9 4.0 5.1 –39 –40 –41 –40 –40 –38 9.6 13.1 12.0 13.1 9.3 19.0
The load-at-first peak increases due to outdoor exposure in 22% of the samples. The load-at-first-peak remains unchanged for 50% of the samples and declines in the rest of the samples.
The elongation and energy-to-first-peak of most of the samples remained constant or declined upon two year outdoor exposure. 17% of the samples showed a decline in these properties.
Outdoor exposure increased the water absorption in two thirds of the samples. The balance remained unchanged.
The glass transition temperature did not change significantly in 61% of the samples; it was increased in 31 % of the samples. The DMA results show that the UV exposure appears to be quite detrimental (caused a greater change in the physical properties tested) to the TPO sample tested, and the over 4ºC increase in Samples E and G may represent a breakdown of the polymer chain.
Dynamic impact resistance showed the greatest change due to weathering of the properties measured. Only 18% of the samples remained the same; the balance increased their impact resistance.
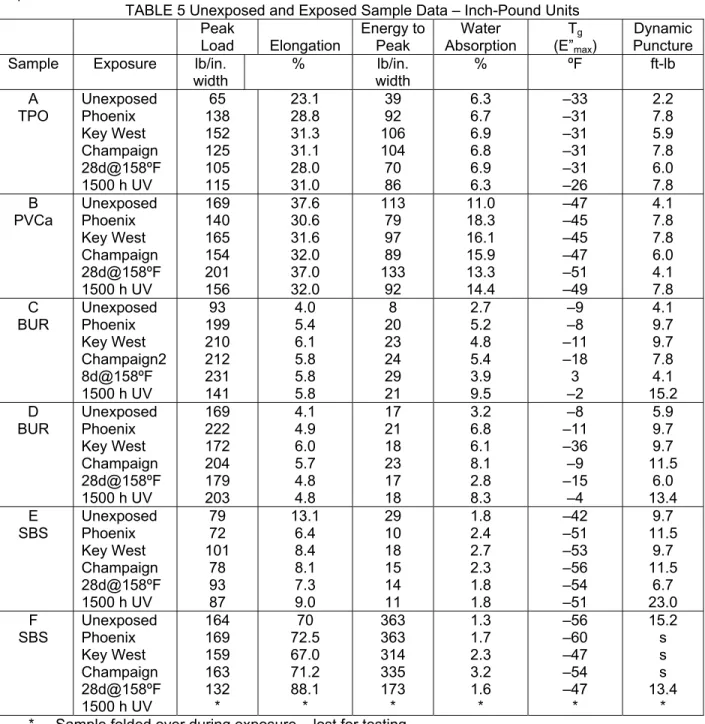
TABLE 5 Unexposed and Exposed Sample Data – Inch-Pound Units
Peak Load Elongation Energy to Peak Water Absorption Tg (E”max) Dynamic Puncture Sample Exposure lb/in.
width % lb/in. width % ºF ft-lb A TPO Unexposed Phoenix Key West Champaign 28d@158ºF 1500 h UV 65 138 152 125 105 115 23.1 28.8 31.3 31.1 28.0 31.0 39 92 106 104 70 86 6.3 6.7 6.9 6.8 6.9 6.3 –33 –31 –31 –31 –31 –26 2.2 7.8 5.9 7.8 6.0 7.8 B PVCa Unexposed Phoenix Key West Champaign 28d@158ºF 1500 h UV 169 140 165 154 201 156 37.6 30.6 31.6 32.0 37.0 32.0 113 79 97 89 133 92 11.0 18.3 16.1 15.9 13.3 14.4 –47 –45 –45 –47 –51 –49 4.1 7.8 7.8 6.0 4.1 7.8 C BUR Unexposed Phoenix Key West Champaign2 8d@158ºF 1500 h UV 93 199 210 212 231 141 4.0 5.4 6.1 5.8 5.8 5.8 8 20 23 24 29 21 2.7 5.2 4.8 5.4 3.9 9.5 –9 –8 –11 –18 3 –2 4.1 9.7 9.7 7.8 4.1 15.2 D BUR Unexposed Phoenix Key West Champaign 28d@158ºF 1500 h UV 169 222 172 204 179 203 4.1 4.9 6.0 5.7 4.8 4.8 17 21 18 23 17 18 3.2 6.8 6.1 8.1 2.8 8.3 –8 –11 –36 –9 –15 –4 5.9 9.7 9.7 11.5 6.0 13.4 E SBS Unexposed Phoenix Key West Champaign 28d@158ºF 1500 h UV 79 72 101 78 93 87 13.1 6.4 8.4 8.1 7.3 9.0 29 10 18 15 14 11 1.8 2.4 2.7 2.3 1.8 1.8 –42 –51 –53 –56 –54 –51 9.7 11.5 9.7 11.5 6.7 23.0 F SBS Unexposed Phoenix Key West Champaign 28d@158ºF 1500 h UV 164 169 159 163 132 * 70 72.5 67.0 71.2 88.1 * 363 363 314 335 173 * 1.3 1.7 2.3 3.2 1.6 * –56 –60 –47 –54 –47 * 15.2 s s s 13.4 * * Sample folded over during exposure – lost for testing.
Table 6 lists the original rating for each test and specimen before and after heat, ultra-violet, and outdoor exposures. The mean rating determined by this procedure is dependent on the number and types of tests performed in the evaluation. For example, comparing the rating of the unexposed Sample A (19) with the unexposed Sample B (35) is valid, but comparing the unexposed Sample A rating (19) with the rating after two years of exposure in Champaign, Illinois (62) – or any of the other post exposure samples - is not valid.
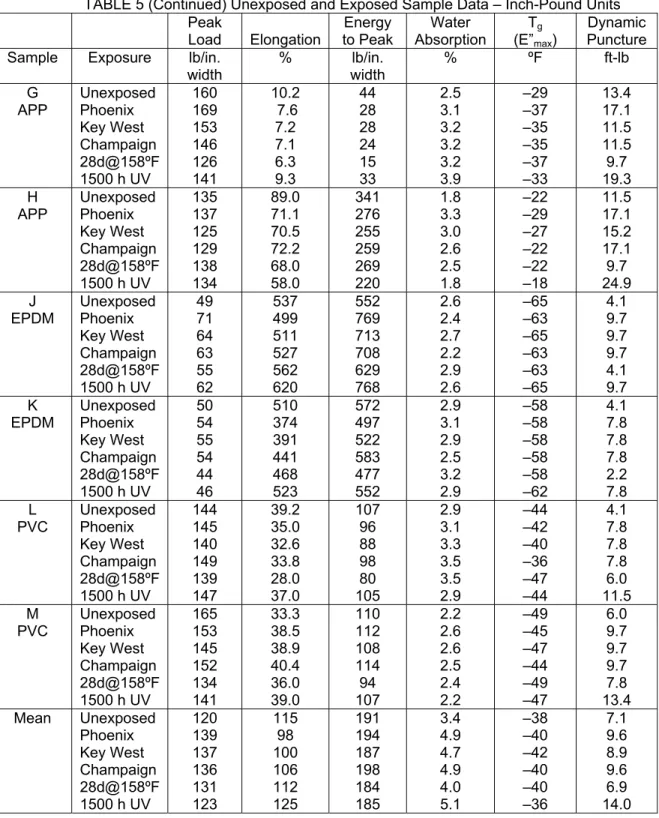
TABLE 5 (Continued) Unexposed and Exposed Sample Data – Inch-Pound Units Peak Load Elongation Energy to Peak Water Absorption Tg (E”max) Dynamic Puncture Sample Exposure lb/in.
width % lb/in. width % ºF ft-lb G APP Unexposed Phoenix Key West Champaign 28d@158ºF 1500 h UV 160 169 153 146 126 141 10.2 7.6 7.2 7.1 6.3 9.3 44 28 28 24 15 33 2.5 3.1 3.2 3.2 3.2 3.9 –29 –37 –35 –35 –37 –33 13.4 17.1 11.5 11.5 9.7 19.3 H APP Unexposed Phoenix Key West Champaign 28d@158ºF 1500 h UV 135 137 125 129 138 134 89.0 71.1 70.5 72.2 68.0 58.0 341 276 255 259 269 220 1.8 3.3 3.0 2.6 2.5 1.8 –22 –29 –27 –22 –22 –18 11.5 17.1 15.2 17.1 9.7 24.9 J EPDM Unexposed Phoenix Key West Champaign 28d@158ºF 1500 h UV 49 71 64 63 55 62 537 499 511 527 562 620 552 769 713 708 629 768 2.6 2.4 2.7 2.2 2.9 2.6 –65 –63 –65 –63 –63 –65 4.1 9.7 9.7 9.7 4.1 9.7 K EPDM Unexposed Phoenix Key West Champaign 28d@158ºF 1500 h UV 50 54 55 54 44 46 510 374 391 441 468 523 572 497 522 583 477 552 2.9 3.1 2.9 2.5 3.2 2.9 –58 –58 –58 –58 –58 –62 4.1 7.8 7.8 7.8 2.2 7.8 L PVC Unexposed Phoenix Key West Champaign 28d@158ºF 1500 h UV 144 145 140 149 139 147 39.2 35.0 32.6 33.8 28.0 37.0 107 96 88 98 80 105 2.9 3.1 3.3 3.5 3.5 2.9 –44 –42 –40 –36 –47 –44 4.1 7.8 7.8 7.8 6.0 11.5 M PVC Unexposed Phoenix Key West Champaign 28d@158ºF 1500 h UV 165 153 145 152 134 141 33.3 38.5 38.9 40.4 36.0 39.0 110 112 108 114 94 107 2.2 2.6 2.6 2.5 2.4 2.2 –49 –45 –47 –44 –49 –47 6.0 9.7 9.7 9.7 7.8 13.4 Mean Unexposed Phoenix Key West Champaign 28d@158ºF 1500 h UV 120 139 137 136 131 123 115 98 100 106 112 125 191 194 187 198 184 185 3.4 4.9 4.7 4.9 4.0 5.1 –38 –40 –42 –40 –40 –36 7.1 9.6 8.9 9.6 6.9 14.0
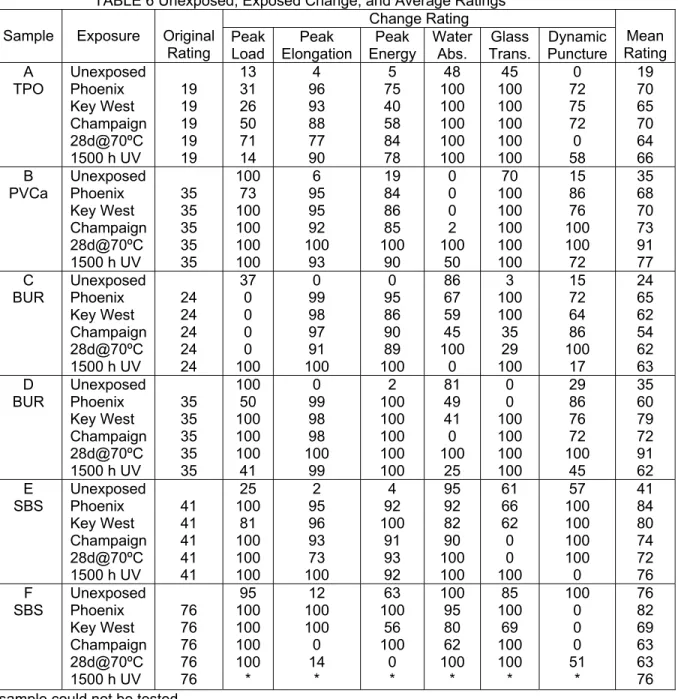
Table 6 also shows that the unexposed ratings for these samples ranges from 76 for the SBS in Sample F to the 19 shown by the TPO Sample A. The average rating for all of the unexposed samples is 47. The post-heat exposure samples have a mean rating of 63; while the post-ultra-violet samples have a 76 mean rating.
TABLE 6 Unexposed, Exposed Change, and Average Ratings Change Rating Sample Exposure Original
Rating Peak Load Peak Elongation Peak Energy Water Abs. Glass Trans. Dynamic Puncture Mean Rating A TPO Unexposed Phoenix Key West Champaign 28d@70ºC 1500 h UV 19 19 19 19 19 13 31 26 50 71 14 4 96 93 88 77 90 5 75 40 58 84 78 48 100 100 100 100 100 45 100 100 100 100 100 0 72 75 72 0 58 19 70 65 70 64 66 B PVCa Unexposed Phoenix Key West Champaign 28d@70ºC 1500 h UV 35 35 35 35 35 100 73 100 100 100 100 6 95 95 92 100 93 19 84 86 85 100 90 0 0 0 2 100 50 70 100 100 100 100 100 15 86 76 100 100 72 35 68 70 73 91 77 C BUR Unexposed Phoenix Key West Champaign 28d@70ºC 1500 h UV 24 24 24 24 24 37 0 0 0 0 100 0 99 98 97 91 100 0 95 86 90 89 100 86 67 59 45 100 0 3 100 100 35 29 100 15 72 64 86 100 17 24 65 62 54 62 63 D BUR Unexposed Phoenix Key West Champaign 28d@70ºC 1500 h UV 35 35 35 35 35 100 50 100 100 100 41 0 99 98 98 100 99 2 100 100 100 100 100 81 49 41 0 100 25 0 0 100 100 100 100 29 86 76 72 100 45 35 60 79 72 91 62 E SBS Unexposed Phoenix Key West Champaign 28d@70ºC 1500 h UV 41 41 41 41 41 25 100 81 100 100 100 2 95 96 93 73 100 4 92 100 91 93 92 95 92 82 90 100 100 61 66 62 0 0 100 57 100 100 100 100 0 41 84 80 74 72 76 F SBS Unexposed Phoenix Key West Champaign 28d@70ºC 1500 h UV 76 76 76 76 76 95 100 100 100 100 * 12 100 100 0 14 * 63 100 56 100 0 * 100 95 80 62 100 * 85 100 69 100 100 * 100 0 0 0 51 * 76 82 69 63 63 76 * = sample could not be tested.
Sample B (PVCa) had the highest water absorption before exposure. The water absorption after outdoor exposure was greater than the increase due to UV or heat exposure. Based on other studies, this high water absorption is related to wicking by the reinforcing fibers.
The load to peak for Sample C (BUR) showed a dramatic increase from16 to 40 kN/m (93 to 231 lb/in.) after heat exposure, together with the greatest increase in dynamic puncture resistance. Sample D (BUR) showed none of these characteristics – demonstrating that there
are significant differences in performance within the BUR family of membranes. We do not know the source of this variance.
TABLE 6 (Continued) Unexposed, Exposed Change, and Average Ratings Change Rating
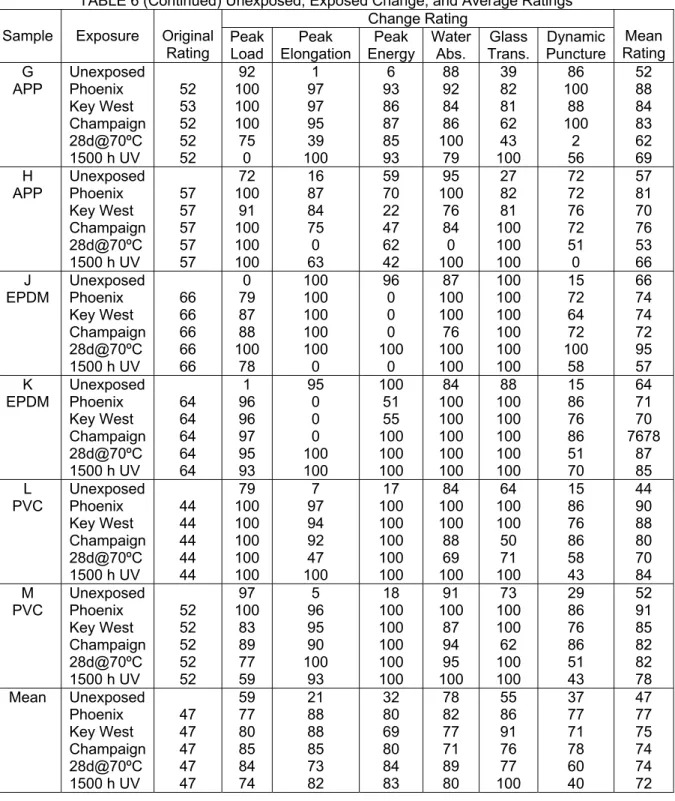
Sample Exposure Original Rating Peak Load Peak Elongation Peak Energy Water Abs. Glass Trans. Dynamic Puncture Mean Rating G APP Unexposed Phoenix Key West Champaign 28d@70ºC 1500 h UV 52 53 52 52 52 92 100 100 100 75 0 1 97 97 95 39 100 6 93 86 87 85 93 88 92 84 86 100 79 39 82 81 62 43 100 86 100 88 100 2 56 52 88 84 83 62 69 H APP Unexposed Phoenix Key West Champaign 28d@70ºC 1500 h UV 57 57 57 57 57 72 100 91 100 100 100 16 87 84 75 0 63 59 70 22 47 62 42 95 100 76 84 0 100 27 82 81 100 100 100 72 72 76 72 51 0 57 81 70 76 53 66 J EPDM Unexposed Phoenix Key West Champaign 28d@70ºC 1500 h UV 66 66 66 66 66 0 79 87 88 100 78 100 100 100 100 100 0 96 0 0 0 100 0 87 100 100 76 100 100 100 100 100 100 100 100 15 72 64 72 100 58 66 74 74 72 95 57 K EPDM Unexposed Phoenix Key West Champaign 28d@70ºC 1500 h UV 64 64 64 64 64 1 96 96 97 95 93 95 0 0 0 100 100 100 51 55 100 100 100 84 100 100 100 100 100 88 100 100 100 100 100 15 86 76 86 51 70 64 71 70 7678 87 85 L PVC Unexposed Phoenix Key West Champaign 28d@70ºC 1500 h UV 44 44 44 44 44 79 100 100 100 100 100 7 97 94 92 47 100 17 100 100 100 100 100 84 100 100 88 69 100 64 100 100 50 71 100 15 86 76 86 58 43 44 90 88 80 70 84 M PVC Unexposed Phoenix Key West Champaign 28d@70ºC 1500 h UV 52 52 52 52 52 97 100 83 89 77 59 5 96 95 90 100 93 18 100 100 100 100 100 91 100 87 94 95 100 73 100 100 62 100 100 29 86 76 86 51 43 52 91 85 82 82 78 Mean Unexposed Phoenix Key West Champaign 28d@70ºC 1500 h UV 47 47 47 47 47 59 77 80 85 84 74 21 88 88 85 73 82 32 80 69 80 84 83 78 82 77 71 89 80 55 86 91 76 77 100 37 77 71 78 60 40 47 77 75 74 74 72
Sample E (SBS) performed very well in the tests before and after exposure. Contrast these data with Sample F’s (SBS) data. Sample F was one of the strongest in load to peak and dynamic impact; it was also the softest of the samples – it folded over during the UV exposure. In addition, the plies delaminated during the dynamic impact test at –18ºC (0ºF) and after outdoor exposure at each of the three locations.
Samples G and H (APP) performed quite well in these tests before and after exposure, yet had significantly different elongation-to-peak values (G = 11% - H = 89 %) before exposure.
Samples J and K (EPDM) were the only samples without reinforcement in this study; they had the greatest elongation-to-peak load. Sample K had the greatest loss of elongation (510% to 391 and 441%) after the Key West and Champaign exposures.
Samples L and M (PVC) performed very well during all of the testing.
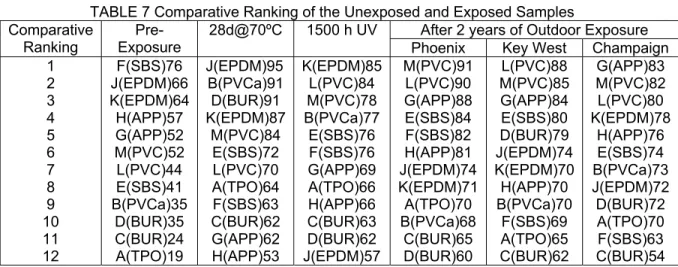
TABLE 7 Comparative Ranking of the Unexposed and Exposed Samples
After 2 years of Outdoor Exposure Comparative
Ranking
Pre- Exposure
28d@70ºC 1500 h UV
Phoenix Key West Champaign 1 2 3 4 5 6 7 8 9 10 11 12 F(SBS)76 J(EPDM)66 K(EPDM)64 H(APP)57 G(APP)52 M(PVC)52 L(PVC)44 E(SBS)41 B(PVCa)35 D(BUR)35 C(BUR)24 A(TPO)19 J(EPDM)95 B(PVCa)91 D(BUR)91 K(EPDM)87 M(PVC)84 E(SBS)72 L(PVC)70 A(TPO)64 F(SBS)63 C(BUR)62 G(APP)62 H(APP)53 K(EPDM)85 L(PVC)84 M(PVC)78 B(PVCa)77 E(SBS)76 F(SBS)76 G(APP)69 A(TPO)66 H(APP)66 C(BUR)63 D(BUR)62 J(EPDM)57 M(PVC)91 L(PVC)90 G(APP)88 E(SBS)84 F(SBS)82 H(APP)81 J(EPDM)74 K(EPDM)71 A(TPO)70 B(PVCa)68 C(BUR)65 D(BUR)60 L(PVC)88 M(PVC)85 G(APP)84 E(SBS)80 D(BUR)79 J(EPDM)74 K(EPDM)70 H(APP)70 B(PVCa)70 F(SBS)69 A(TPO)65 C(BUR)62 G(APP)83 M(PVC)82 L(PVC)80 K(EPDM)78 H(APP)76 E(SBS)74 B(PVCa)73 J(EPDM)72 D(BUR)72 A(TPO)70 F(SBS)63 C(BUR)54
Table 7 lists the top to bottom ranking of the twelve membranes based on their ratings before and after each exposure. We can determine if the unexposed, heat conditioned, or UV rankings can predict the rankings after outdoor exposure.
Conclusions
These data are a first step in our plan to compare accelerated testing data with outdoor exposures of two, four, and six years. These two-year data show:
.
• Neither the unexposed, heat, or UV rankings adequately predicted the rankings of the samples after two years of outdoor exposure
• At the two-year level, the change generated in the samples exposed outdoors was quite similar – almost independent of the exposure site – the Phoenix exposures caused slightly greater changes in these test data than the exposures at Key West and Champaign sites.
• Membranes of the same family can perform differently from each other. • The PVC membranes performed best in these two-year exposures. • The TPO and the BUR samples ranked lowest in all of these data.
These rankings are based solely on the change in the physical properties measured and may not reflect the long-term weather performance of these products. We should be encouraged by the fact that built-up roofing systems, some of the lowest ranking by the method reported, are currently giving outstanding outdoor performance throughout the world. If the rankings are true, then the rest of the systems should perform wonderfully.
We hope to be able to continue these studies. Today, we have exhausted our resources. Work on samples exposed for four and six years awaits new resources.
Acknowledgements
The following organizations contributed materials, time, or money to support this study:
• Bondcoat Roofing Systems • Carlisle Syntec Inc.
• Celotex Corporation
• Firestone Building Products Company • GAF Materials Company
• Johns Manville International • JPS Elastomerics Company
• National Research Council of Canada • National Roofing Contractors Association • Performance Roofing Systems
• Polyglass USA • Sarnafil, Inc.
• Simpson Gumpertz & Heger Inc. • Siplast, Inc.
• Tamko Roofing Products
• US Army Corps of Engineers – Engineering Research and Development Center. Referenced Documents
Bailey, DM, CG Cash and AG Davies, Jr., “Predictive Service Life Tests for Roofing Membranes – Phase II Investigation of Accelerated Aging Tests for Tracking Degradation of Roofing Membrane Materials,” USACERL TR-01, April 2002.
Bailey, DM, CG Cash and AG Davies, Jr., “Update: Service Life Tests for Roofing Membranes,”
Roofing Research and Standards Development: 5th Volume, ASTM STP 1451, W. J. Rossiter and
T. J. Wallace, Eds. ASTM International, West Conshohocken, PA, 2003.
Cash, CG and DM Bailey, “Predictive Service Life Tests for Roofing Membranes, Phase 1” USACERL Interim Report FM-94/03, December 1993.
Cash, CG, DM Bailey and AG Davies, Jr., “Predictive Service Life Testing of Low Sloped Roofing Systems, Phase 1” International Conference on Building Envelope Systems and Technologies, National Research Council Canada, Ottawa, 2001.