Publisher’s version / Version de l'éditeur:
Abstracts, AAAR 29th annual conference, October 25-29, 2010, Oregon Convention Center, Portland, Oregon, 2010-10-01
READ THESE TERMS AND CONDITIONS CAREFULLY BEFORE USING THIS WEBSITE.
https://nrc-publications.canada.ca/eng/copyright
Vous avez des questions? Nous pouvons vous aider. Pour communiquer directement avec un auteur, consultez la
première page de la revue dans laquelle son article a été publié afin de trouver ses coordonnées. Si vous n’arrivez pas à les repérer, communiquez avec nous à PublicationsArchive-ArchivesPublications@nrc-cnrc.gc.ca.
Questions? Contact the NRC Publications Archive team at
PublicationsArchive-ArchivesPublications@nrc-cnrc.gc.ca. If you wish to email the authors directly, please see the first page of the publication for their contact information.
NRC Publications Archive
Archives des publications du CNRC
This publication could be one of several versions: author’s original, accepted manuscript or the publisher’s version. / La version de cette publication peut être l’une des suivantes : la version prépublication de l’auteur, la version acceptée du manuscrit ou la version de l’éditeur.
Access and use of this website and the material on it are subject to the Terms and Conditions set forth at
Polarization correction of sun-light scattering for sky-scattered solar
radiation based plume transmissivity measurements
Devillers, Robin; Thomson, Kevin; Johnson, Matthew
https://publications-cnrc.canada.ca/fra/droits
L’accès à ce site Web et l’utilisation de son contenu sont assujettis aux conditions présentées dans le site LISEZ CES CONDITIONS ATTENTIVEMENT AVANT D’UTILISER CE SITE WEB.
NRC Publications Record / Notice d'Archives des publications de CNRC:
https://nrc-publications.canada.ca/eng/view/object/?id=da1391f9-d635-40e9-9766-0d65a102475b https://publications-cnrc.canada.ca/fra/voir/objet/?id=da1391f9-d635-40e9-9766-0d65a102475b
Polarization correction of sun-light scattering for sky-scattered solar
radiation based plume transmissivity measurements
Paper 2010-A-1012-AWMA
Robin Devillers, Kevin Thomson
Institute for Chemical Process and Environmental Technology, National Research Council, Ottawa, ON, Canada
Matthew Johnson
Department of Mechanical and Aerospace Engineering, Carleton University, Ottawa, ON, Canada
1.
ABSTRACT
The emission of fine particulate matter (PM) is a primary environmental concern and has been linked to serious health effects. Characterization and quantification of PM emission in industry is required for scientific and legal purposes but there are critical gaps in the ability to accurately obtain these data for operating plumes and flares. The present work investigates polarization-based approaches to correct scattering bias on outdoor plume transmissivity measurements. The plume transmissivity is measured with the experimental procedure described by Yang et al. (2010), a line-of-sight attenuation (LOSA) method using sky light as reference source. In clear-sky conditions, the soot aggregates scatter the direct sun light in addition to absorbing clear-sky light; in case of intense sun illumination, the plume intensity is overestimated, which corresponds to underestimating the plume attenuation and soot emission. The present study investigated the possibility of discriminating absorbed skylight from scattered sun light by using a light polarizer. The technique is based on the knowledge that light scattered by soot is highly polarized at 90° from the source, whereas the sky light polarization is usually moderate. The sun-light scattering bias on the extinction value was evaluated experimentally with outdoor LOSA measurements on a soot plume generated from a lab-scale inverted ethylene/air burner. The experiments demonstrated a bias in extinction measurements due to the interference of direct sun-light illumination in the range of -20 to -30%. The measurements were analysed with both LOSA and scattering models. This allowed a critical analysis of the possible correction approaches depending on the sky and sun conditions for the measurement. The model predicts that the bias could be reduced down to –2.5%.
2.
INTRODUCTION
Analysis of satellite imagery data suggests that global gas flaring may exceed 135 billion m3of gas per year1,2. Given these significant volumes, emission of particulate matter (PM) in the form of soot from flares is an important environmental concern. However, there are no readily available techniques or widely accepted diagnostics capable of quantifying soot emissions from flares under field conditions. In North America, most regulatory standards are instead based on human-observed measurements of plume opacity, as specified in the United States Environmental Protection Agency (EPA) Test Method 93. This method defines opacity of a plume as “the degree to which transmitted light [i.e broadband sky-light] is obscured”, and outlines a protocol for estimation by trained human observers. Attempts have been made to modernize EPA Method 9 by replacing the human observer with a digital camera, in a technique referred to as Digital Opacity Compliance System (DOCS)4,5, , and more recently in a similar approach referred to as DOM 6. Although the use of digital image processing represents an improvement over the human observed opacity characterization, the DOCS approach is essentially still a qualitative technique in that broadband opacity is not directly relatable to soot emissions.
Recently, Yang et al.7,8 reported development of a new technique referred to as sky-LOSA, capable of making quantitative measurements of soot emission in plumes of flares. LOSA is an acronym of Line-of-Sight Attenuation, and the technique relies on monochromatic optical transmissivity measurements through a plume using diffuse sky-light as illumination source for measurement. Through interpretation of measured data in accordance with Rayleigh-Debye-Gans Fractal Agglomerate (RDG-FA) theory for scattering and absorption of light by soot aggregates, it was shown to be possible to make quantitative measurements of soot concentration in plumes. The sky-LOSA approach was shown to work under a range of sky conditions with reasonable uncertainty levels of ≤ 40% relative to the alternative of a qualitative measurement of opacity via EPA Method 9. However, in conditions of bright, direct sunlight, sky-LOSA measurements would also be subject to bias error due to measurement interference generated by direct scattering of sunlight by the plume.
The issue of interference of plume measurements by direct scatter of sunlight is generally acknowledged, and is the basis for some of the procedures related to the positioning of the observer relative to the sun outlined in EPA Method 9. In the extreme, attenuation of sky-light by a plume could be sufficiently balanced by direct scattering of sunlight by the plume, such that a ground based intensity measurement might interpret the plume as being transparent or brighter than the sky. In conditions of bright, direct sunlight, this could lead to obvious bias in measurements of soot mass flux.
Lilienfeld et al.9 similarly noted that a significant challenge of any plume transmissivity measurement is the bias introduced by ‘plume brightness’. Lilienfeld proposed a strategy of using the semi-polarized nature of skylight and the unpolarized nature of sunlight to try and discriminate attenuation of the plume from solar scatter of the plume. A key assumption of the methodology is that particulate in plumes are non-polarizing scatterers, such that any scattered solar radiation remains unpolarized. While this might be an appropriate assumption for some larger sized particulate, it is in fact ill-suited for the typical aerosol emissions of industrial flares, which are primarily comprised of soot aggregates10-13
In the present study we experimentally examine the issue of measurement bias in sky-LOSA measurements by direct solar scatter and detail how soot aggregates are highly polarizing scatterers. Through analysis of measured data with extinction and scattering models for soot, we then demonstrate that the polarized nature of the light scatter from soot aerosols can be used to advantage in a modified version of the sky-LOSA diagnostic to suppress bias from scattered sunlight in plume transmissivity measurements. Finally, we propose a correction approach that could be used in the field to reduce bias uncertainty in practical implementations of sky-LOSA.
3.
BACKGROUND
3.1 Sky-LOSA method
In the sky-LOSA technique, transmissivity is determined via monochromatic optical attenuation measurements of sky-light through a soot laden plume. The attenuation of light by a medium is predicted by the Beer-Lambert-Bouguer14,15law presented in Equation (1). The transmissivity τ
λ is defined as the ratio of the transmitted intensity, Iλ, to the original sky-light intensity, , and
( )is the local extinction coefficient.
= = exp − ( ) (1)
In contrast to lab-based implementations of LOSA16-18for which can be directly measured, in sky-LOSA field applications the sky intensity at the location of the plume must be determined via interpolation using intensity data from regions outside the plume. However, as shown in Yang et al.8, this interpolation can be performed with a high degree of accuracy under a full range of sky conditions.
As further detailed by Yang et al.8, by invoking Rayleigh-Debye-Gans Fractal Agglomerate (RDG/FA) theory to model scattering and absorption of light by soot aggregates, it is possible to quantitatively relate a monochromatic measurement of plume transmissivity to soot concentration within the plume10-13.This relationship is shown in terms of the measured extinction coefficient in Equation (2):
=
( )
6 (1 + ) ( ) (2)
where ( ) is the soot absorption refractive index function and is the ratio of the total scattering coefficient ( ) to the absorption coefficient ( ).
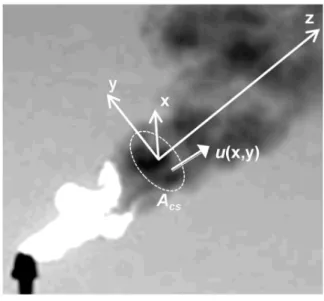
In principle, if the soot volume fraction is known locally throughout a cross-section of the plume, then the mass flow rate of soot ( ̇ ) in the plume can be determined by integration over that cross-sectional area as shown in Equation (3):
̇ = ( , ) (3)
where u(x,y) is the plume velocity, ρsootis soot density, and fvis the soot volume fraction, dA is
by definition normal to the velocity u(x,y). Figure 1 defines coordinate directions for an example plume.
Figure 1: Axis labels for typical plume geometry.
In practice, sky-LOSA measurements garner line-integrated concentration data along chords in the plume cross-section, rather than fully-resolved fv data in two dimensions. However, if the
plume velocity in this cross-section is reasonably uniform, then the soot emission rate is easily calculated by integration over the width of the plume as shown in Equation (4).
̇ = − 6 (1 + ) ( ) ln[ ( )] (4)
In the absence of significant direct scattering of sunlight by the plume, this approach has been shown to be effective at measuring soot mass flux in lab-scale plumes under a range of sky-conditions. However, under conditions of intense sunlight, direct scattering of this light by the soot aggregates in the plume will increase the intensity of the plume over what would be observed in a pure optical extinction process. The plume transmissivity would then be overestimated, leading to an underestimation of the soot emission rate.
4.
Experimental methods
4.1 Inverted burner
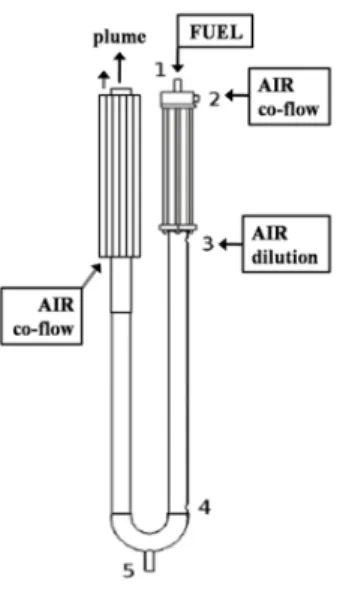
Soot measurements were performed in an inverted co-flow non-premixed burner following the design described by Stipe et al.19. As shown in Figure 2, the fuel is introduced into the burner via the port located on top of the burner (port 1). The oxidizer, co-flow air is introduced into the annular region between the fuel jet and the outer quartz tube (port 2). A secondary dilution air is introduced at the bottom of the quartz tube (port 3) in order to dilute, cool and mix the exhaust gas. With the inverted design, the upward buoyant force from the hot combustion products maintains a uniform downward flow that stabilizes the flame. The optical diagnostics on the exhaust plume are applied above the exhaust outlet (port 6); at this location the combustion products are mixed well.
The exhaust gases were sent through a vertical copper pipe in order to place the plume exit approximately 2.5 m from the ground such that an image of the plume from ground level included the sky in the background. Because the plume was affected by wind in this outdoor setting, an annular air co-flow was installed around the plume. The shielding co-flow was achieved using vertical 5mm-diameter tubes positioned around the outer diameter of the copper pipe, ensuring a vertical flow with minimum turbulence and vortices. This provided a reasonable level of repeatability for our measurements and comparison of successive acquisitions.
The fuel for the burner was ethylene. Ethylene has a high sooting propensity, allowing the the inverted flame to produce a significant concentration of soot leading to a significant level of attenuation with LOSA measurements. This ensured good contrast levels for the sky-LOSA acquisitions, while the soot physical and optical characteristics remained close to that found in the post-flame regions of methane burners11,13, which are more consistent with industrial flares. The fuel flow rate was set to 1.3 l/min while the air co-flow was set to 20 l/min and the secondary dilution air to 26 l/min.
Figure 2: Inverted co-flow burner
4.2 Sky-LOSA set-up
Sky-LOSA pictures were acquired with an ICCD camera (Princeton Instruments PIXIS, 1024x1024) placed 3 m away from the exhaust outlet and angled 28° upward toward the plume. A 105 mm visible camera lens was mounted on the camera as well as a narrow band-pass filter centered on 532 nm. The camera lens was set to f /8. Thirty pictures were acquired for every condition to permit statistically significant evaluation of the measurement uncertainty. The integration gate was set to 250 ms.
Measurements were performed on the NRC campus in Ottawa (45°25 N, 75°41 W), on November, 18th(around 3pm) and December, 2nd(1:22pm). At this time of year, the sun remains within 22° of the horizon at any time of day; the Sun elevation values (angle to the horizon) are presented in Table 1. The camera was placed at approximately 75 and 120° from the sun axis.
The sky was clear on November, 18th and slightly cloudy on December, 2nd but without any cloud blocking direct sun-light illumination on the plume. For every series of measurements, sky-LOSA pictures were acquired with and without direct sun-light illumination; the sun was blocked by placing a large vertical metal panel close to the plume.
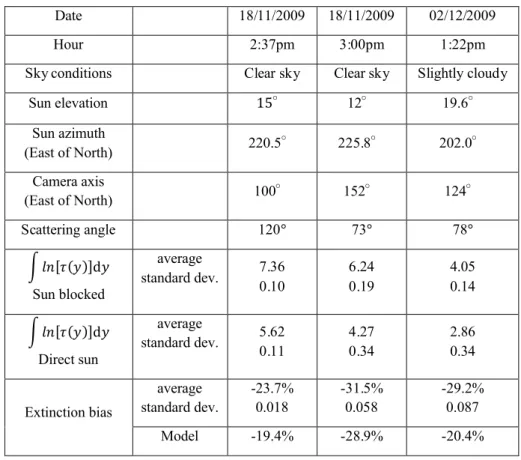
Table 1: Experimental results
Date 18/11/2009 18/11/2009 02/12/2009
Hour 2:37pm 3:00pm 1:22pm
Sky conditions Clear sky Clear sky Slightly cloudy
Sun elevation 15° 12° 19.6° Sun azimuth (East of North) 220.5° 225.8° 202.0° Camera axis (East of North) 100° 152° 124° Scattering angle 120° 73° 78° [ ( )]d Sun blocked average standard dev. 7.360.10 6.240.19 4.050.14 [ ( )]d Direct sun average standard dev. 5.62 0.11 4.27 0.34 2.86 0.34 Extinction bias average standard dev. -23.7% 0.018 -31.5% 0.058 -29.2% 0.087 Model -19.4% -28.9% -20.4%
5.
Results
5.1 Sun-light scattering interference
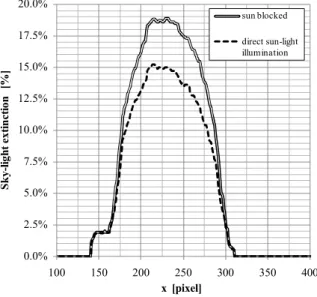
Pictures with and without direct sun-light illumination are presented in Figure 3 (close-up of the plume section). The pictures were taken on November, 18that 2:37 pm. The plume looks darker when the sun is blocked, e.g. in the absence of sun-light scattering. The plume transmissivity was calculated via the sky-LOSA approach with sky interpolation, providing the plume extinction. Horizontal profiles are plotted in Figure 4 for the two extinction pictures. The maximum sky-light extinction by the plume was reduced from 19% to 15% when the sun illuminated the plume.
This corresponded to an error of -23.7% in ∫ [ ( )]d on the plume transmissivity and hence, on the soot emission rate.
Figure 3: Plume images with direct sun-light illumination (left-hand side) and sun-blocked (right-hand side). Pictures taken on December, 18that 2:37pm.
Figure 4: Sky-light extinction by the plume. Horizontal profile extracted from the extinction pictures calculated for the pictures in Figure 3 (white dashed line).
Similarly, the plume looked brighter in the presence of direct sun illumination for the two other sets of experiments. On November 18that 3 pm, the plume extinction bias was -31.5% compared to reference case with the sun blocked. The bias was -29.2% on December, 2nd, even with the slightly overcast conditions. The results are summarized in Table 1, which shows averaged plume extinction values for the different cases as well as the standard deviation over the set of
0.0% 2.5% 5.0% 7.5% 10.0% 12.5% 15.0% 17.5% 20.0% 100 150 200 250 300 350 400 S k y-lig ht e xt in ct io n [% ] x [pixel] sun blocked direct sun-light illumination
individual images. The standard deviation was used to evaluate the uncertainty on the sun-light scattering bias itself: on December, 2nd, the bias due to the sun-light scattering was -29.2% with a standard deviation of 8.7% (30% relative uncertainty for the bias value). The uncertainty was larger on December, 2ndbecause of wind blasts that disturbed the plume on certain images. The three different sets of data show that sun-light scattering can be a significant source of error for sky-LOSA measurements for different sky conditions.
6.
DISCUSSION
As evidenced in the results, the impact of direct sun-light scatter on plume transmissivity measurements using sky-light is significant and will lead to under predictions of the soot emission rates from flares, in some cases to the point that soot cannot be detected. In this section, the experimental results are analyzed by modeling the direct sun-light illumination influence on sky-LOSA experiment. In addition to the sky-LOSA model presented in Section 3, the result analysis involved light scattering models by soot aggregates as well as diffuse sky-light models. First, the models used to predict the light scatter by soot and to predict local sky and direct solar intensity are presented and used to define a correction approach for the plume brightening bias.
6.1 Light scattering by soot aggregates
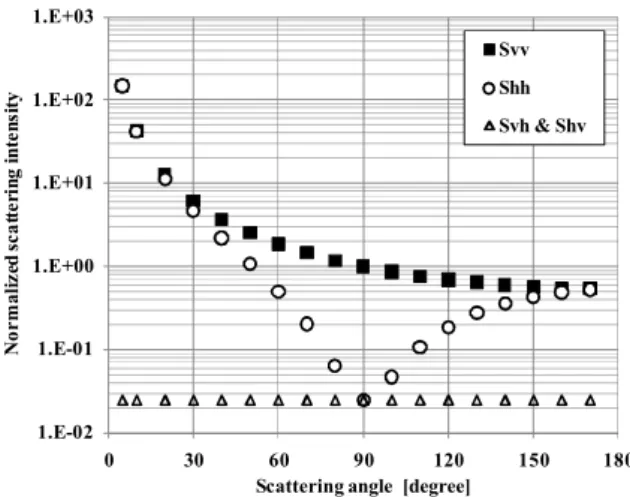
The theory of light scattering by fractal aggregates was reviewed in detail by Sorensen12, and experimental data for soot aggregates can be found in the work of Faeth and coworkers10,11,13. The cited methods which are based on Rayleigh-Debye-Gans Fractal Aggregate Theory (RDG-FA), can been used to evaluate the scattering features of soot plumes. Figure 5 shows example scattering curves calculated for soot aggregates in ethylene flames, and these data would be applicable to soot generated from a wide range of fuels. The result precedes the scattering model description because it is useful to first illustrate the typical features of light scattering by soot aggregates.
As shown in Figure 5, the intensity of scattering is very sensitive to both scattering angle, , defined as the included angle between the source propagation axis and the scatter detection axis where 0 degree is in the direction of light propagation, and light polarization. By convention, scattering signals are labeled with two subscript letters to identify the polarization of the incident light and the scattered signal (the source light and detected signal polarization are controlled with
polarizers in the experiment). Horizontal polarization, labeled h, is oriented in the plane of the source and detection axes and vertical polarization, v, is orthogonal to this plane.
Figure 5: Normalized scattering intensity for the various light polarization components. Calculated scattering for typical soot produced in the inverted burner with ethylene.
Signals normalized to the value of Svvat 90°.
In the case of soot aggregates, Svvis enhanced in the forward direction (i.e. in the direction of the
source light propagation). Shh has the same magnitude as Svv in the forward and backward
directions but drops to a minimum at 90° from the light propagation axis. The value of Shhat 90°
is only a few percent of Svvin the case of soot aggregates; this value is induced by a change of
the polarization direction during the scattering process (depolarization). The cross-polarization components Svhand Shvare only induced by depolarization, which explains their low signal level
at every angle. Sorensen12 uses physical considerations to demonstrate that S
vh and Shv are
isotropic; this characteristic will be assumed valid in the rest of this work.
For scattering by soot aggregates, the key observation to be made from Figure 5, is that the variations of light intensity with the scattering angle depend strongly on polarization. With this introduction, we now summarize the scattering model for soot aggregates.
Sorensen12describes S
vvin the case of fractal aggregates via Equation (5), where Isunis the source
light intensity, here the direct sun-light radiance, k the wavenumber of the incident light, n the soot aggregate number density, N the number of primary particles in the soot aggregate, dptheir
diameter, F(m) the soot refractive index scattering function, S( ,k) the structure factor, accounting for the angular dependence of scattering, and co is a constant accounting for the
collection properties of the set-up.
1.E-02 1.E-01 1.E+00 1.E+01 1.E+02 1.E+03 0 30 60 90 120 150 180 N or m al iz ed s ca tt er in g in te ns it y
Scattering angle [degree] Svv Shh Svh & Shv
= ( ) ( , ) ∝ ( , ) (5) The soot volume fraction fvis proportional to nNdp3and so Svvis proportional to the sun radiance,
the soot volume fraction and a function G accounting for the scattering angle, the collected monochromatic wavelength (via k) and various soot morphological and optical properties. This function G will not be expressed explicitly in this paper but can be evaluated from RDG/FA theory and soot characteristics such as fractal aggregates properties (fractal prefactor kf, fractal
dimension Df). dp, N, and the soot optical property, F(m). G was calculated here with the
assumption that the structure factor s was in the power-law regime12. The angular range of the power-law regime depends on the size of the aggregates and the wavelength. In the present case (soot properties presented in Table 2), the power-law regime is achieved for scattering angles higher than 17°.
As presented earlier, Shh is equal to Svv at 0 and 180°, but drops to a minimum at 90°; the
minimum is not exactly zero due to depolarization effects. The overall curve shape is described by Equation (6) where ρV is the depolarization ratio which can be evaluated from soot
morphology13.
( ) = ( )[ + (1 − )( ) (6)
The cross polarization components are assumed constant and equal to Svvat 90°13.
( ) = ( ) = (90°) (7)
In sky-LOSA experiments, soot aggregates scatter the light that directly reaches the plume from the sun. Since sun-light is unpolarized, the intensity of scattering by soot aggregates is then equal to the sum of the four components plotted in Figure 5 as in Equation 6, where each term is divided by two because the unpolarized light is divided into a horizontal and vertical component.
= 0.5( + ) + 0.5( + ) (8)
The v and h components of the scattered light can be selected by using a polarizer on the collection system, where the polarizer angle α equals 0° when the polarizer passes vertically polarized light. Since all four scattering components are defined as function of Svv, the total
scattering intensity can be expressed as a function of Svv via Equation (7). M is a function
accounting for the scattering angle, the polarizer angle as well as soot properties.
6.2 Correction approach of the scattering bias
The detailed analysis of the scattering properties of soot aggregates provides two strategies for the reduction of direct sun-light scattering from plume transmissivity measurements. First, the the angle of the viewing axis relative to the direct sun-light axis can be adjusted, where it is noted that the total scattering intensity decreases toward the backward direction. Filtering the vertically polarized component of the scattered can also reduce the scattering intensity and the optimal reduction is obtained when the transmissivity measurement is made at an angle of 90° to the direct sun-light axis.
In order to understand the sensitivity of the scattering bias to the measurement angle and polarizer angle, the total scattering intensity is presented for a range of the scattering angle and the polarizer angles in Figure 6. The plots have been calculated from the scattering values presented in Figure 5; the scattering intensity is normalized by its value for a scattering angle of 90° without polarizer. The minimum scattering intensity is obtained for a scattering angle of 90°, when the polarizer blocks the vertical polarization. At 90°, Shhis only a few percents of Svv; this
leads to a strong polarization of the scattering signal even with unpolarized incident light, making the polarizer filtering more efficient. In this position, the collected sun-light scattering signal is reduced to 4% of the scattered intensity measured without a polarizer.
6.3 Sky-light polarization model and sky-LOSA
In developing a protocol for using polarization to reduce direct solar scatter by a plume, the polarization properties of sky-light must also be considered. As has been noted in climate studies, sky-light polarization is an indicator of atmospheric turbidity or air pollution20,21. Sky-light itself is mainly caused by Rayleigh scattering of sun Sky-light from atmospheric molecules; the presence of water droplets or dust particles in the atmosphere leads to a reduction of the polarization degree of sky-light because their scattering properties do not belong to the Rayleigh regime (principally Mie scatterers). Such particles can then be detected by measuring atmospheric polarization.
The direction of polarization should be approximately perpendicular to a plane including the sun, the observer and the portion of sky studied. This plane roughly corresponds to the reference plane for the scattering of sun-light by the plume; the polarization direction of scattered sun-light and polarized sky-light should be close and both components should be reduced in the same proportion by using a polarizer. Thus, the polarized component of the sky-light is attenuated as the direct sun-light scattered light is, and is therefore not useful to the attenuation measurement.
Therefore, it is the unpolarized fraction of sky light which remains effective when the polarizer is most efficiently blocking the direct solar scatter.
Figure 6: Total scattering intensity collected with a polarizer for an unpolarized light source. The scattering intensity is normalized by its value without polarizer for a 90-degree scattering angle. The intensity is plotted vs. the polarizer angle for various scattering angles
(from 30° to 130°). The polarizer is oriented along the vertical axis (v polarization) at 0 degree.
Sky light is never fully polarized. For example in clear skies conditions, the degree of polarization, p, remains below 0.6523-25. In cloudy conditions, the degree of polarization of sky-light is low because of the presence of water droplets, usually below 0.220. Skylight polarization is principally linear, with circular polarization two orders of magnitude lower than the linear polarized component22. The degree of polarization varies strongly over the sky dome, even under clear sky conditions. The maximum polarization is found along an arc positioned 90° from the sun.
In an absolute sense, the signal which must be measured in a sky based attenuation measurement,
Sext, is the difference between the sky-light intensity and the intensity of the sky-light after
passing through the plume while the bias, Sscat, (Equation (9)) is a signal which reduces the
magnitude of Sext. Sext is presented in Equation (10) and follows from a rearrangement of
Equation (1) where in the limit of small attenuation, the exponential in Equation (1) can be replaced by the first two terms of the power series expansion. As with Sscat, Sext scales with the
intensity of the light source, here, Ssky, the soot volume fraction, and a function M’ which
accounts for the polarizer angle, the degree of polarization p of the sky as well as soot properties.
0.01 0.10 1.00 10.00 0 15 30 45 60 75 90 N or m al iz ed sc at te ri n g s
Polarizer angle [degree]
30 50
70 90
= (1 − )~ ( ) ∝ ′( , ) (10)
The ratio of sun-light scattering to sky-light extinction is then independent of the soot volume fraction since fvappears similarly in the equation describing both signals (Equation (9) and (10)).
Hence, the sun-light scattering bias only depends on soot properties as well as sky characteristics. The values selected for the soot parameters are listed in Table 2. They correspond to typical soot properties in the after flame of ethylene flames.
Table 2: Soot properties11
Parameter Value kf 8.5 Df 1.8 dp 32 nm N 467 E(m) 0.257 F(m) 0.257 sa 0.16
Since both the sky-light extinction and sun-light scatter signals are proportional to their respective light source intensity, knowledge of their intensities is critical to determine the relative weight of scattering and extinction. Predicting sun-light and sky-light intensity involves complex atmospheric models that require numerous parameters. Even the simplest solar models26 are sensitive to atmospheric data such as the atmospheric optical depth (AOD), the local Albedo or the total precipitable water in the atmosphere. The issue is made even more complex by the angular dependence of sky-light27; this must be taken into account since only a portion of the sky is visualized in sky-LOSA. In this work solar models have only been used to provide a realistic range for Isun and Isky without a formal validation process, since the uncertainty on the
atmospheric conditions of our experiments was too large to support a more detailed model. In the subsequent sections of this paper, the scattering and LOSA models are used to examine the proposed correction approach and to quantify more precisely the possible reduction of the sun-light scattering bias in sky-LOSA measurements.
6.4 Prediction of sun-light scattering bias
The models presented in Sections 6.1 and 6.3 were used in order to predict the sun-light scattering bias in the experimental conditions. The sun-light and sky-light intensities were calculated for typical atmospheric conditions in Ottawa at this time of year. The predicted values
of the bias are compared to the experimental results in Table 1. Most of the predicted values are within the uncertainty of the measurement; the values for December, 2nd are slightly off but the windy conditions disturbed the measurement stability. The calculated values face substantial uncertainty themselves since the exact atmospheric conditions have not been measured accurately. Hence, the present model for sun-scattering bias can be considered valid and will be able to provide a reasonable investigation of the correction approach.
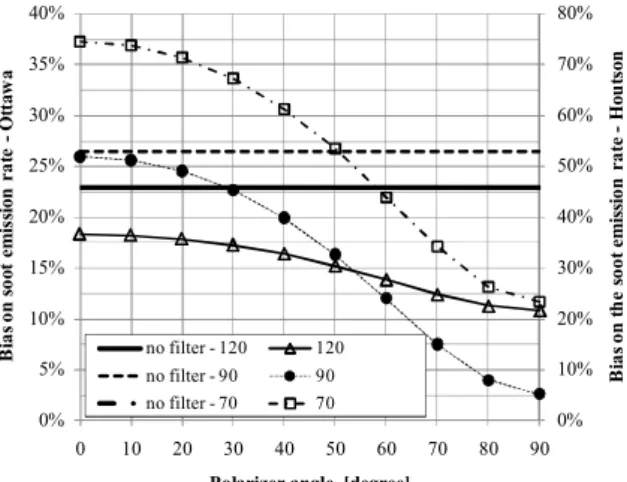
The model was then used to evaluate the correction that could be obtained by using a polarizer. The results are plotted in Table 1. The horizontal lines show the error induced by sun-light scattering for various scattering angles (without polarizer); the -23.7% experimental bias is visible at 120°. The connected dots correspond to various positions of the polarizer, showing the improvement that can be achieved. The curves confirm once again that the total scattering is reduced in the backward direction (lower error at 70° than at 120°). Moreover the plot illustrates the best achievable correction of the sunlight scattering bias: the error is reduced to -2.5% for a scattering angle of 90° and with the polarizer blocking the vertical polarization.
This reduction of the bias to -2.5% is achievable for the sky conditions found in Ottawa in mid-November. The sun elevation is rather low, which reduces the level of direct sun-light illumination. The solar model by Bird26 was used to evaluate the sunlight intensity in a less favorable location. The example of Houston, Texas (29°45 N, 95°22 E) on June, 21stwas chosen in order to obtain a higher sun elevation (sun elevation: 83°). Assuming similar atmospheric conditions, the direct sunlight to skylight intensity ratio is approximately twice higher compared to the Ottawa case. As presented previously with the models, the ratio of sunlight scattering to skylight extinction is proportional to the direct sunlight to skylight intensity ratio. The curves presented in Figure 7 would then be multiplied by 2 in the Houston case: -54% bias without polarizer for a scattering angle of 120° and -5.0% bias in the best case (90° with a polarizer oriented horizontally). This new range of biases is displayed with the vertical axis on the right-hand side in Figure 7, which is just similar to the axis on the left-right-hand side but multiplied by 2.
Figure 7: Predicted bias errors due to direct solar scattering from the plume with and without polarization correction. The ratio of sunlight to skylight intensity was adjusted in
order to match the bias that was measured on November, 18that 2:37 pm in Ottawa. The
vertical axis on the right-hand side accounts for the range of bias in Houston for June, 21st.
7.
SUMMARY
The present study demonstrated that a bias is introduced by direct sun-light scattering on plume transmissivity measurement. In the present example, a bias of -20 to -30% was observed in the soot emission rate from the plume. The theory of light scattering by soot was summarized and it was shown that light scattering by soot is highly polarized at 90° from the source, whereas the sky light polarization at this same angle is usually moderate. Thus a new experimental procedure is proposed where the detector is positioned so that it is 90° to the sun and is installed with a polarizer which blocks vertically polarized light. In this configuration, the maximum reduction of direct sun-light scatter bias is possible. A model which accounts for the relative intensity of sky-light and direct sun-light was coupled with the model for the light absorption and scatter properties of soot. The model predicts the bias and evaluates the potential of the proposed technique to reduce the bias. At the location of the experiment, the model predicts that the bias would be reduced from –30% down to –2.5%. Future work will include a demonstration of the recommended approach under a variety of sky and solar conditions.
8.
ACKNOWLEDGEMENTS
We gratefully acknowledge the support of Natural Resources Canada Program on Energy Resource Development and in particular the leadership contributions of Mr. Michael Layer, project manager. 0% 10% 20% 30% 40% 50% 60% 70% 80% 0% 5% 10% 15% 20% 25% 30% 35% 40% 0 10 20 30 40 50 60 70 80 90 B ia s on t h e so ot e m is si on r at e -H ou ts on B ia s on s oo t em is si on r at e -O tt aw a
Polarizer angle [degree] no filter - 120 120 no filter - 90 90 no filter - 70 70
9.
REFERENCES
1. C. Elvidge, K. Baugh, B. Tuttle, A. Howard, D. Pack, C. Milesi, and E. Erwin, A twelve year record of national and global gas flaring volumes estimated using satellite data, NOAA, 2007.
2. C.D. Elvidge, K. Baugh, B. Tuttle, D. Ziskin, and T. Ghosh, Improving Satellite Data Estimation of Gas Flaring Volumes, 2009
3. USA EPA, “Method 9 – Visual determination of the opcaicty of emissions from stationary sources”, Electronic Code of Federal regulationsm 1971, pp/. Title 40 – Protection of the Environment Part 60 – Standards of performances for new stationary sources – Appendix A-4, http://www.epa.gov/ttn/emc/promgate/m-09.pdf
4. McFarland, M.J.; Terry, S.H.; Calidonna, M.J.; Stone, D.A.; Kerch, P.E.; Rasmussen, S.L., J. Air Waste Manage. Assoc., 2004, 54, 296-306.
5. McFarland, M.J.; Terry, S.H.; Stone, D.A.; Rasmussen, S.L.; Calidonna, M.J., J. Air Waste Manage. Assoc., 2003, 53, 724-730.
6. Du, K., M. J. Rood, Kim, B. J.; Kemme, M. R.; Franek, B.; Mattison, K., Environmental Science and Technology, 2007, 41(3): 928-935.
7. Yang, C. (2008), Sky-scattered solar radiation based plume transmissivity measurements (Unpublished M.A.Sc. Thesis), Carleton University, Ottawa, ON, Canada, p. 150.
8. Yang, C., Thomson, K. A., Johnson, M. J., Combustion Institute/Canadian Section, Spring Technical Meeting, Toronto, 2008
9. Lilienfeld, P., G. Woker, Stern, R.; McVay, L., Applied Optics, 1981, 20(4): 800-806.
10. Koylu, U. O. and G. M. Faeth, Transactions of the ASME. Journal of Heat Transfer, 1994, 116(1): 152-9.
11. Krishnan, S. S., K. C. Lin, Faeth, G. M., Journal of Heat Transfer Transactions of the Asme, 2000, 122(3): 517-524.
12. Sorensen, C. M., Aerosol Science and Technology, 2001, 35: 648–687.
13. Krishnan, S. S., K. C. Lin, Faeth, G. M., Journal of Heat Transfer, 2001, 123(2): 331-339.
14. Bohren, C. F. and Hoffman, D. R., Absorption and Scattering of Light by Small Particles, John Wiley & Sons, Toronto, 1983
15. Siegel, R. and Howell, J. R., Thermal Radiation Heat Transfer, Third Edition, Taylor & Francis, Washingon, DC, 1992
16. Greenberg, P.S., Ku, J.C., Applied Optics, 1997, 36(22):5514-5522
17. Snelling, D.R., Thomson, K.A., Smallwood, G.J., Gulder, O.L., Applied Optics, 1999, 38(12):2478-2485
18. Thomson, K. A., Johnson, M. R., Snelling, D. R., Smallwood, G. J., Applied Optics, 2008, 47(5): 694-703.
19. Stipe, C.B., Lucas, D., Koshland, C.P., Sawyer, R.F., Review of scientific instrument, 2005, 76, 023908, 1-5
20. Coulson, K. L., Journal of Quantitative Spectroscopy and Radiative Transfer, 1971, 11(6): 739-755.
22. Prosch, T., D. Hennings, Raschke, E., Applied Optics, 1983, 22(9): 1360-1363. 23. Gambling D. J. and Billard, B., Aust. J. Phys., 1967, 20: 675-681
24. Liu, Y. and K. Voss, Applied Optics, 1997, 36(33): 8753-8764. 25. Pust, N. J. and J. A. Shaw,. Applied Optics, 2008, 47(34). 26. Bird, R. E,. Solar Energy, 1984, 32(4): 461-471.
27. Siala, F. M. F., M. A. Rosen, Hooper, F. C., ASME Journal of Solar Energy Engineering,
1990,112(2): 102-109.