Airline Revenue Management under Alternative Fare Structures by
Andrew Jacob Cusano
M.A., Economics
University of Nebraska-Lincoln, 2001
B.A., Economics
University of Nebraska-Lincoln, 1999
SUBMITTED TO THE DEPARTMENT OF CIVIL ENGINEERING IN PARTIAL FULFILLMENT OF THE REQUIREMENTS FOR THE DEGREE OF
MASTER OF SCIENCE IN TRANSPORTATION AT THE
MASSACHUSETTS INSTITUTE OF TECHNOLOGY SEPTEMBER 2003
0 2003 Massachusetts Institute of Technology. All rights reserved.
/11 MASSACHUSETTS INSTITUTE OF TECHNOLOGY
SEP
1 1 2003
LIBRARIES Signature of A uthor... ...Department of Civil Kd Environmental Engineering July 25, 2003
C ertified by...
Peter P. Belobaba Principal Research Scientist Department of Aeronautics and Astronautics Thesis Supervisor
Accepted by...
Cynthia Barnhart Chairman, Transportation Education CQmmittee
A ccepted by...
Htidi Nepf Chairman, Departmental Committee on Graduate Students
Airline Revenue Management under Alternative Fare Structures by
Andrew Jacob Cusano
Submitted to the Department of Civil and Environmental Engineering on July 25, 2003 in Partial Fulfillment of the Requirements for the Degree of Master of Science in
Transportation
ABSTRACT
Airline revenue maximization consists of two main components: pricing and revenue management. Revenue management systems are used to control seat inventory given a forecasted demand to maximize revenues. Fare structures have been constructed by major network airlines to segment demand with multiple fare products and numerous restrictions, a practice known as differential pricing.
The increasing presence of low-cost carriers with simplified fare structures (compressed fare levels and fewer booking restrictions) combined with recent market demand shifts have led some major network carriers to explore the use of simplified fare structures. This research examines the performance of revenue management systems under these alternative fare structures as compared to the performance of these systems with the traditional fare structure. The objective is to measure the impacts on overall revenue and revenue management under alternative fare structures.
The Passenger Origin-Destination Simulator (PODS) is used in this research to test the impact on revenue management of alternative fare structures. Results show that alternative fare structures lead to overall revenue reductions. The magnitude of reduction is as high as 20 percent when all fare restrictions are removed compared to the traditional base case fare structure. However, leg-based fare-class revenue management still produces a large revenue gain, up to 17 percent, over a first-come-first-serve regime regardless of the fare structure used. Furthermore, incremental revenue gains from origin-destination control as opposed to fare-class revenue management are still present with alternative fare structures. The incremental revenue gains are greater than 1 percent in all cases and greater than 3 percent when advance purchase requirements are removed. In the case when all restrictions are removed, origin-destination control actually performs better at a given network average load factor than with a traditional fare structure.
Thesis Supervisor: Dr. Peter P. Belobaba
Acknowledgements
First, I would like to thank Dr. Peter Belobaba, my research supervisor, for all of his support and guidance over the past two years. I have learned so much from him both in his classes he taught as well as by having so many opportunities to talk to him about revenue management research and my thesis.
I also thank Craig Hopperstad for helping me to better understand PODS and how it operates. I have enjoyed the numerous conversations with him, both on the phone and at consortium meetings.
I would also like to thank the members of the consortium for supporting this research. It has been great to interact with various groups at Continental, Delta, Northwest, Lufthansa, Swiss, SAS, and KLM. I appreciate their suggestions in helping to guide my research and their feedback when presenting results.
Thanks to my fellow MST '03 students. It was your camaraderie and support that kept me going at times. Specifically, I thank my friends Dan Amano, who joined me in the CTL lab until the late hours of the night working on problem sets, Ryan Tam, who taught me motivation, gave me help and support in my work, and finally made me realize that there are people who are just as much of an airline geek as I am, and Austin Horowitz, y travel companion on mileage runs, such as to Singapore for 30 hours.
Also, I could not have done this without the support and friendship of my fellow labmates in ICAT. Furthermore, I would like to thank the members of the PODS team: Adeem Usman, Diana Dorinson, Emmanuel Carrier and Thomas Gorin. Emmanuel and Tom also deserve my thanks for they taught me many things about PODS and the airline industry, as well as listening to and answering many questions about research and stimulating the development of this thesis. I also thoroughly enjoyed the many hours of discussing airline frequent flyer programs with them. Finally, I have to thank Alex Lee, for his task when I first arrived at MIT was to teach PODS to me. He was an excellent teacher and I thank him for his patience.
Finally, I would like to thank my parents for all of their support, as well as for their excellent job in raising me to be the person I am today. I also thank Ying for her understanding and unending support while I have been here.
Table of Contents
Chapter 1 Introduction ... 9
1.1 Airline Revenue Management under Alternative Fare Structures ... 9
1.2 M otivation ... . 11
1.3 Thesis O bjective... 12
1.4 T hesis Structure... 13
Chapter 2 PODS and Revenue Management Methods ... 15
2.1 Motivation for the PODS simulator ... 15
2.2 PODS System Structure ... 17
2.3 Revenue Management ... 19
2.3.1 Fare Class Yield Management (FCYM) Using an Expected Marginal Seat Revenue (EMSRb) Algorithm... 21
2.3.2 Heuristic Bid Price (HBP)... 22
2.3.3 Displacement Adjusted Virtual Nesting (DAVN) ... 23
2.3.4 Probabilistic Bid Price (ProBP)...24
2.3.5 Sum m ary ... 25
2.4 Simulation Environment ... 26
2.4.1 N etw ork D ... 26
2.5 The Fare Structure in PODS... 27
2.5.1 Ticket Restrictions in The Base Case... 28
2.5.2 Booking Curves in PODS ... 28
2.5.3 Advance Purchase Requirements in PODS... 30
2.5.4 PODS Base Fare Structure ... 31
2.6 Sum m ary ... . 31
Chapter 3 Airline Fare Structures and Passenger Disutilities... 33
3.1 An Economic Overview of Differential Pricing ... 34
3.1.1 Price Discrimination... 34
3.1.2 Differential Pricing... 35
3.2 Passenger Disutilities ... 37
3.2.1 Replanning Disutility ... 38
3.2.2 Unfavorite Airline Disutility ... 38
3.2.3 Path Quality Disutility... 39
3.2.4 Restriction Disutilities... 39
3.3 Restriction Disutilities... 39
3.4 Advance Purchase Requirements... 44
3.5 Market-based Fares Versus Structured Fares... 46
3.5.1 Structured Fares... 47
3.5.2 Market-Based Fares... 47
3.6 Examples of Airline Fare Structures ... 49
3.6.1 Denver to Albuquerque (DEN-ABQ) ... 49
3.6.2 New York (JFK) to Long Beach (JFK-LGB) ... 51
3.6.3 San Francisco to Phoenix (SFO-PHX)... 53
3.6.4 Boston to Los Angeles (BOS-LAX) ... 54
3.7 Sum m ary ... . 56
Chapter 4 Changes in Fares and Fare Ratios ... 58
4.2 B ase C ase R esults... 60
4.2.1 Base Case Fares and Passenger Mix ... 60
4.2.2 OD Control Performance in the Base Case...62
4.3 Structured Fares, Compression and Expansion of Fare Ratios ... 63
4.3.1 Fare Ratios: Revenue Change from Alternative Fare Structure...64
4.3.2 Fare Ratios: Revenue Gains from Leg-Based RM (FCYM)...65
4.3.3 Fare Ratios: Incremental Benefit of OD Control ... 67
4.3.4 Fare Ratios: Case Summary ... 71
4.4 Business Fare Reductions... 72
4.4.1 Fare Reduction: Revenue Change from Alternative Fare Structure ... 73
4.4.2 Fare Reduction: Revenue Gains from Leg-Based RM (FCYM)...75
4.4.3 Fare Reduction: Incremental Benefit of OD Control...76
4.4.4 Fare Reduction: Case Summary... 79
4.5 Sum m ary ... ... .. 80
Chapter 5 Removal of Fare Restrictions...82
5.1 Consequences of Removing Restrictions...83
5.2 Removal of The Saturday Night Stay Restriction... 85
5.2.1 No Saturday Night Stay Restriction: Revenue Change from Alternative Fare Structure ... . 85
5.2.2 No Saturday Night Stay Restriction: Revenue Gains from Leg-Based RM (FC Y M ) ... .... 87
5.2.3 No Saturday Night Stay Restriction: Incremental Benefit of OD Control 88 5.2.4 No Saturday Night Stay Restriction: Case Summary...93
5.3 Removal of The Saturday Night Stay, Non-Refundability, and Change Fee R estriction s... 9 3 5.3.1 Removal of Three Restrictions: Revenue Change from Alternative Fare S tructu re ... ... 94
5.3.2 Removal of Three Restrictions: Revenue Gains from Leg-Based RM (F C Y M ) ... 9 6 5.3.3 Removal of Three Restrictions: Incremental Benefit of OD Control ... 97
5.3.4 Removal of Three Restrictions: Case Summary ... 101
5.4 Reduction and Removal of Advance Purchase Requirements... 102
5.4.1 Removal of Advance Purchase: Revenue Change from Alternative Fare Structure ... ... 104
5.4.2 Removal of Advance Purchase: Revenue Gains from Leg-Based RM (F C Y M ) ... 106
5.4.3 Removal of Advance Purchase: Incremental Benefit of OD Control... 107
5.4.4 Removal of Advance Purchase: Case Summary... 111
5.5 Sum m ary ... . 11
Chapter 6 Conclusions and Future Directions ... 114
6.1 Contribution and Synthesis of Thesis... 114
List of Tables
Table 2-1: Summary of revenue management methods...26
Table 2-2: PODS disutilities and equivalent restrictions ... 28
Table 2-3: Timeframe mapping to days before departure...29
Table 2-4: Advance Purchase Requirements in Base Case... 31
Table 2-5: POD S base fare structure... 31
Table 3-1: An example of fare class restrictions... 41
Table 3-2: Disutility coefficients in PODS ... 41
Table 3-3: Example of fares in a market ... 42
Table 3-4: An example of fare classes with restrictions and advance purchase requ irem ents ... 4 5 Table 3-5: An example of structured fares across markets ... 47
Table 3-6: An example of real fares across markets ... 47
Table 3-7: Mean, standard deviation, min, and max of real fares in PODS (N=482)... 48
Table 3-8: Frontier's Fares DEN-ABQ ... 50
Table 3-9: UA 's fares DEN -ABQ ... 50
Table 3-10: JetBlue's fares for the JFK-LGB market ... 52
Table 3-11: AA's fares in the JFK-LGB market... 53
Table 3-12: America West's Fare Structure SFO-PHX... 54
Table 3-13: AA's Fare Structure BOS-LAX ... 55
Table 4-1: PODS Base Case Fare Statistics...60
Table 4-2: Fare Ratios Used in This Case...64
Table 4-3: Revenue Comparison of Structured Fares to the Base Case...64
Table 4-4: ALF at Different Structured Fare Ratios ... 67
Table 4-5: Fare Ratio Statistics with Business Fare Reduction ... 72
Table 5-1: Total Perceived Cost of Fare Products for a Business Passenger... 83
Table 5-2: Total Perceived Cost of Fare Products for a Leisure Passenger...84
List of Figures
Figure 2-1: Basic PODS System Structure (Courtesy of Hopperstad) ... 18
Figure 2-2: Representative Network D map ... 27
Figure 2-3: PODS Cumulative Booking Curves ... 30
Figure 3-1: A firm offering a single price ... 36
Figure 3-2: A firm offering two prices... 37
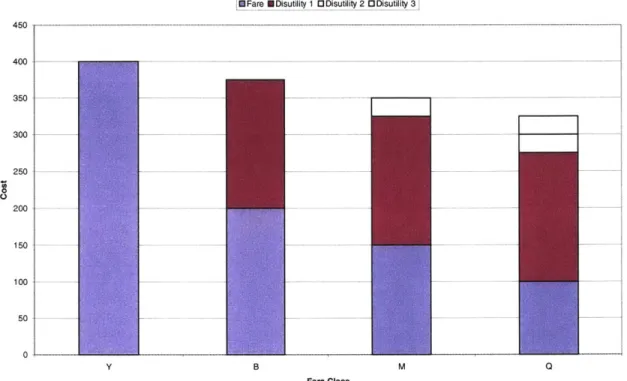
Figure 3-3: Total Perceived Cost for Business Travelers ... 43
Figure 3-4: Total Perceived Cost for Leisure Travelers... 44
Figure 4-1: Base Case Fare Class M ix... 61
Figure 4-2: Base Case OD Control Performance ... 62
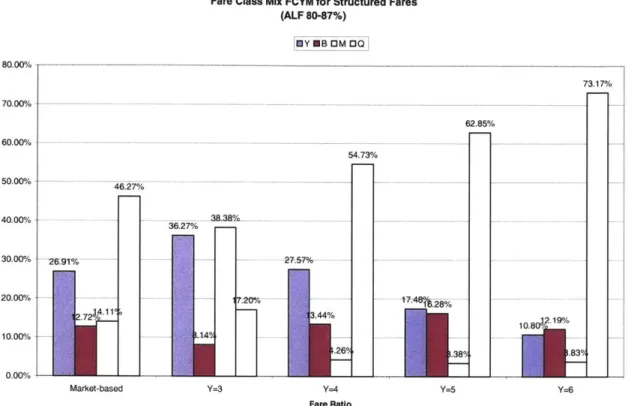
Figure 4-3: Fare class mix at different fare ratios using leg-based RM...65
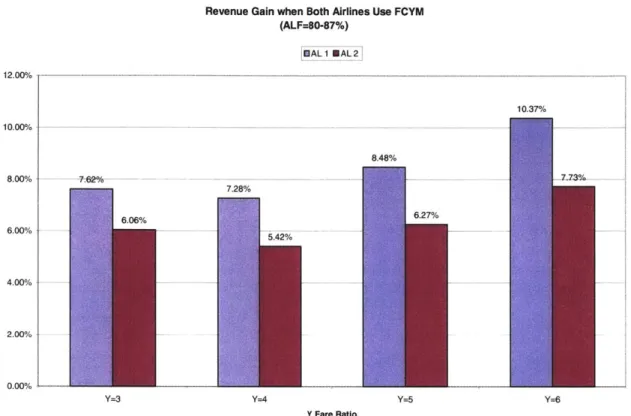
Figure 4-4: Both airlines move from FCFS to leg-based RM at different structured fare ratio s ... 6 6 Figure 4-5: OD Control performance with different structured fare ratios...67
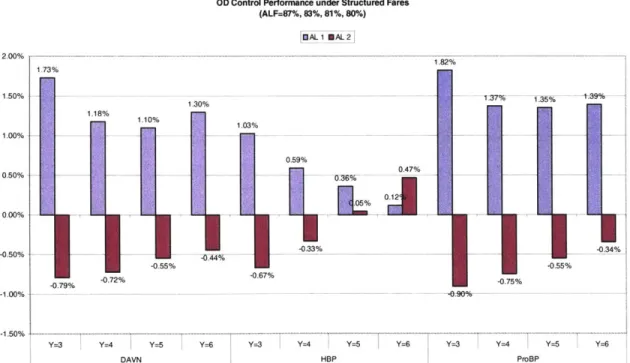
Figure 4-6: Fare Ratio DAVN OD Control Curve...69
Figure 4-7: Fare Ratio HBP OD Control Curve...70
Figure 4-8: Fare Ratio ProBP OD Control Curve ... 71
Figure 4-9: Revenue Change from implementing Alternative Fare Structure using leg-b ased R M ... 73
Figure 4-10: Fare Class Mix with fare reduction using leg-based RM...74
Figure 4-11: Both airlines move from FCFS to leg-based RM with business fare redu ction ... 7 5 Figure 4-12: OD Control performance with a business fare reduction...76
Figure 4-13: Fare Reduction DAVN OD Control Curve ... 77
Figure 4-14: Fare Reduction HBP OD Control Curve... 78
Figure 4-15: Fare Reduction ProBP OD Control Curve ... 79
Figure 5-1: Revenue Change from Implementing Alternative Fare Structure using Leg-B ased R M ... 86
Figure 5-2: Fare Class Mix with No Saturday Night Stay Restriction...87
Figure 5-3: Both Airlines Move from FCFS to leg-based RM with No Saturday Night S tay ... 8 8 Figure 5-4: OD Control Performance with No Saturday Night Stay Restriction...89
Figure 5-5: No Saturday Night Stay DAVN OD Control Curve ... 90
Figure 5-6: No Saturday Night Stay HBP OD Control Curve ... 91
Figure 5-7: No Saturday Night Stay ProBP OD Control Curve ... 92
Figure 5-8: Revenue Change from Implementing Alternative Fare Structure...95
Figure 5-9: Fare Class Mix with Three Restrictions Removed Using Leg-Based RM .... 96
Figure 5-10: Both Airlines Move from FCFS to leg-based RM with Three Restrictions R em ov ed ... 9 7 Figure 5-11: OD Control Performance with Three Restrictions Removed... 98
Figure 5-12: Three Restrictions Removed DAVN OD Control Curve... 99
Figure 5-13: Three Restrictions Removed HBP OD Control Curve... 100
Figure 5-14: Three Restrictions Removed ProBP OD Control Curve... 101
Figure 5-15: Revenue Change from Implementing Alternative Fare Structure...104
Figure 5-17: Both Airline Move from FCFS to leg-based RM with Reduced AP
R equirem ents... 106
Figure 5-18: OD Control Performance with Reduced AP Requirements ... 107
Figure 5-19: Reduced AP DAVN OD Control Curves ... 108
Figure 5-20: Reduced AP HBP OD Control Curves... 109
Chapter
1
Introduction
1.1 Airline Revenue Management under Alternative Fare Structures
Revenue maximization encompasses two main functions: pricing and revenue management. Pricing, namely differential pricing, entails the development of a multi-tiered fare structure with different restrictions and requirements placed on each fare product. The goal of differential pricing is to get passengers to buy tickets that are close to their maximum willingness to pay for transport. Furthermore, revenue management is the practice of controlling seat inventory to protect seats for last-minute passengers who are willing to pay more for travel by limiting the amount of seats that can be booked in low fare classes. A revenue management system includes a detailed forecaster to project future bookings for all flights in all markets using a historical database and an optimizer that sets inventory control limits on the number of seats to make available in each fare class either on a leg or in a market.
A fare structure with different fare levels attempts to segment passengers into distinct groups by adding restrictions and requirements to the low-fare ticket classes. This allows price-sensitive but schedule flexible passengers, typically thought of as leisure passengers, to book lower-priced tickets, assuming revenue management inventory control allows them to be available. At the same time, less flexible passengers, typically business passengers, usually have only higher-fare options because the restrictions and requirements placed on low fare-class tickets are unattractive to this segment of passengers. Some common restrictions put in place by airlines include non-refundability, Saturday night stay requirements, maximum stay requirements, advance purchase requirements, and a fee charged if any changes are made to a reservation (typically known as a "change fee"). The ultimate goal is to sell different fare products to these different segments of demand by using the aforementioned restrictions and revenue
management to limit the number of seat that are available at low fares. A more complete explanation of these principles can be found in Belobaba (1987).
The restrictions serve a distinct purpose in segmenting demand. A leisure traveler typically has travel plans well thought out in advance and is elastic with respect to price. Leisure travelers typically can meet all of the restrictions. Business travelers, on the other hand, are more affected by the use of restrictions. One reason why the non-refundability restriction exists is to deter business travelers, willing to pay a high fare, from buying a low fare product. A business traveler may not know travel plans until the last minute and is inelastic with respect to price because this traveler has to travel. The restrictions essentially corral the business travelers into the higher fare classes because many business travelers cannot purchase their tickets in advance (rationale for advance purchase requirement), need to be able to change tickets if plans change or refund tickets if a travel plans are cancelled (rationale for change fee and non-refundability), and want to fly during weekdays because business does not typically occur on weekends (rationale for Saturday night stay restriction). Finally, inventory control uses demand forecasts to ensure that it protects enough seat inventory for those passengers that will be booking last minute, high-yield tickets.
Airline revenue management, defined as seat inventory control, is responsible for large revenue gains by airlines. Smith et al. (1992) estimate that leg-based revenue management has generated approximately $500 million per year in extra revenue for American Airlines. The network airlines have invested a large amount of money into these revenue management systems because they know they are getting a return on their investment. This leads to a major concern that revenue management systems may not perform as well, that is provide significant incremental benefits, if a relaxation of the fare restrictions is implemented, in response to growing price competition.
1.2 Motivation
A current issue in the airline industry is the increasing presence of low-cost carriers. These carriers typically have fare structures that include a compressed set of fares, meaning that the dispersion of fares between fare classes is less than in a traditional fare structure, and a relaxation of some or all of the ticket restrictions that have become commonplace among network air carriers. In the face of this new competition, the network carriers must rethink their own pricing and fare structures. Some network carriers have implemented alternative fare structures in markets where they compete with low-cost carriers. This leads to questions regarding the overall revenue performance of the network carrier. A very pertinent question is the performance of their revenue management systems given compressed fares and relaxed restrictions.
The motivation of this thesis stems from two main sources. First, revenue management has been studied extensively in the past twenty years. Previous works have repeatedly shown the revenue benefits of implementing a revenue management system to control the allocation of seat availability by fare class (protect inventory for segments of the demand that are willing to pay more) based on demand forecasts. Furthermore, incremental revenue gains have been reported when implementing a more sophisticated origin-destination (OD) control revenue management system versus traditional fare-class yield management. See Lee (1998) for a detailed analysis of incremental benefits of OD control. However, most of these prior studies have focused on experiments where the network carriers keep all of the traditional restrictions in place and have a single set fare structure.
Airline fare structures and passenger disutilities have been examined (Lee (2000) presents the modeling of passenger disutilities), but these studies did not address the impacts on revenue management of changing the relative fare values, or removing ticket restrictions. Examining parametrically the performance of revenue management methods when the fare structure changes and/or ticket restrictions have been removed has not been examined before in detail and would address the current changes in the airline industry as
traditional network carriers have been questioning these traditional restrictions and fare structures given the emergence of profitable low-cost carriers. The results and conclusions can be used to determine if revenue management is still as effective when the traditional assumptions of airline pricing are broken down and alternative fare structures with fewer restrictions are used. An alternative fare structure can incorporate a compressed fare structure (fare classes are closer together in terms of fare value) or relaxed restrictions (removing some or all of the aforementioned restrictions), or a combination of both.
Second, traditional network carriers are currently being threatened by low-cost carriers (LCC). LCCs typically have somewhat different fare structures and fewer ticket restrictions than the network carriers. In this environment, they have been thriving while network carriers have been taking drastic measures to recover revenue and cut costs. The LCCs are expanding into more of the network carriers' markets. Network carriers, such as America West Airlines, have relaxed some of their ticket restrictions and altered their fare structure in an attempt to boost revenue and compete more effectively with the LCCs. Other network carriers, witnessing America West's success with this move, have gradually attempted the same changes in select markets. This study's main objective is not focused on pricing and market entry. However, the motivation for this line of inquiry stems from the fact that airlines have recently been faced with the prospect of simplifying fare structures and restrictions to remain competitive. This thesis will examine specifically the effect that these changes might have on the performance of a revenue management system.
1.3 Thesis Objective
This thesis examines the impact on revenue management methods with alternative fare structures. An alternative fare structure refers to a fare structure where fare values have been compressed and/or some or all of the ticket restrictions relaxed. Beginning with the traditional differentiated fare structure laden with ticket restrictions, the study examines parametrically the performance of revenue management algorithms when some or all of
these restrictions are removed. This is combined with changing the fare values in all markets to test revenue management performance when fares change, primarily when
fare differentials are compressed.
The goal of this thesis is to examine the performance of revenue management methods under different fare and restriction regimes. It attempts to answer the question if an airline simplifies its fare structure, then will the fundamental benefits of revenue management still be realized and will the incremental benefits of a more sophisticated OD control system still exist. Not only does this study examine if revenue management benefits still occur under different fare structures, but also to what magnitude revenue management benefits the airlines given alternative fare structures.
1.4 Thesis Structure
The first chapter of this thesis gives a brief description of airline revenue management methods and possible variations in performance given changes in the fare structure such as removing advance purchase requirements and/or ticket restrictions. The motivation for this thesis is also presented as well as the main objectives of the research. Finally, an
overview of the thesis structure is given.
Chapter Two examines the basic premise of revenue management and gives some detail into the specific "vanilla" revenue management used by most airlines. Also, the chapter introduces the Passenger Origin-Destination Simulator (PODS), the tool that is used in this thesis to test hypotheses, including the specific network to be used, Network D. The discussion includes an overview of PODS, its passenger choice model, its uniqueness as an airline simulator, and presents some of the baseline fare structure parameters used in this study.
The third chapter examines fare structures assumed to be representative of traditional network carriers. This chapter includes a general overview of disutilities and fare structures in theory and how they are represented in the PODS simulator. It begins with
an examination of the economic theory of price differentiation. Then, a discussion of passenger disutilities and willingness to pay ensues. The focus is on restriction disutilities and some examples, both hypothetical and from the PODS simulator, are used. Advance purchase requirements are also discussed. There is a brief description of market-based fare structures and structured fare structures. Finally, some examples of different fares structures from real world airlines help to illustrate the theory and some common differences among the traditional network air carriers and low cost carriers are discussed.
The fourth chapter examines parametric tests of fare-class yield management (FCYM) and OD revenue management control in PODS. The experiments in this chapter focus on changing fare ratios and values, such as compressing and expanding fare differentials as well as initiating business fare reductions while keeping the traditional fare restrictions.
Chapter Five presents PODS simulation results pertaining to the performance of revenue management methods given changes in the fare product restrictions. The experiments in this chapter include removing some or all of the fare product restrictions and reducing and/or removing advance purchase requirements. The results presented focus on the impact of revenue management methods on the airlines' performance given that a
fundamental change in the fare structure has occurred.
Chapter Six, the final chapter, reviews the findings of the thesis, its objective and methodology, and provides some future research directions. The findings are synthesized with the initial hypotheses, namely to determine whether there are still revenue management benefits when the fare structure is radically changed and simplified. Finally, unanswered questions of the thesis are discussed and this discussion leads to a description of new directions for further research.
Chapter 2
PODS and Revenue Management Methods
The Passenger Origin-Destination Simulator (PODS) is a competitive computer simulation that is used to test airline revenue management methods. It was developed by Craig Hopperstad and The Boeing Company and is used extensively in a series of studies and theses produced by the MIT Flight Transportation Laboratory, now The International Center for Air Transportation. PODS simulates a competitive origin-destination network, which can have from one to five airlines. Using choice models, simulated passengers make a decision regarding carrier and product choice. Furthermore, one can input different revenue management methods for the airlines to use in the simulation. The simulation produces output that can be used to analyze the performance of these different revenue management methods given sets of input parameters.
This chapter is intended to provide a brief overview of PODS and the revenue management methods available for use in the simulation. Wilson (1995) provides a more detailed introduction to the PODS simulator. The first section of this chapter briefly examines the motivation for PODS as a revenue management research tool and a competitive simulation. Then, there is a short explanation of the PODS system architecture and the underlying passenger choice model. Finally, the chapter concludes with an outline of the revenue management methods used in PODS and their basic premise.
2.1 Motivation for the PODS simulator
PODS research has focused on its use as a revenue management tool. The development of airline revenue management, discussed in more detail later in this chapter, has caused profound change in the industry. Many fare products are offered to different market demand segments. Furthermore, recent developments in computing power have led to
the feasible implementation of larger and more complex revenue management algorithms. This makes PODS a very useful simulation to test these algorithms under different conditions to examine how they perform in the simulated network.
While some studies have focused on the overall benefit of revenue management versus no revenue management, also known as first-come-first-serve (FCFS), more recent studies have shifted attention to the incremental benefit of network OD control versus the leg-based EMSR heuristic developed by Belobaba (1987 and 1992). This incremental benefit will also be explored in this thesis. Furthermore, the numerous parameters in PODS allow for the examination of the performance of revenue management methods under different circumstances, including changes in demand, fare structures, or passengers' disutilities.
There are a number of significant differences between PODS and other airline revenue management simulations. First, PODS allows for passenger choice among airlines/paths/fares using a sophisticated passenger choice model, described in the next section of this chapter, that allows for simulated passengers to define a decision window based on the Decision Window Model developed by The Boeing Company and to exhaust a complete choice set given parameters before simulated passengers become choose not to fly. This is in stark contrast to earlier simulators that operated on a "first-choice-only-choice" (FCOC) principle. Essentially, if the simulated passenger's first choice was not available, then the passenger would not travel. In PODS that passenger may have a second or third choice that is available and books it.
Second, as stated above, PODS simulates a competitive airline network. This means that passengers who may prefer Airline 1 might instead fly Airline 2 because of the passenger choice model allowing a choice set and the fact that up to five airlines can be programmed into the simulation. This is a very important part of the simulation because researchers can examine the competitive effects of different RM methods, fare structures, forecasting techniques, scheduling, and numerous other topics. Also, each airline can have a different revenue management method. Thus, not only can PODS output report
the incremental benefits of revenue management, but it can also report the incremental loss from not having revenue management when one or more competitors do.
The choice model applied to simulated passengers in PODS and the competitive nature of the simulation set it apart from previous simulators. It is both the choice model and the competitive nature of the simulator together that makes PODS such a powerful simulator. This is partially due to the fact that, other than scheduling choice, competition creates a large number of choices for the simulated passengers. On top of all of this is the revenue management system that allocates available seat inventory in every simulated leg or market.
2.2
PODS System Structure
PODS simulates a competitive airline network environment with many origin-destination markets. The main focus of PODS research has been on the incremental performance of
airlines when some or all of them implement different forms of revenue management. See, for example, Lee (1998), Zickus (1998), Gorin (2000), and Carrier (2003). Many different parameters can be changed to test different hypotheses within the simulation. This section describes the PODS simulator by giving a brief description of its architecture, the simulation mechanism, and simulation environment.
There are essentially four models within the PODS system architecture: the passenger choice model, revenue management, forecaster, and historical booking database. All four of these components are linked in the simulator. Figure 2-1 graphically displays the four models and the linkages between the models.
PASSENGER CHOICE MODEL PATH/CLAS AVAILABILIT PATH/CLASS BOOKINGS/ CANCELLATION S Y REVENUE MANAGEMENT -1 OPTIMIZER CURRENT FUTURE BOOKINGS
j
BOOKINGS FORECASTER UPDATE HISTORICAL BOOKINGS HISTORICAL BOOKING DATA BASEFigure 2-1: Basic PODS System Structure (Courtesy of Hopperstad)
PODS begins at the passenger choice model. Passengers are generated stochastically based on input parameters, such as mean demand by origin-destination. These generated passengers can be of two types: business or leisure. PODS generates path preferences for passengers based on passenger type and the input parameters. Each passenger has a choice set with a descending preference of itinerary.
Again, the passenger choice model is of paramount importance to PODS and in making it much more sophisticated than other airline simulations. The following is a brief description of the model, however Lee (1998) provides a nice detailed description of the passenger choice model. The passenger choice model uses input parameters, such as disutilities and willingness-to-pay to formulate the choice set of a simulated passenger. The first step is to generate disutility costs, favorite airline choice and the decision window of a specific passenger. Then, a maximum willingness-to-pay (WTP) is generated. Next, a total perceived cost is calculated for each option accounting for the disutility costs and fare. Finally, the model attempts to assign passengers to available
seats on itineraries within the choice set of the simulated passenger, starting with the most preferred itinerary.
The revenue management model is used next. While simulated passengers are using their choice set to inquire about specific itineraries, the revenue management model, which may use a different algorithm for each airline, determines whether or not to accept the itinerary and book it or not. The decision to accept or reject the itinerary request is based on the booking limits that are formulated and set by the revenue management algorithm. This topic is examined further in the next section. The forecaster and historical database are used so that booking limits are calculated by incorporating some forecasting method, which is influenced by historical bookings. If the RM system deems the itinerary unavailable, then the passenger may try his or her next choice, but if the RM system accepts the request then it is booked and the availability is adjusted to reflect the booking.
This process is repeated for every simulated passenger in PODS. After a certain interval of time, known in PODS as a "timeframe", the current bookings in the revenue management model are reported to the forecaster. The forecaster then adds that data to the historical database and a new forecast is generated from the updated historical data. The new forecast is used to reset booking limits and bid prices.
The above process, called a "sample" is repeated many times to generate a large enough sample to obtain statistical significance. The standard number of samples in a "trial" is 600. Furthermore, one "run") consists of five trials. Among the 600 samples per trial, the first 200 are known as "bums". These samples are only used to develop the historical database to develop a forecast. Therefore, a single "run" normally consists of 2000 samples, but this is a variable parameter.
2.3 Revenue Management
Airline revenue management is essentially a form of inventory control used by airlines to manage and control the sale of airline seats in a market so that seats are protected for
travelers that are willing to pay for them. Fare class yield management (FCYM) is a rather widely used revenue management approach. Seats are controlled on a leg basis, which is in contrast to newer OD control algorithms that manage inventory by market/path. For example, let us say an airline offers fares in the SFO-BOS market, but all flights connect through MSP. Using FCYM seats on SFO-MSP flights and seats on MSP-BOS flights would be controlled and demand forecasted independently. However, using OD control, demand would be forecasted and/or inventory would be controlled on the SFO-BOS market level. These newly developed algorithms are complex and require
substantially more computing power and data, hence only a handful of the world's largest airlines currently use these systems. Many airlines still use FCYM as their primary method of inventory control. However, the advances in computing power and the relative limitations of FCYM have led an increasing number of airlines to explore the possibility of implementing OD control systems.
As stated above, FCYM is a leg-based approach. It does not differentiate between local passengers and connecting passengers on a flight leg in an airline network. The availability of a certain fare class is calculated independently over every leg. This is a limitation of the leg-based model because the specific booking class must be available on all legs to book a multi-leg itinerary. This can result in a sub-optimal solution for maximizing revenues over a hub and spoke network. See Belobaba (1998) for a more detailed explanation.
In this study PODS will use four different revenue management algorithms. Expected marginal seat revenue method (EMSRb) is used as the aforementioned FCYM method. Heuristic bid price (HBP), displacement adjusted virtual nesting (DAVN), and probabilistic bid price (ProBP) are the three OD control methods. This section briefly discusses each of the four methods. A more detailed description of the first three methods with examples can be found in Lee (1998). The formulation of ProBP can be found in Bratu (1998).
2.3.1 Fare Class Yield Management (FCYM) Using an Expected
Marginal Seat Revenue (EMSRb) Algorithm
Belobaba (1987) developed the EMSR model and EMSRb followed in 1992. This is considered to be the base case for most of the simulations run for this study. It is a leg-based inventory control revenue management algorithm that uses EMSRb to optimize the seat inventory and availability of fare classes. It is a nested, top-down approach, meaning that a protection level (booking limit) is set for Y, the highest fare class, then B, the next highest, and so on until all inventory has been allocated to a fare class. Specifically, the expected marginal revenue of a seat is the expected revenue from selling that seat given the probability density function of the flight leg demand forecast. Given the forecast, EMSRb sets a booking limit for each fare class in a top-down fashion as mentioned above so that the expected marginal value of the last seat of the higher protecting fare class is less than the next lower class's fare. Wei (1997) provides a more detailed explanation and calculation of the EMSR curve.
EMSRb is a very common RM algorithm in the industry. Since it is a leg-based revenue management algorithm, forecasting, optimization and control are all calculated on each leg independently. This implies that in order to book a multi-leg itinerary in
Q
class, each leg must have availability inQ
to book the itinerary. This may not be revenue maximizing if, for example, there is only 1 seat left on leg 1, but leg 2 has plenty of availability. If the Y fare for leg 1 only is $300 but the Y fare for the connection is $500, then the last seat on leg 1 should be held for a connecting passenger who will pay $500. However, if the first passenger to request an itinerary is the local passenger for leg 1 only, the revenue management control will allow the booking to take place because it does not differentiate between the local and connecting passenger. An OD control algorithm can recognize this difference.FCYM based on the EMSRb algorithm is significant because of its wide usage. It also provides a departure point, as it is easy to differentiate between its implementation as the optimizer for FCYM and the OD control methods. Thus, EMSRb provides a base case for this study, so that the incremental benefit of OD control can be examined.
2.3.2 Heuristic Bid Price (HBP)
Heuristic bid price is also known as Greedy Virtual Nesting (GVN) with EMSR Heuristic Bid Price. It is very similar to GVN, which is described in Lee (1998). Belobaba (1998) outlines the HBP method. There are two main differences between EMSRb and HBP. First, the evolution from EMSRb to GVN encompasses the change in booking class definition. In EMSRb the booking classes are the actual published fare classes. In GVN the booking classes are "virtual" classes, so bookings are mapped into virtual classes. The advantage of this is that GVN always favors the highest fare passengers, hence the name "greedy". Forecasting and seat inventory control are still performed on a leg basis. These virtual classes are present in the HBP algorithm as well. They are a constant set as an input parameter in PODS. Currently, the upper bounds of each virtual bucket are set so as to have demand-equalized buckets. Second, HBP uses a different optimization and availability control methods. Again, HBP uses the virtual class concept and its forecasting is also done on a leg basis. Furthermore, for local paths HBP uses EMSRb booking limits. However, for connecting paths, HBP uses a bid price method instead of using EMSR booking limits, although the EMSR value of the last seat available on a leg is used as part of the method's calculation. The bidprices for a connecting path are calculated as follows:
BPC, legi = EMSR1 + d-factor * EMSR2
BPC, leg2= EMSR2 + d-factor * EMSR1
where EMSR1 is the critical expected marginal seat revenue on leg 1
EMSR2 is the critical expected marginal seat revenue on leg 2
d-factor is the displacement factor coefficient
Each of these decision rules is a weighted sum of the EMSR values of the two legs in question of the connecting itinerary. One of the legs is weighted with a d-factor, which is
a displacement coefficient used to add a penalty on to connecting itineraries essentially swaying the algorithm to accept more local bookings instead of low-fare connecting paths. To summarize, an incremental booking is accepted if:
FARE > MAX[BPc, legi , BPc, leg2]
where: BPc, legi is the bidprice for leg 1
BPc, leg2 is the bidprice for leg 2
The EMSR values, which calculate the bid price, are re-optimized every 200 bookings in PODS.
The main benefit of HBP is that an airline can still use its leg-based forecaster and database. HBP is easier to implement than complete OD control methods given that an airline already uses FCYM.
2.3.3 Displacement Adjusted Virtual Nesting (DAVN)
Displacement Adjusted Virtual Nesting uses a deterministic network linear program (LP). A discussion network displacement concepts can be found in Wei (1997). The LP generates shadow prices for each leg and each departure using an Origin-Destination Fare class (ODF) forecast. The actual fare and the shadow price are used to calculate a "pseudo-fare". This calculation implies that DAVN will not unconditionally favor connecting passengers, but instead considers the displacement of a passenger on the second leg before accepting a connecting passenger. The calculation for a connecting itinerary follows:
PFiegi = Fareegi - shadow priceleg2 PFIeg2 Fareleg2- shadow price foregi
The shadow price can be interpreted as the displacement cost, potential revenue lost by accepting a connecting passenger, of the connecting itinerary. Finally, the pseudo-fares are mapped into virtual classes and leg-based EMSRb is used for seat inventory control. Unlike HBP, the virtual buckets in DAVN are not constant, but the virtual bucket bounds are initially set and then redefined at every timeframe. Re-optimization of the LP occurs at the start of every timeframe, which produces new shadow prices and pseudo-fares that are optimized on a leg basis.
To recap, DAVN uses a LP that generates shadow prices for each leg, which are then used to calculate pseudo-fares for each ODF. A connecting itinerary is calculated by subtracting the shadow price of leg 2 from the leg 1 fare. The pseudo-fare is mapped to a virtual class, and the booking limits of the virtual classes are calculated using EMSRb. An airline using DAVN controls its seat inventory by leg, but uses OD path data for forecasting and database.
2.3.4 Probabilistic Bid Price (ProBP)
Probabilistic Bid Price is the final method examined in this study. It is a recently developed revenue management method having been formulated and initially tested in PODS by Bratu (1998). It uses a bid price method to perform inventory control. The main difference between it and HBP is that ProBP calculates the bid price for each leg in an OD path in the following way. The fare of the ODF multiplied by the critical EMSR value of the leg is divided by the sum of the critical EMSR values of all legs in the ODF space. In essence, the bid price is a pro-ration of the critical EMSR value, defined as the EMSR value of the last seat sold on a leg. From Lee (2000), mathematically it is defined as:
YmGL)EMSRc(m) # 0 -- PRF(j,k)= (EMSRc(k) * Fj) / (XmGjEMSRc(m))
where Lj is the set of all legs that traverse the ODF Fj is the actual fare of ODFj
PRF(j,k) is the prorated fare of ODFj on leg k EMSRc(m) is the critical EMSR value of leg m.
ProBP also uses a convergence model to correct for the overestimation of the critical EMSR value. It is an iterative model that is used because the EMSRb model uses the actual ODF fare when calculating the critical EMSR value, which overestimates it. ProBP re-optimizes every 200 bookings and repeats until the critical EMSR value converges within a $10 range, given a maximum number of iterations.
ProBP is a bid price method like that of HBP, but with some key differences. Its main difference is that the forecaster and database are leg-based in HBP, but they are calculated at the ODF level in ProBP. However, they are also both bid price methods as opposed to strict booking limits. While they both use path-based seat inventory control, the calculation of the inventory control is quite different. HBP uses a path-based control method that was described in the preceding pages. The formulation of ProBP presented directly above shows that the seat inventory control method for it is distinctly path-based using prorated critical EMSR values.
2.3.5 Summary
This section has presented the four main revenue management methods that will be used in the PODS simulation runs done for the purpose of this study. The main focus is on the incremental benefit of introducing OD control algorithms to replace FCYM. Thus EMSRb is a base case and sets the standard for the other algorithms' performance.
Each revenue management algorithm has three major specifications, namely the type of database and forecaster (leg or based), the type of inventory control (leg or path-based), and the method of calculating inventory control (booking limit or bid price). Table 2-1 below summarizes these specifications for each revenue management algorithm.
Revenue Management Database and Type of Control Method of Control
Algorithm Forecaster
EMSRb Leg-based Leg-based Booking limit
HBP Leg-based Path-based Bid price
DAVN Path-based Leg-based Booking Limit
ProBP Path-based Path-based Bid Price
Table 2-1: Summary of revenue management methods
2.4 Simulation Environment
The PODS simulator has been developed extensively and many new features have been added. Currently, there are three main networks in use for experimentation. These are known as Networks D, E, and R. This thesis only uses Network D because the focus of this study can be analyzed clearly using it alone.
2.4.1 Network D
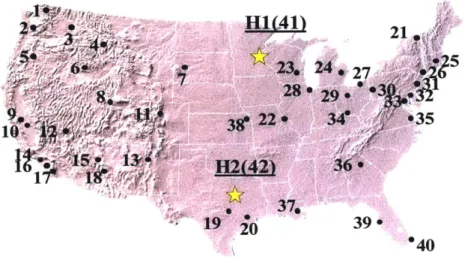
Network D is comprised of 252 legs and 482 markets. There are two airlines that fly from a hub (each airline has a different hub) to 40 spoke cities; 20 to the east of the hub and 20 to the west. This network most likely compares to the domestic United States market. A representative map of Network D appears below in Figure 2-2.
Figure 2-2: Representative Network D map
Network D introduced a competitive network of connecting flights on a large scale. The large scale leads to many more path options for simulated passengers, which is more representative of the real world. Each airline offers flights to all spokes from its hub thrice daily and all airplanes for both airlines have a capacity of 100. These facts, while having led to a number of interesting experiments and results, are also a limitation of the network because it is rather symmetric with respect to the two competing airlines. However, Network D has been well calibrated and provides very robust results for this
study.
2.5
The Fare Structure in PODS
A main portion of this study has to do with alternative fare structures. Fare structures will be discussed extensively in Chapter 3. However, upon describing PODS in this chapter, it would provide clarity to introduce the base fare structure used in PODS at this point.
The fare structure encompasses a set of fare classes. In our study, there are four fare classes: Y, B, M, and
Q.
Y represents the highest fare in a market andQ
the lowest fare.In the real world, some airlines may have 10 or more fare classes, but only four are used in this thesis because it still provides realism in revenue management. Since there are four fare classes in each market, each market will have four fares of which some or all of them may be available to prospective passengers depending on inventory control and advance purchase requirements.
2.5.1 Ticket Restrictions in The Base Case
Airlines differentiate their product by adding restrictions and advance purchase
requirements to certain fare classes. This may restrict some passengers from buying the lowest fare and instead purchasing a higher-fare ticket. This is one of the goals of
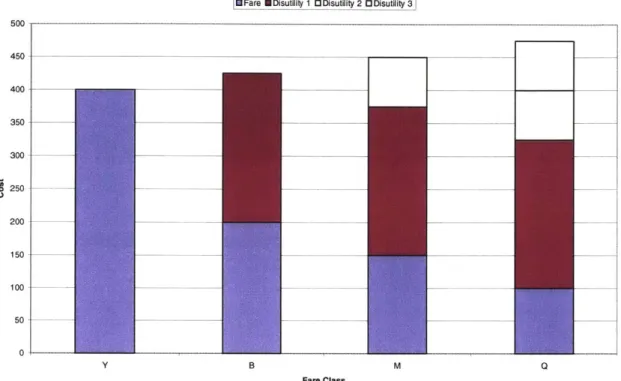
revenue management, to get passengers to pay as close to their maximum willingness-to-pay as possible. Likewise, PODS uses disutilities, discussed in Chapter 3, to formulate a generalized cost function so that tickets with restrictions will have an added "perceived" cost that may affect the choice set of a simulated passenger. The restrictions are placed on certain fare classes. Table 2-2 lists the restrictions and their real world counterpart.
PODS Disutility Real-World Equivalent
Disutility 1 Saturday night stay requirement
Disutility 2 Non-refundability
Disutility 3 Change fee
Table 2-2: PODS disutilities and equivalent restrictions
In addition to ticket restrictions there is an advance purchase requirement. However, before discussing advance purchase restrictions in PODS, a brief discussion of the cumulative booking curves in PODS is necessary as this defines the process as to how passengers approach the booking process over simulated time.
2.5.2 Booking Curves in PODS
The passenger booking process in PODS has 16 timeframes. The booking process commences at the equivalent of 9 weeks before departure. Each timeframe corresponds
to a specific number of days before departure. Table 2-3 displays the mapping of timeframes into the number of days before departure.
Timeframe 1 2 3 4 5 6 7 8 Days from 56 49 42 35 31 28 24 21 Dep. Timeframe 9 10 11 12 13 14 15 16 Days from 17 14 10 7 5 3 1 0 Dep.
Table 2-3: Timeframe mapping to days before departure
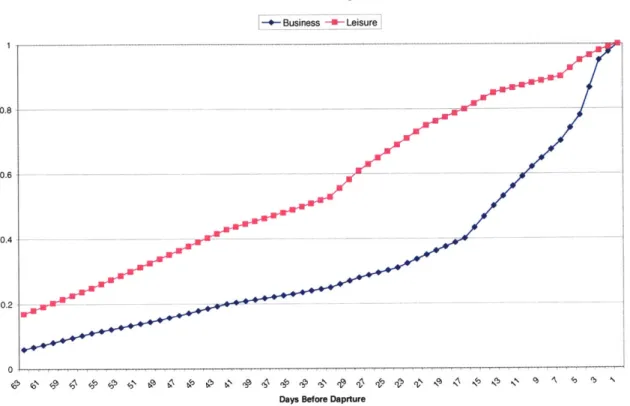
Bookings occur during each timeframe and revenue management forecasts are updated either at the beginning of every timeframe or after a specific number of bookings. Passengers are distributed to arrive at certain timeframes by the formulation of a cumulative booking curve. Two of these curves are parameters in PODS, one for business passengers and the other for leisure passengers. A graphical representation of the cumulative booking curves appears below in Figure 2-3.
As can be seen in the in Figure 2-3. Leisure passengers cumulatively book tickets much earlier than business passengers: 75 percent of leisure travelers book tickets at least 21 days in advance of departure, while only 35 percent of business travelers have booked tickets by that same time before departure. Furthermore, 30 percent of business travelers attempt to book travel within 7 days of departure.
PODS Cumulative Booking Curves
L9-Bsness
-- Leisure 0.8 0.6 0.4 0 r4l R4' 4P (11 4) 10 41 0 tl' Ib' !1 _I? 4 ' 4'C4'b "b "h NN 4 q, A'Days Before Daprture
Figure 2-3: PODS Cumulative Booking Curves
2.5.3 Advance Purchase Requirements in PODS
PODS also incorporates an advance purchase requirement in its fare structure. An advance purchase requirement forces the closure of a booking class at a specific time even if the RM system has seat availability in that class. Thus, last-minute passengers are forced into a choice set that only consists of high fare booking classes. Again, in PODS there are timeframes that can be translated into a specific number of days before departure. The advance purchase requirements typically used in our base case are shown in Table 2-4.
Fare Class Timeframe when Class Days before Departure Closes Y 16 0 B 12 7 M 10 14 Q 8 21
Table 2-4: Advance Purchase Requirements in Base Case
2.5.4 PODS Base Fare Structure
The fare structure incorporates the ticket restrictions and advance purchase requirements to differentiate the product of each booking class. The main focus of this thesis is to examine revenue management performance when the traditional fare structure, sometimes called the base fare structure, presented above is abandoned for an alternative fare structure that is characterized by a relaxation of some of these parameters that differentiate the booking classes. This base fare structure is presented in Table 2-5.
Fare Class Advance Restriction 1 Restriction 2 Restriction 3 Purchase (Sat. night stay (Non- (Change fee)
(timeframe) req.} refundable)
Y 16 (0 days) NO NO NO
B 12 (7 days) YES NO NO
M 10 (14 days) YES YES NO
Q
8 (21 days) YES YES YESTable 2-5: PODS base fare structure
2.6 Summary
This with
chapter briefly gave an introduction to PODS and revenue management. It began a general synopsis of PODS as well as the importance of it as a simulator and its
improvements against previous simulators. Then, a brief description of the PODS system structure was presented. The next section introduced the four revenue management algorithms that are used in this study. Next, the simulation environment, Network D, was introduced and an explanation of its components was given. Finally, the base fare
structure in PODS was explained
The next chapter will focus on disutilities and fare structures. It will provide a description of passenger disutilities, how some of these disutilities are used in fare structures, and a general economic overview of price differentiation. Also, the fare class restrictions and advance purchase requirements will be explained. Examples of fare structures will be provided and it will also give the disutility levels in PODS and how these disutility parameters affect passenger choice in PODS.
Chapter 3
Airline Fare Structures and Passenger Disutilities
Airline passengers are faced with many decisions when making a choice of flying in a specific market. There is a wide range of options available to them, which could include airline, routing, and time of departure. The final decision made by a passenger is not based solely on the monetary cost of the ticket, but also on the perceived costs from the unattractiveness of some of the features of that ticket. This level of unattractiveness of certain features of a ticket can be thought of as a disutility. While some of these disutility factors are not directly controlled by the airline, fare structures, set by airlines, and disutilities are related in that the structures of fares include, in many cases, the use of restrictions to increase the disutility of passengers, so that a passenger may buy a higher fare rather than face the restriction(s) of the lower fare. Along with examining the concepts of disutilities in this chapter, we will also discuss airline fare structures.
An overview of the economic theory of price differentiation is given in section 3.1. Section 3.2 introduces the concept of passenger disutilities. This introduction leads to an examination of the use of passenger disutilities in the development of airline fare structures in Section 3.3. Section 3.4 further develops the description of airline fare structures by looking at the role of advance purchase requirements. Section 3.5 briefly introduces structured fare ratios and market-based fares, and outlines the differences between the two. Finally, some real world examples of different fare structures of competing airlines in specific markets are described in Section 3.6. Section 3.7 provides a chapter summary.
3.1 An Economic Overview of Differential Pricing
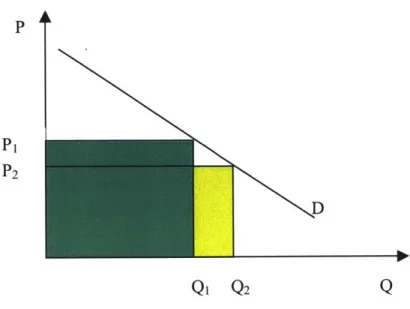
The principles of airline revenue management and the fare structures used by most network air carriers today are based on the economic theory of differential pricing. This is very closely related to price discrimination. As stated above, one of the main goals of differential pricing is to get passengers to pay a fare that is closer to their maximum willingness-to-pay and to stimulate more demand that otherwise wouldn't fly if only one uniform fare existed in a market. In pursuing this goal the airlines earn more revenue, and the formal goal is to maximize profit using revenue management. The first part of this section discusses price discrimination, as it is the precursor to differential pricing and revenue management. Then, an economic overview of differential pricing is given with an example of how charging more than one price to different market segments will increase revenues.
3.1.1 Price Discrimination
According to Tirole (1988) price discrimination can be divided into three separate categories known as the three degrees of price discrimination. They represent three cases where firms attempt to charge different prices of an identical good to different people or groups. This subsection briefly examines all three degrees for background to airline price differentiation. A much more thorough theoretical discussion of price discrimination appears in Tirole (1988). Also, see Phlips (1983) for a very detailed book pertaining
solely to the economics of price discrimination.
The first degree of price discrimination is also known as perfect price discrimination. It occurs in rare instances and usually when consumers are facing a monopolist. In this case, suppose that each consumer has some maximum willingness to pay w. Then, the firm lets price p = w and the firm captures the entire consumer surplus. Each consumer pays his or her maximum willingness to pay.
The second degree of price discrimination is a little bit more common than the first, but is more complex theoretically. In this case, there are heterogeneous consumers, which can
be offered specific bundles of goods that meet their needs and tastes individually. Some most common examples of this type of price discrimination are two-part tariffs, where there is some fixed premium and then a variable usage cost. For example, most consumers of mobile telephones are charged a fixed monthly fee for service and then are charged a variable per minute rate for phone usage over that month. Another example is a tie-in sale where one buys a product that requires some complementary product and that complementary product must be purchased from the same company that produced the original product. For example, if a consumer buys a computer printer from a company, then the consumer must also buy printer ink cartridges that are produced only by the
same company that produced the printer.
Finally, the third degree of price discrimination deals with the segmentation of demand. This concept drives price differentiation in the airline industry. A company produces a single product and knows that its aggregate demand can be divided into groups or segments of demand. In the case of the airline industry the most common market segmentation is that of business and leisure travelers. The company will offer different prices to the different market groups it identified in an effort to maximize profit. According to Tirole (1988), "Optimal pricing implies that the [firm] should charge more in market [segments] with the lower elasticity of demand." This is also essentially what airlines attempt to do. However, the third degree of price discrimination differs slightly from airline differential pricing. The theory of price discrimination implies that the firm cannot discriminate within a market group. Airlines, on the other hand, will charge different prices to those in the same market segment of demand if the opportunity to do so arises.
3.1.2 Differential Pricing
As stated above, differential pricing is, or is very similar to, third degree price discrimination. Demand is segmented into specific groups. Each of these groups has different price sensitivities. The easiest way to describe differential pricing is with an example. A more comprehensive treatment of differential pricing, as well as the source of the following example, can be found in Daudel and Vialle (1994).