Analysis and Characterization of Slab-Coupled Optical
Waveguide Amplifiers and Lasers
by
William Loh
S.B., University of Michigan (2007)
Submitted to the Department of Electrical Engineering and Computer Science in Partial Fulfillment of the Requirements for the Degree of
Master of Engineering in Electrical Engineering and Computer Science
At the
ASSACHUSEMTS ISOF TECHNOLOG
Massachusetts Institute of Technology
SEP 3 0 200
September 2009
LIBRARIE
@2009 William Loh, MMIX. All rights reserved.
The author hereby grants to MIT permission to reproduce and distribute publicly paper and electronic copies of this thesis document in whole or
in part in any medium now known or hereafter created
ARCHNVES
Author
Departrjent of Electrical Engineering and Computer Science
Certified by
V(T
Assistant Group Leader,
Certified by
Associate Director,
Accepted by
Paul W. Juodawlkis
Group 83, MIT Lincoln Laboratory
Thesis Supervisor
Rajeev J. Ram
Professor of Electrical Engineering
Thesis Co-Supervisor
/
d
Terry P. Orlando
Chairman, Department Committee on Graduate Theses
Analysis and Characterization of Slab-Coupled Optical Waveguide Amplifiers and Lasers by
William Loh
Submitted to the
Department of Electrical Engineering and Computer Science September 3, 2009
In Partial Fulfillment of the Requirements for the Degree of Master of Engineering in Electrical Engineering and Computer Science
Abstract
Semiconductor optical devices are important in the photonics industry due to their significant advantages in size, weight, and power consumption (SWAP) and to their capability for photonic integration. However, these devices traditionally suffer from low fiber coupling efficiency and have been limited to relatively low power applications. This thesis explores the potential of the slab-coupled optical waveguide (SCOW) semiconductor gain medium for use in high power optical amplifiers and external cavity lasers. The thesis begins by introducing the SCOW concept and describing the benefits of utilizing a low optical confinement design for high power operation. Detailed analysis and measurements of the output power, gain, and noise properties of slab-coupled optical waveguide amplifiers (SCOWAs) and slab-coupled optical waveguide external cavity lasers (SCOWECLs) are also presented. It will be shown that these devices not only exhibit Watt class output power with high coupling efficiency (> 90 %) but also demonstrate the capability for low noise operation.
Thesis Supervisor: Dr. Paul W. Juodawlkis Title: Assistant Group Leader Group 83 Thesis Supervisor: Rajeev J. Ram
Title: Associate Director, MIT Research Laboratory of Electronics
Acknowledgements
The completion of a thesis is truly a challenging endeavor, one that cannot possibly be accomplished without the support of many people. First, I am grateful to my advisor, Dr. Paul Juodawlkis. Thank you for your encouragement and warm support throughout the completion of this work. Your extensive knowledge on semiconductor devices and overwhelming enthusiasm in the field was truly inspirational. Through our fruitful discussions, I have learned far more in the course of two years than I would have ever hoped to learn. I am also grateful to my co-advisor, Professor Rajeev Ram. Thank you for the stimulating discussions we had during and after group meetings. Your active encouragement in student learning and your willingness to share knowledge has helped me overcome numerous challenges. Thank you to Fred O'Donnell and Jason Plant. Your help and involvement in my project was what made all of this work possible. Thank you to Jonathan Klamkin. I enjoyed and learned a lot from many of the active discussions we shared. I would also like to express my gratitude to many of the students in Rajeev's laboratory. Thank you to Jason Orcutt and Harry Lee. Your advice and support helped tremendously in guiding me through the past two years. Thank you to Kevin Lee, Reja Amatya, Parthi Santhanam, Evelyn Kapusta, and Shireen Goh. Your kindness in regarding me as a member of the group made me feel always welcome at the laboratory. Finally, I would like to express my gratitude to my loving family. Thank you to Hai-Yu Loh, Cindy Loh, and Jonathan Loh. Your encouragement throughout my life is what made all of this possible.
Content
1 Introduction 14
1.1 Slab-Coupled Optical Waveguide (SCOW) Overview 15
1.2 Slab-Coupled Optical Waveguide Amplifier (SCOWA) 17
1.2.1 SCOWA Operational Principles 17
1.2.2 SCOWA Gain 18
1.2.3 SCOWA Saturation Output Power 19
1.2.4 SCOWA Gain Bandwidth 20
1.2.5 SCOWA Polarization Dependence 20
1.3 Optical Amplifier Noise Figure 21
1.3.1 Noise Figure Definition 21
1.3.2 Noise Figure Theory 23
1.3.3 Alternative Noise Figure Expression 26
1.3.4 Analysis of Noise Figure Equation 28
1.4 Slab-Coupled Optical Waveguide External Cavity Laser (SCOWECL) 29
1.4.1 SCOWECL Relative Intensity Noise (RIN) 29
1.4.2 SCOWECL Linewidth 31
1.5 Slab-Coupled Optical Waveguide Device Applications 33 1.5.1 Slab-Coupled Optical Waveguide Amplifier Applications 34 1.5.2 Slab-Coupled Optical Waveguide Laser Applications 36 1.5.3 Slab-Coupled Optical Waveguide Photodiode Applications 37
1.6 Thesis Overview 37
2 SCOWA Measurements 38
2.1 Packaged SCOWA Device Measurements 39
2.1.1 Current-Voltage Characteristics 39
2.1.2 SCOWA Gain Spectra 40
2.1.3 SCOWA Gain Saturation Measurement 42
2.1.4 SCOWA Electrical-to-Optical Conversion Efficiency 43
2.1.5 SCOWA Polarization Sensitivity 45
2.2 Noise Figure Optical Measurement 47
2.2.1 Interpolation Source-Subtraction Theory 47
2.2.2 Noise Figure Optical Measurement System 49
2.2.3 Noise Figure Optical Measurement Calibration 50
2.2.4 Noise Figure Optical Measurement Results 57
2.3 Noise Figure Electrical Measurement 59
2.3.1 Noise Figure Electrical Measurement Theory 60
2.3.2 Noise Figure Electrical Measurement System 62
2.3.3 Noise Figure Electrical Measurement Results 63
2.4 Population Inversion Factor of Packaged SCOWA 64
2.4.1 Population Inversion Factor from Noise Figure Measurement 65 2.4.2 Population Inversion Factor from IV Measurement 65
2.4.3 Comparison and Discussion of Results 69
2.5 Summary 71
3 SCOWECL Measurements 73
3.1 Use of SCOWECLs in Analog Optical Links 73
3.2 SCOWECL Components 75
3.2.1 Double-Pass SCOWA 76
3.2.2 Fiber Bragg Grating 85
3.2.3 Lensed Fiber 95
3.2.4 Isolator 96
3.3 Impact of Fiber Bragg Grating Reflectivity 97
3.3.1 SCOWECL L-I Measurements 97
3.3.2 SCOWECL RIN Measurements 102
3.3.3 SCOWECL Linewidth Measurements 108
3.4 Packaged SCOWECL Characterization 113
3.5 SCOWECL Modeling 117
3.5.2 SCOWECL Linewidth Modeling 122
3.6 Summary 123
4 Conclusions and Future Work 124
4.1 Summary 124
4.2 Future Work 125
4.2.1 SCOWA Population Inversion Factor 125
4.2.2 Double-Pass SCOWA Gain Spectra 125
4.2.3 Double-Pass SCOWA Noise Figure 126
4.2.4 SCOWECL Intra-Cavity Loss 126
4.2.5 SCOWLs with Monolithic Gratings 127
4.2.6 Polarization Insensitive SCOWAs 127
A Erbium Doped Fiber External Cavity Laser 129
A. 1 Erbium Doped Fiber External Cavity Laser Operation 130
A.2 Erbium Doped Fiber SCOWECL Test Results 131
A.3 Erbium Doped Fiber SCOWECL Performance Analysis 134
Figure 1-1: Figure 1-2: Figure 1-3: Figure 2-1: Figure 2-2: Figure 2-3: Figure 2-4: Figure 2-5: Figure 2-6: Figure 2-7: Figure 2-8: Figure 2-9: powers.
List of Figures
Slab-Coupled Optical Waveguide Cross Section. Noise Figure Schematic.
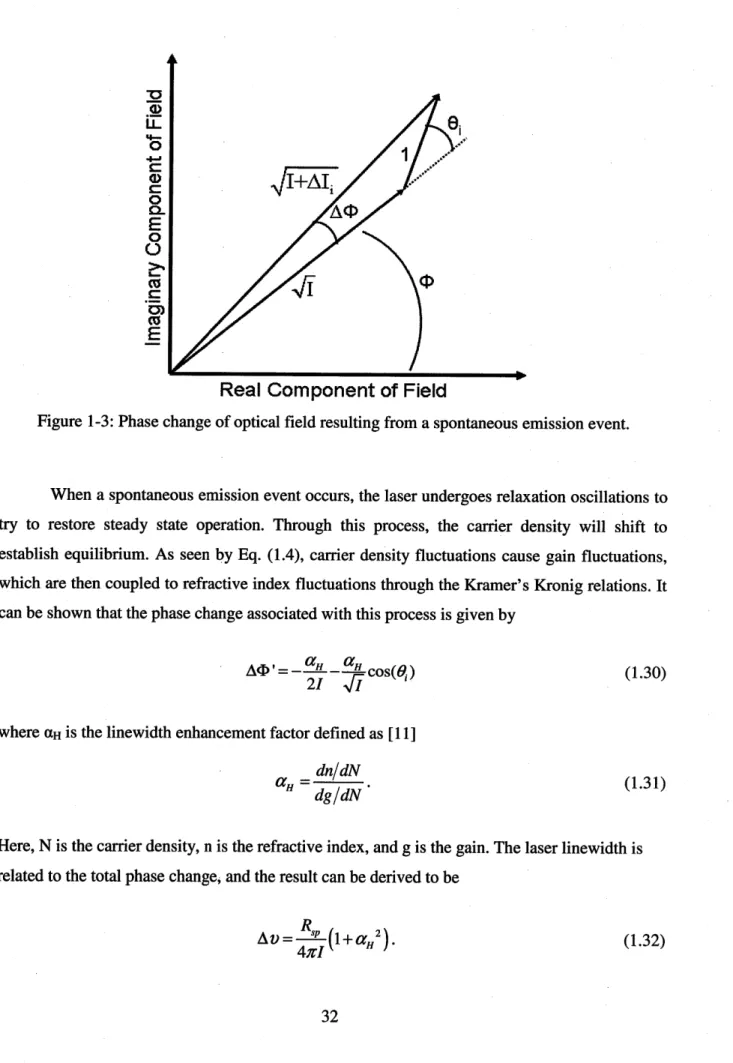
Phase change of optical field resulting from a spontaneous emission event.
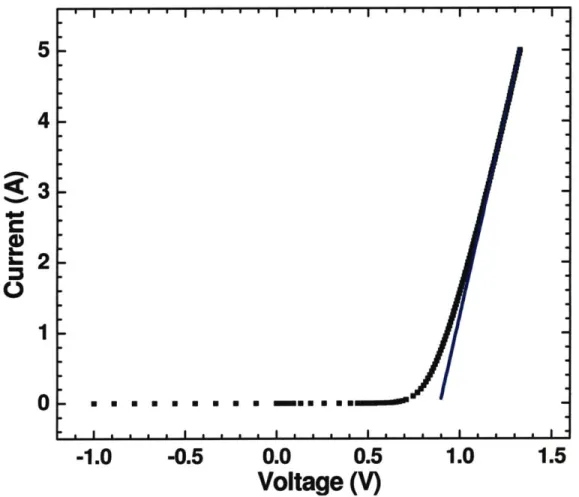
Packaged SCOWA current versus voltage showing measured characteristics (solid squares) and best fit line (solid line).
Operating conditions: X = 1550 nm, T = 16 0. Best fit line: V =
0.08737*"1 + 0.8912 (V).
Gain Spectra measurement setup for SCOWA.
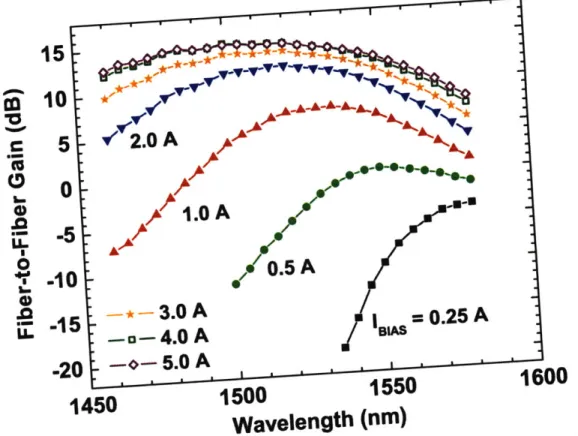
Packaged SCOWA Gain Spectrum for Various Bias Currents. The SCOWA was operated at T = 16 °C.
Packaged SCOWA Gain Saturation at 1 A (upright triangles), 2 A (inverted triangles), 3 A (stars), 4 A (open squares), and 5 A (open diamonds) bias currents. The SCOWA was operated at X = 1540 nm, T = 16 'C.
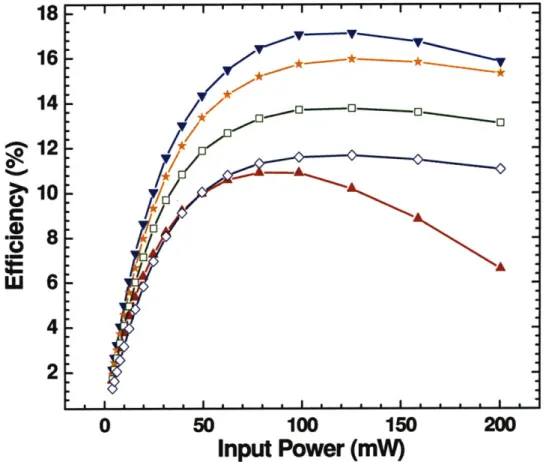
Packaged SCOWA Electrical-to-Optical Efficiency at 1 A (upright triangles), 2 A (inverted triangles), 3 A (stars), 4 A (open squares), and 5 A (open diamonds) bias currents. The SCOWA was operated at X = 1540 nm, T = 16 'C.
Polarization Sensitivity Measurement Setup.
Optical and Electrical Noise Figure Measurement Setups. Illustration of Output Loss Concept.
Calibration Ratio between OSA and Power Meter at 1550 nm. The extrapolated best fit line is OSA = 0.73*PM + 0.494 (nW) where OSA and PM designate the measured OSA and power meter
16 22 32 40 41 41 42 44 45 49 51 53
Figure 2-10: Figure 2-11: Figure 2-12: Figure 2-13: Figure 2-14: Figure 2-15: Figure 2-16:
Calibration Ratio between OSA and Power Meter across various wavelengths. The extrapolated best fit line is OSA = 0.717*PM where OSA and PM designate the measured OSA and power meter powers.
Noise Figure of packaged SCOWA for currents 0.25 A - 5 A and wavelengths 1460 nm - 1580 nm The SCOWA was operated at T = 16 oC.
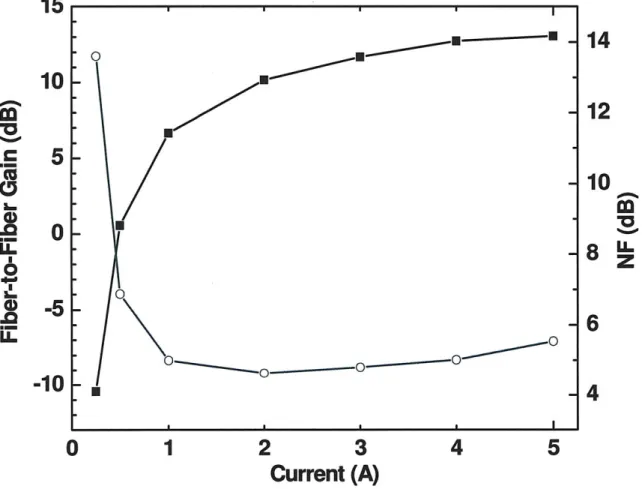
Packaged SCOWA Fiber-to-Fiber Gain (squares) and Noise Figure (open circles) as a function of current. The SCOWA was operated at X = 1550 nm and T = 16 oC.
RIN Transfer Standard test setup.
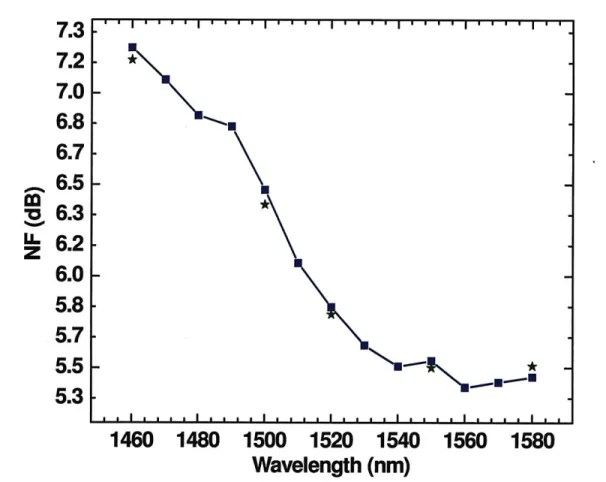
Packaged SCOWA noise figure measured using optical technique (squares) and electrical technique (stars). The SCOWA was
operated at T = 16 OC.
Plot of nsp as a function of wavelength for IBIAS = 0.25 A calculated
using noise figure measurements (circles) and IV measurements (solid line).
Plot of nsp as a function of wavelength for IBIAs = 0.50 A calculated using noise figure measurements (circles) and IV measurements
Figure 2-17:
Figure 2-18:
Figure 2-19:
(solid line).
Plot of nsp as a function of wavelength for using noise figure measurements (circles) (solid line).
Plot of nsp as a function of wavelength for using noise figure measurements (circles) (solid line).
Plot of nsp as a function of wavelength for using noise figure measurements (circles) (solid line). IBIAS = 1 A calculated and IV measurements BIAs = 2 A calculated and IV measurements IBIAs = 3 A calculated and IV measurements
:-Figure 2-20: Figure 2-21: Figure 2-22: Figure 3-1: Figure 3-2: Figure 3-3: Figure 3-4: Figure 3-5: Figure 3-6: Figure 3-7: Figure 3-8:
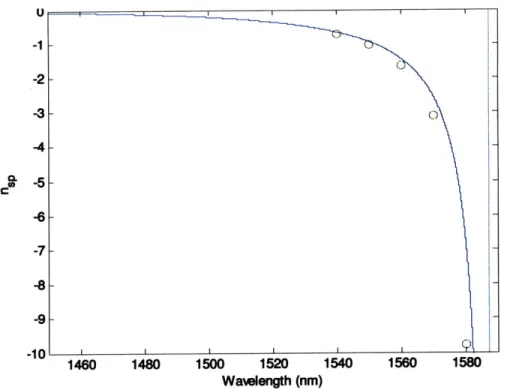
Plot of nsp as a function of wavelength for IBIAS = 4 A calculated using noise figure measurements (circles) and IV measurements (solid line).
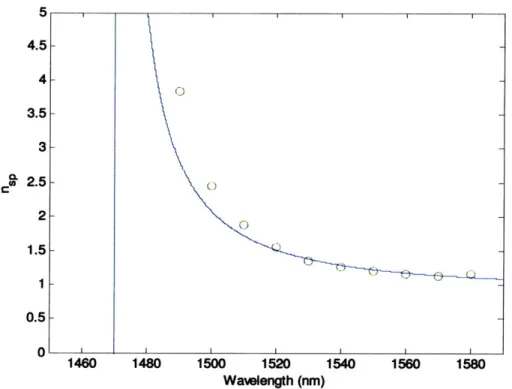
Plot of nsp as a function of wavelength for IBtAs = 5 A calculated using noise figure measurements (circles) and IV measurements (solid line).
Figure 2-22: Population inversion factor at 5 A calculated using noise figure measurements accounting for (solid circles) and neglecting (open circles) carrier dependent loss effects. The population inversion factor calculated from IV measurements (solid line) is also shown.
Slab-Coupled Optical Waveguide External Cavity Laser Schematic. Measured (a) L-I and (b) I-V characteristics of double-pass SCOWA. The TEC temperature was maintained at 16 oC.
Measurement setup for the gain characteristics of the double-pass
SCOWA.
Double-pass SCOWA gain characteristics as a function of current and wavelength. The gain curves for 1 A (squares), 2 A (diamonds), 3 A (upright triangles), and 4 A (inverted triangles) are shown. The gain peak wavelength (solid line) and operating wavelength (dashed line) are also illustrated.
High-resolution spectrum for the amplified power out of the double-pass SCOWA.
Test Setup for Cutback Measurements.
Measured (a) internal loss and (b) injection efficiency determined from cutback measurements performed on five samples of SCOWL lasers.
Normalized reflectivity spectrum of 20% FBG. The reflectivity was measured to be 22.4 %, and best fit Gaussian curve to the measurement yields a full-width-half-maximum of 19.9 pm.
Figure 3-9: Figure 3-10: Figure 3-11: Figure 3-12: Figure 3-13: Figure 3-14: Figure 3-15: Figure 3-16: Figure 3-17: Figure 3-18:
Plot of FBG transmission as a function of wavelength for a 5 % reflectivity FBG. The transmission at the peak reflection wavelength is extrapolated to be 96 %.
Illustration of (a) optical backscatter reflectometer measurement of a 20% reflectivity FBG and (b) residual grating length beyond photomask.
Plot of the FBG tuning measurement performed on 5 % grating. The reflectivity spectrum with zero applied voltage (solid squares) and 1000 V applied (open circles) is illustrated. The wavelength shift of the spectrum peak is 1.08 nm. Only the ends of the FBG were epoxied down onto the piezo actuator.
Graph of FBG tuning measurement with the entire grating length epoxied down onto the piezo actuator. The reflectivity spectrum with zero applied voltage (solid squares) and 1000 V applied (open circles) is illustrated.
Measurement of piezo actuator hysteresis effect. The initial FBG reflectivity spectrum (solid squares), spectrum after one voltage ramp (open circles), and spectrum after two voltages ramps (open triangles) are illustrated.
Mode field profile of lensed fiber mode.
L-I curves for 10 % (open circles) and 20 %(solid squares) reflectivity fiber Bragg grating SCOWECLs. The laser was maintained at 16 'C.
L-I comparison of lensed fiber (open circles) and butt-coupled (solid squares) SCOWECLs. The lasers were maintained at 16 oC
over the current sweep.
Electrical-to-Optical conversion efficiency for 10 % (open circles) and 20 % (solid squares) grating SCOWECLs as a function of current bias. The laser was operated at 16 0C.
Low and high frequency laser RIN measurement system.
88 90 92 93 94 95 98 100 101 102
i-:l-(--l-i"~i---;'i-Figure 3-19: Figure 3-20: Figure 3-21: Figure 3-22: Figure 3-23: Figure 3-24: Figure 3-25: Figure 3-26: Figure 3-27:
Low frequency RIN spectrum for 10 % (open circles) and 20 % (solid squares) FBG SCOWECLs. The shot noise RIN is indicated by the horizontal line. The laser was operated at 4 A bias and maintained at a temperature of 16 'C. The photodiode current in both cases was - 35 mA.
Plot of the high frequency RIN for (a) 10 % and (b) 20 % FBG SCOWECLs. The shot noise RIN level is indicated in each case with a horizontal line. Photocurrents of 7 mA in (a) and 6 mA in (b) were used to derive the shot noise levels. The laser was operated at 4 A bias and maintained at a temperature of 16 oC in both trials.
High frequency RIN spectrum of 20 % SCOWECL for long time delay between laser alignment and measurement. The horizontal line is the shot noise RIN. The laser was operated at 4 A bias and maintained at a temperature of 16 *C. The photodiode current was approximately 6 mA.
Delayed self-heterodyne linewidth measurement setup.
Delayed self-heterodyne spectrum of 10 % (open circles) and 20 % (solid squares) reflectivity SCOWECL. The laser was operated at 4 A bias and maintained at a temperature of 16 'C.
Top-down view of packaged SCOWECL. Close-up view of mounted SCOWA.
High frequency RIN spectrum of Nortel Networks laser. The horizontal line is the shot noise RIN. The laser was operated at 220 mA bias and maintained at a temperature of 16 *C. The photodiode current was approximately 5 mA.
Fiber Bragg grating tuning characteristics for piezo biases of 0 V (solid circles), 200 V (open circles), 400 V (solid triangles), 600 V (open triangles), 800 V (solid squares), and 1000 V (open squares). The laser was operated at 4 A bias and maintained at 16 oC during
the measurement. 104 106 107 109 112 113 114 116 117
Figure 3-28: Figure 3-29: Figure 3-30: Figure A-1: Figure A-2: Figure A-3: Figure A-4:
Theoretical fit to measured SCOWA gain. The determined best fit
parameters are (g)0 = 0.469 cm', Is = -0.696 A, and It = 0.713 A,
and ao = -0.237 cm- .
Plot of measured (open circles) and simulated (solid line) L-I characteristics for a 20 % reflectivity grating SCOWECL. The dashed line represents the theoretical L-I without two photon absorption effects.
Schawlow-Townes Linewidth as a function of output power for 20 % FBG SCOWECL.
Schematic of Erbium-doped fiber SCOWECL design.
Illustration of the intensity, absorption, and refractive index profiles created by the saturable absorber effect in the Erbium-doped fiber.
X is the lasing wavelength, and n is the fiber refractive index.
Loss measurements of Erbium-doped fiber at 1550 nm as a function of length. The best fit line to the data results in a slope of 7.021 dB/m and a zero length intercept of 0.045 dB.
L-I characteristics of erbium-doped fiber external cavity laser measured during a forward current sweep (solid squares) and backward current sweep (open circles). The TEC temperature was maintained at 16 'C. 120 121 122 129 130 132 133 _
List of Tables
Table 2-1: Polarization extinction ratio measurements at 1460 nm, 1510 nm, and 1550 nm. The packaged SCOWA was operated at 5 A current
bias and thermo-electrically cooled at 16 oC. 46
Table 3-1: Circulator loss calibration for ports 1 and 2. 79
Table 3-2: L-I comparison between 10 % and 20 % FBG SCOWECLS. 99
Table 3-3: Linewidth fits to 10 % and 20 % grating SCOWECLs for a current
bias of 4 A. 112
Table 3-4: Summary of packaged SCOWECL output power, relative intensity noise, and linewidth performance. The laser was operated at 4 A
Chapter 1
Introduction
Currently, many applications in optical communications employ fiber lasers and doped fiber amplifiers due to their many favorable characteristics for signal transmission and regeneration. Erbium doped fiber amplifiers (EDFAs), in particular, are prevalent in the C-band operation regime (1530-1570 nm) where signal transmission at 1550 nm allows for low attenuation through optical fiber. Here, EDFAs can be optimized to offer the advantages of low noise amplification [1, 2], high gain [1, 2], large saturation output powers [2, 3], and polarization insensitive amplification within the amplifier passband. However, EDFAs suffer from their intrinsically narrow gain bandwidth (-32 nm) in which they can effectively amplify signals [4]. Furthermore, doped fiber lasers and amplifiers have relatively small gain per unit length. This leads to doped fibers of very long lengths (-10-60 m for C-band EDFAs) in order to achieve significant gain. As such, fiber lasers and amplifiers typically are inefficient in terms of size, weight, and power (SWAP). Another disadvantage of these active fiber devices is their reliance on additional components for system functionality. Fiber lasers and amplifiers, for example, require the use of laser pump sources and WDM multiplexers. These extra components increase the complexity of fiber based systems.
Lasers and amplifiers based on the semiconductor gain media, on the other hand, can allow for gain-bandwidths in excess of 100 nm [5]. This allows one SOA to potentially amplify multiple signals spread across a wide distribution range. Active semiconductor devices also have the large advantages in SWAP [6] with typical devices having chip sizes of 500 X 200 X 1000 pm. This allows for compact semiconductor based lasers and amplifiers to be realized at low cost. Furthermore, semiconductor technology allows the potential of photonic integration. With photonic integration, discrete semiconductor components can be joined together to realize the functionality of an entire system on a single chip [7]. In addition to benefits in SWAP, this
allows for elimination of coupling losses, reduction in the number of packaging stages, and simplification in temperature stabilization [8].
Despite their many advantages, semiconductor devices typically exhibit poor coupling efficiency to optical fibers. This is a severe limitation as long distance communication necessitates the use of optical fibers for low attenuation optical signal transmission. In addition, fiber based amplifiers and lasers at the 1550 nm wavelength regime have typically outperformed their semiconductor based counterparts in terms of output power. Currently, fiber based modules at 1550 nm easily reach single mode output powers > 1 W [3, 9], whereas conventional semiconductor components struggle to reach output powers of >100 mW. Much of this limitation in high power 1550 nm semiconductor devices can be attributed to high intrinsic losses, high optical confinement factor (F), and the presence of two photon absorption in the waveguiding medium [10]. Semiconductor lasers and amplifiers also experience coupling between gain and phase characterized by the linewidth enhancement factor. The linewidth enhancement factor severely broadens the linewidth of typical semiconductor based lasers [1 ]. Both the concepts of two photon absorption and linewidth enhancement factor will be discussed in a later section.
In this thesis, we explore the slab-coupled optical waveguide (SCOW) gain medium [12-15] as an alternative to active fiber technology. The SCOW structure is based on a semiconductor multiple quantum well (MQW) active region that is electrically pumped. SCOW devices are designed to simultaneously achieve high fiber coupling efficiency and high power while still retaining the benefits of size and weight as well as the option of component integration. Here we describe the use of SCOW technology for high power SOAs and low-noise single-frequency lasers.
1.1
Slab-Coupled Optical Waveguide (SCOW) Overview
The Slab-Coupled Optical Waveguide (SCOW) gain medium is based on Marcatilli's analysis of slab-coupled waveguides where he noted that arbitrarily large multimode waveguides can be made to be single mode if all higher order transverse modes except the fundamental mode are coupled to a lossy slab waveguide [16]. Walpole and Donnelly first applied this concept to a semiconductor gain medium by implementing a multimode ridge waveguide structure where all
higher order modes radiate away into the slab waveguide [17]. A multiple quantum well active region is also employed to simultaneously amplify the fundamental propagating mode. The structure of the device is carefully designed so as to achieve small overlap between the optical mode and the quantum wells. This implementation allows for large ridge widths (-6 gm) and waveguide thicknesses (> 5 pim). The larger dimensions combined with the SCOW low index contrast design enables mode sizes on the order of 5.5 X 7.5 Im. Large modes are advantageous to device operation in that they allow for easy coupling to fibers. Large modes also help to distribute the device power over a larger cross sectional area, thereby decreasing the incident optical intensity. This allows for higher output powers before catastrophic optical damage is reached. In addition, the impact of optical nonlinearities such as two photon absorption (TPA)
will be less severe due to the overall reduction in intensity.
-
~6
-g6m
Figure 1-1: Slab-Coupled Optical Waveguide Cross Section.
The realization of low optical confinement is of central importance for obtaining higher output powers. This is true because the quantum wells saturate based on peak intensity. The SCOW gain medium is designed in order to restrict the fundamental mode within the bounds of the waveguide so that only a small fraction of the total field couples with the active region. This is
accomplished through effective tailoring of the index contrast and has the added advantage of minimizing the modal overlap with the p-InP cladding layer. As a result, high internal losses that would occur from intervalence band absorption are largely prevented in the SCOW design. Typical devices have internal losses on the order of 0.5-1 cm-1. A cross section of the slab-coupled optical waveguide gain medium is shown in Fig. 1-1.
1.2
Slab-Coupled Optical Waveguide Amplifier (SCOWA)
The simplest device that uses a semiconductor gain medium is a semiconductor optical amplifier (SOA). In this section, we describe characteristics and performance metrics of semiconductor optical amplifiers with focus on the Slab-Coupled Optical Waveguide Amplifier (SCOWA). We begin by discussing the general operation of the SCOWA. Then, we quantify the gain and saturation output power performance of the device. We also discuss the SCOWA's gain-bandwidth characteristics, and we finally conclude with an analysis of its polarization dependence.
1.2.1 SCOWA Operational Principles
When an SOA is appropriately pumped, light coupled into the waveguide is amplified coherently so as to produce a higher intensity signal at the output. This coupling can be achieved by means of free space optics or with the aid of lensed fibers. However, the best fiber coupling losses reported from SOAs are usually -3 dB [18-20], and this coupling can range to be even larger than 10 dB. The large coupling loss is due to the high mismatch between the fiber mode and the SOA mode with typical SOA mode sizes on the order of 1 jtm in each dimension. In SCOWAs, however, the large optical mode size allows for highly efficient and repeatable coupling (-90%) to standard single mode fibers (SMF). The poor coupling of SOAs is particularly detrimental due to the fact that coupling loss occurs on both the input and output within a single pass of the amplifier. This severely limits the gain of the amplifier. Furthermore, coupling losses reduce the achievable signal to noise ratio and thus degrade the SOA noise figure. Therefore, the large
coupling losses that deteriorate conventional SOA performance are overcome in the slab-coupled optical waveguide design.
After the light is coupled into the input, the light propagates along the waveguide until it is coupled out. The spontaneous emission emitted by the semiconductor active medium also experiences gain, and this amplified spontaneous emission (ASE) mixes with the signal light at the output of the optical amplifier. Even though the majority of the light power is located within the passive waveguiding structure, a small fraction of the mode overlaps with the quantum well active material. It is this small fraction that experiences gain and that is responsible for amplification of the signal. The power within the mode that overlaps with the active region normalized to the total power of the mode is referred to as the transverse optical confinement factor, F. For typical quantum well SOAs, F is -3-5% [21]. However, the SCOWA technology employs a low mode overlap design with confinement factors 0.3-0.5%. This reduction in confinement factor is critical in the SCOW design and allows for the realization of high output powers, as will be seen shortly.
1.2.2 SCOWA Gain
The small signal gain of the SCOWA is determined by the material gain, the internal losses, the confinement factor F, and the device length. The modal gain is given by the gain of the material (g) multiplied by F. The loss is taken into account by subtracting the internal loss (ai) from the modal gain. The result,
Fg
-
a (1.1)is the net gain coefficient per unit length within the device. Taking into account the length of the amplifier, we find the single pass small-signal gain of the SCOWA to be
Go = e ( g - a')L
(1.2)
The maximum gain of typical SOAs can vary significantly depending on the type of SOA (bulk, quantum-well, or quantum dot) and the specific function of the SOA. However, one can usually expect the fiber-to-fiber gain of typical semiconductor optical amplifiers to be in the 10-30 dB
range [22-24]. For comparison, the gain of a typical SCOWA is -15 dB but can be engineered across a wide range by varying the modal overlap with the active material. The relatively low gain of a SCOWA is a result of a trade-off for high saturation output powers as we will see in the
next section.
1.2.3 SCOWA Saturation Output Power
The saturation output power (Pout,sat) is defined as the SOA amplified signal power when the gain decreases to 50% of the small signal gain Go. The gain depletes because the established population inversion decreases when a large signal is present. The population inversion condition requires the presence of excited electrons in the upper state and holes in the ground state. Each stimulated emission event consumes one electron-hole pair reducing the number of carriers available for further stimulated transitions. At higher power levels, the high rates of stimulated events begin to starve the number of available carriers. As a result, the gain of the device begins to deplete.
The saturation output power is an important parameter in SOAs for the purposes of characterizing the total achievable output power. The saturation power has the approximate analytical form of [25]
(G ln 2 )(wd (hv (1.3)
o,' Go -2 F J at
where Go is the small signal gain, w is the active width, d is the active thickness, F is the transverse confinement factor, h is Planck's constant, v is the optical frequency, a is the differential gain, and T is the carrier lifetime. This equation assumes negligible internal loss, which is invalid for SOAs in general. Despite this fact, we can still gain intuition into the physics behind this expression by noting that the saturation output power is inversely proportional to the confinement factor. This occurs because the quantum wells saturate due to peak intensity. If the confinement factor can be designed to be low such that most of the power is located within the waveguide, the stimulated emission rate within the quantum wells can be reduced. This helps to prevent the depletion of carriers within the active region, especially at the input side of the
device. The SCOWA amplifiers use this concept in order to optimize for high saturation output power. The disadvantage of having a low confinement factor is that the gain per unit length will be low. A long device must then be employed to achieve reasonable gain as seen from Eq. (1.2).
In the saturation output power expression, we also see that the saturation power is inversely proportional to the differential gain. This is reasonable based on the defining equation for the material gain coefficient given by
g = a(N-Nr) (1.4)
where N is the carrier density and Ntr is the transparency carrier density, and a is the differential gain. A large differential gain means that the gain changes rapidly with a change in the carrier concentration. Thus, a small depletion in the carrier concentration will cause a greater drop in the gain when the differential gain is larger.
1.2.4 SCOWA Gain Bandwidth
In addition to the gain and the saturation output power, the gain bandwidth is another important parameter characterizing an SOA. The gain bandwidth refers to the wavelength range where the small signal gain falls to half its maximum value across the gain spectrum. This parameter is important for amplifiers that are used to amplify signals across a wide distribution of wavelength ranges. To achieve a high gain bandwidth, the gain must be made flat across a large wavelength range. For semiconductor based amplifiers, this means that the density of states must be relatively constant across wavelength [25]. Because of this, quantum well and quantum dot SOAs typically demonstrate gain bandwidths in excess of 100 nm [5, 26, 27].
1.2.5 SCOWA Polarization Dependence
Polarization dependence is another figure of merit for SOAs and is used to describe the preference of the amplifier to amplify a particular polarization state of light versus another (i.e. TE or in-plane polarized as compared to TM or perpendicularly polarized). The polarization dependent gain of an SOA becomes important when the polarization state of the light that
reaches the amplifier is unknown. In these cases, a polarization insensitive amplifier must be used to guarantee sufficient amplification of the input optical signal. Typical quantum well SOAs are polarization sensitive and emit in the TE mode due to the intrinsic preferences of the light hole and heavy hole transitions toward particular polarizations. The conduction to heavy hole transition results in purely TE mode gain. The conduction to light hole transition, however, contributes - to TM gain and - to TE gain [28]. By straining the quantum wells, the light hole
4 4
and heavy hole levels separate in opposite directions based on the type of strain applied (compressive or tensile). SCOWAs, which use compressively strained quantum wells, have almost a 20 dB gain difference in favor of the TE mode polarization. The application of tensile strain in wells can be used to compensate for the predominant TE mode gain by shifting the heavy and light hole positions until both TE and TM mode transition probabilities are balanced. However, other device properties change with strain, and it becomes an optimization problem to simultaneously achieve low polarization sensitivity while maintaining other performance metrics.
1.3
Optical Amplifier Noise Figure
In addition to the performance metrics given in section 1.2, the noise figure is a commonly used figure of merit that describes the noise performance of an optical link when an optical amplifier is introduced into the system. It is defined as the degradation in signal to noise ratio resulting from the introduction of the amplifier. In this section, we detail the derivations of the optical amplifier noise figure and discuss the implications of the obtained results.
1.3.1 Noise Figure Definition
The optical amplifier noise figure is defined by
NF = 101ogo 0 SNR (1.5)
where the expression in brackets is termed the noise factor
Noise Factor SNR .
SNRow (1.6)
It is important to note that the noise figure given here is defined in terms of electrical signal to noise ratios. Typically optical signal to noise ratios are not used because optical signals are always eventually received and processed electrically in a communication link. Thus, electrical noise figures become the critical targets to meet for link design.
SNRN
0 ooeeol, o 0eene
Laser + PSSE
Figure 1-2: Noise Figure Schematic.
Fig. 1-2 gives a pictorial illustration of the noise figure concept. Noise figure can be understood
by imagining two identical transmitter-receiver systems except with one system containing the
amplifier whose noise figure is being characterized. The SNRin is defined as the signal to noise ratio of the transmitted signal when the optical amplifier is not present in the system, and the
SNRout is defined as the signal to noise ratio measured when the amplifier is introduced. The
division of these two gives the noise factor referenced to a given input noise level. In general, the noise factor will depend on the input signal to noise level. Therefore, the convention is to reference the noise figure to a shot noise limited input [29].
ii iiiii- -f
r
1.3.2 Noise Figure Theory
From the definition of the noise figure (NF) for an optical amplifier, we can now establish an expression to relate the noise figure to directly measurable quantities. The SNRs can be expressed in terms of a ratio of their corresponding signal powers and noise powers. These powers are converted to current sources through division by the load impedance.
(i )2
SNR,,, - A 2,,., (1.7)
SNR = (,)2 (1.8)
Here, (io, )2 and (i,n )2 represent the square of the average signal currents output by the photodiode when the amplifier is inserted and removed from the system respectively.
Furthermore, (A2i,o,,) and (A2in,i) represent the mean square of the noise currents again
measured when the amplifier is inserted and removed.
By convention, the input noise is referenced to shot noise. The shot noise spectral density is given by
Ssho, = 2q(i,) . (1.9)
We can integrate this expression over the electrical bandwidth Be to obtain the mean square of the shot noise current. Assuming that the spectral density is constant over Be, this becomes a simple multiplication by the electrical bandwidth, and we have
(A2i,in) = 2q(ii) B (1.10)
Furthermore, we know that (in,) can be related to the optical signal input on the photodiode through the responsivity 91. This allows us to write
(iin)2 = (1.11)
With these two relations, we find SNRin to be
SNRin= 3 2o2 _ (1.12)
2q(iin)Be 2q 9PoBe 2qBe 2hVBe
where we have used Eq. (1.11) in conjunction with the definition of 9Z
9 = qdq (1.13)
hv
to simplify the result. Here, Ird is the photodiode quantum efficiency, q is the unit of electric
charge, h is Planck's constant, and v is the optical frequency.
SNRout can be found from a similar process. The quantity (io,,,)2 is easily related to (iin)2 through the amplifier gain (G), since the amplifier output power is only a scaled version of the input power. From this, we find that
(io,,)2 = G2 (in2 = 2G2p 2 (1.14)
A2in,ou,) will in general have contributions from multiple sources of intensity noise (e.g.
signal-spontaneous beat noise, signal-spontaneous-signal-spontaneous beat noise, shot noise, pump noise, etc). For amplified signal levels, the signal-spontaneous beat noise is usually the dominant noise source. At very low power levels, however, the shot noise contribution may start to become significant. For these reasons, it is common practice to include both the signal-spontaneous beat noise and the shot noise in the expression for noise figure [29].
The signal-spontaneous beat noise current spectral density is given by
Ssigsp = 4p 2 ASEGPo (1.15)
where we have implicitly assumed the signal to be G*Po and have also used pASE to denote the ASE power spectral density. It is important to note that pASE is the ASE in the same polarization state as the transmitted signal since only the light in the same polarization state can beat together
..
..
[30]. Since the Ssig-sp takes on the shape of the spontaneous emission spectral density, which is constant over a small bandwidth Be, we are justified in multiplying Ssig-sp by the electrical bandwidth to obtain the mean square signal-spontaneous current noise. This results in
i2 = 42 AEGPoBe (1.16)
n wig-spon
The shot noise spectral density multiplied by the electrical bandwidth is similarly found to be
i2
= 2qGPo,9Be (1.17)
Using these expressions, we find SNRout to be
SNR = GP (1.18)
49 2pASEGPBe + 2q9GPoBe 4PASEBe +2q9t-Bl
We can now evaluate the noise figure by dividing the two signal-to-noise ratios. We find that the noise factor is
7dPo SNR,, _ 2hVBe _ l(4pASEBe + 2q9-'B,) Noise Factor -SNRou, GP G(2hVBe) (1.19) 4 PASEBe + 2q9-'Be 2rldPASE + hv _ 2 ldPASE 1 Ghv Ghv G
From the equation, it is apparent that the noise figure depends on the quantum efficiency of the photodiode. A nonideal quantum efficiency that is less than unity will actually decrease the noise figure. Physically, a nonideal quantum efficiency attenuates both the shot noise and the signal-spontaneous beat noise. However, the signal-signal-spontaneous beat noise depends on the square of 11 and so decreases faster than the shot noise. In the end, their ratio results in an improvement in the noise figure with increasing attenuation. A calibration is needed during testing to correct for nonideal photodiodes. Assuming the nonideal quantum efficiency correction is performed during measurement, we have
Noise Factor = 2PAE + (1.20)
Ghv G
1.3.3 Alternative Noise Figure Expression
In order to achieve an expression that can be directly related to the amplifier parameters, we begin by trying to represent the ASE spectral density in terms of the intrinsic properties of the amplifier. To do this, we first begin with the traveling wave rate equation for the photon density propagating along the z direction.
dN dN =(Fg (N) - )NP + (Fg(N)- - n (1.21)
dz V
where Np is the photon density, F is the confinement factor, g(N) is the carrier density dependent gain, a is the internal loss, nsp is the population inversion factor, and Vp is the photon volume. It is easy to verify that the solution to this equation is
N (z) = Np,ine(rg
-a)z + (e(rg-a)z -1) (1.22)
P
where we have used the boundary condition that Np(0) = Np,in. After passage through the amplifier, the photon density will be
N,(L) = NP,,nG + T(G -1) (1.23)
P
where we have used Eq. 1.2 to simplify the expression. The second term represents the ASE photon density after passage through the SOA, and we can now multiply by the photon energy, the photon volume, and the optical bandwidth to obtain the ASE power.
PASE = hn (G - 1)Avop, (1.24)
The last multiplication by the optical bandwidth is a result of approximating the ASE power spectral density as white over Av> Avop,. It is implicitly assumed that the ASE spectrum abruptly cuts off for frequencies outside of A oP,.
To find the power spectral density of the ASE, we now divide by the optical bandwidth and obtain
PASE = hvns (G -1) (1.25)
Substituting this into our expression for the noise factor, we find
2hons(G-1) 1 2n, (G-1) 1
Noise Factor = +- +-. (1.26)
Ghv G G G
Although Eq. (1.26) appears complete, a deeper analysis reveals that the equation is missing a few corrections. For instance, the equation does not account for coupling losses. Coupling losses cause both the signal and ASE output of the amplifier to appear lower. However, because only the ASE suffers from output coupling losses while the gain suffers from coupling losses at both the input and output, it is expected that the two factors should not completely cancel. Furthermore, the equation does not account for internal loss within the amplifier. This can be shown by checking some of the boundary cases for the gain in the noise factor expression. When the gain is 1, we expect the material gain to exactly balance out the waveguide losses. From Eq. (1.26), we observe that the signal spontaneous beat noise term cancels to 0. However, intuitively, we expect that neither the ASE nor the signal level would be exactly 0 when the gain is 1. The equation for the noise factor with both corrections accounted for is given below as [31-33]
Noise Factor =1 2n (Gp -) Fg + 1 (1.27)
1.3.4 Analysis of the Noise Figure Equation
From Eq. (1.27), it can be seen that the noise figure approaches a limit of 3 dB if the amplifier is
fully inverted, if the coupling efficiencies are ideal, and if the gain is much higher than the loss.
Physically, this limit is due to the fact that ASE is always created in the same polarization state as the gain when there is gain in the amplifier. With the maximum inversion level possible, the ratio of stimulated emission to spontaneous emission is at its maximum. However, the spontaneous emission present still mixes with the signal to produce beat noise at the receiver end of the link. The implication of this 3 dB noise figure limit is that every additional optical amplifier that is added into the system will degrade the system noise performance by at least 3 dB. In reality, the effect of each added amplifier is not as detrimental as this analysis makes it seem since the analysis assumes a shot noise limited input signal. The amplified signal will, in general, have noise contribution much higher than the shot noise limit. If this noise is large enough, the added noise from the amplifiers in the later stages will have negligible effect on the total system SNR.
Eq. (1.27) makes it clear that the SCOWA design offers many advantages in noise figure
performance. The high coupling efficiencies achieved by SCOWA amplifiers allows for almost no degradation in the noise figure from input coupling. By itself, this can allow for over a > 3 dB improvement in SCOWA noise figures when compared to conventional SOAs. The SCOWA
Pg
internal losses are also nearly zero. These low losses are enough to drive the factor in
Fg - a,
Eq. (1.27) to nearly unity despite the low modal gain (due to low optical confinement) of the
SCOWA. The low coupling and internal losses ensure that the signal remains at a level much higher than the noise floor.
Finally, the inversion factors achieved by SCOWA devices are nearly ideal, even at high power levels. This is true because the SCOWA gain is distributed over a 1 cm long device where the modal overlap with the quantum wells is weak. It is therefore much harder to deplete the population inversion of the quantum wells, and nsp is nearly unity for SCOWA devices over a large range of operation conditions. Conventional SOAs can also achieve low inversion factors at low optical power, but nsp quickly degrades once higher powers are reached.
1.4 Slab-Coupled Optical Waveguide External Cavity Laser
(SCOWECL)
The slab-coupled optical waveguide external cavity laser (SCOWECL) consists of a SCOWA gain medium coupled with a frequency selective external cavity. This allows the laser to achieve resonance through feedback provided by the mirrors. A laser operates by selectively amplifying one or a small subset of the longitudinal modes within its spontaneous emission spectrum. This selection is realized by filtering out the longitudinal modes within the cavity such that only a few modes achieve net round trip gain. The filtering effect is usually achieved through the wavelength selectivity of the reflection but can also be achieved through other wavelength sensitive elements. In addition to mode filtering, mode competition processes also act to suppress the nonlasing modes of the cavity. When enough current is supplied such that the round-trip gain of the mode becomes equal to the round-trip loss, the mode reaches the lasing threshold. Any further increase in pump current then directly feeds the lasing mode and further increases the power within the mode. As a result, almost all of the laser power is distributed into a single mode or a small subset of modes, which allows for an almost purely single frequency output. The Relative Intensity Noise (RIN) and spectral linewidth are two common metrics used to evaluate the performance of a laser. We will discuss the theory and measurements of the RIN and linewidth of lasers employing the SCOW gain medium in the upcoming sections of this thesis.
1.4.1 SCOWECL Relative Intensity Noise (RIN)
The relative intensity noise (RIN) of a laser is defined as
RIN = 2 (1.28)
()
where (AP)2 is the mean square intensity-noise spectral density of the optical signal, and P is the average optical power [34]. The RIN is a function of frequency and is a measure of the intensity noise power of the laser at the corresponding frequency. The intensity fluctuations are picked up
once the optical signal is detected by a photodiode and processed on an electrical spectrum analyzer. Generally, these fluctuations can be due to pump source noise, quantum noise, or vibrations of resonator mirrors [35, 36]. In these cases, it is the actual fluctuation of the laser output power that gives rise to the induced intensity noise.
In addition to these, intensity noise can arise as a result of the detection process. The electronic detection of a photocurrent signal from a laser results in a self-convolution of the optical spectrum. As a result, beating occurs between the various components of the optical signal. The presence of multiple modes creates beat notes at the harmonics of the mode spacing frequency. The spontaneous emission of the laser also beats with each of the lasing modes to create a noise floor across a broad range of frequencies. The spontaneous emission can even beat with itself to generate a contribution to the intensity noise resembling a downward ramp function peaked at 0 Hz. Finally, shot noise resulting from the uncertainty in photon and electron arrival as well as thermal noise due to the thermal agitation of charged carriers in conductors along the electrical signal path both present additional contributions to the RIN. The combination of all of these noise sources gives rise to the relative intensity noise spectrum.
Relaxation oscillation peaks are present in the spectra of measured laser RIN due to the resonance interaction between photons and electrons. A perturbation on the photon density in the lasing cavity causes a small deviation of the stimulated emission rate away from its steady state value. This induces a change on the population inversion of the system, which ultimately acts to counteract the perturbation on the stimulated emission rate. This cycle is characteristic of a negative feedback system and results in stable oscillations back to steady state operation under the presence of small fluctuations. The relaxation oscillations occur at a characteristic frequency, which results in a peak in the relative intensity noise spectrum. For typical semiconductor lasers, the RIN peak is in the range of 1-10 GHz and is often at least several GHz wide. However, it will be shown later that the RIN peak of a SCOWECL is beneath the noise level for measurable values of the shot noise floor. This relaxation resonance suppression is one of the many advantages of employing a SCOW based laser design.
From the Eq. (1.28), we see that laser RIN is expected to be closely related to amplifier noise figure since both expressions can be interpreted in terms of signal-to-noise ratios. Therefore, we expect the SCOW gain medium characteristics that contribute to a low noise figure amplifier to also contribute to a low RIN laser. This is seen through the population
inversion factor, where it was previously mentioned that SCOW amplifiers are expected to have low nsp at high powers due to its high resilience to gain depletion. Since np is related to ASE noise, this allows for low RIN SCOWECL lasers at output powers approaching 1 W. Furthermore, the low internal losses of the SCOW gain medium also indirectly benefit the laser's relative intensity noise. Low internal losses allow the threshold condition to be achieved at lower current densities. This then yields a higher output signal and a correspondingly higher SNR for the same bias point. Note that this analysis assumes the noise power to be signal independent, which is generally not true for beat noise. To estimate RIN for signal dependent noise powers, the increase of the signal level must be compared against the relative increase of the noise.
1.4.2 SCOWECL Linewidth
In contrast to RIN, the linewidth of a laser is due to phase noise rather than intensity fluctuations. The laser linewidth is given by the full width at half maximum of the electric field power spectral density. The quantum-limited linewidth arises due to the random phase acquired by photons generated through spontaneous emission events. The spontaneously emitted photons mix in with the optical field, and the mismatch in phase decreases the established coherence. A change in the phase causes a shift in the instantaneous frequency, which results in a finite lasing linewidth.
Fig. 1-3 illustrates the rotation in phase of the optical field due to the addition of a spontaneously emitted photon. The optical field has a collective ampltiude f- and phase V and is denoted by the phasor Iej '. Here, I is the intensity of the optical field. The spontaneous photon has amplitude 1 with phase Bi and can be similarly written as ej((+ei) . After the photon is added to the system, the combined field has amplitude
'1
+ A and is rotated from its previous phaseby AO. It is easy to show that the phase change is given by
Af = sin(O) (1.29)
-o
e.
-E
o
Real Component of Field
Figure 1-3: Phase change of optical field resulting from a spontaneous emission event.
When a spontaneous emission event occurs, the laser undergoes relaxation oscillations to try to restore steady state operation. Through this process, the carrier density will shift to establish equilibrium. As seen by Eq. (1.4), carrier density fluctuations cause gain fluctuations, which are then coupled to refractive index fluctuations through the Kramer's Kronig relations. It can be shown that the phase change associated with this process is given by
A'- aH aH
COs(8) (1.30)
21r
where aH is the linewidth enhancement factor defined as [11]
dn/dN
aH _ dn/dN (1.31)
dg/dN
Here, N is the carrier density, n is the refractive index, and g is the gain. The laser linewidth is related to the total phase change, and the result can be derived to be
AV= p (l+aH 2). (1.32)
Finally, writing this expression in terms of the intrinsic parameters of an external cavity laser comprising both active and passive cavity sections [37]
2 2
A v o nshu(I+L , +2 ng L (1.33)
4x Po nga La + ngp Lp
where vg is the group velocity in the active region, F is the confinement factor, gth is the threshold gain, Po is the single-facet power, rlo is the single-facet efficiency, nsp is the population inversion factor, nga is the active material group index, ngp is the passive material group index, La
is the active cavity length, and Lp is the passive cavity length.
From this expression, we see again that the SCOW gain medium offers significant benefits compared to conventional lasers in regards to obtaining a narrow linewidth. The threshold gains of the SCOWECL devices are much lower than in conventional lasers because the internal losses are much smaller. From Eq. (1.33), we see that the corresponding linewidth should also be lower. In addition, the SCOW medium allows for much higher powers before saturation is reached. Again, this is seen to produce a corresponding reduction in the linewidth. Finally, the near ideal population inversion factor exhibited by the SCOW gain medium is also favorable for obtaining a narrow linewidth as observed in Eq. (1.33). A more physical argument for the narrower laser linewidth of SCOWECLs can be formulated in terms of the laser cavity's quality (Q) factor. The Q factor is defined as
Q V- V - 2; Energy Stored
A V Energy Dissipated
Here, v0 is the lasing frequency and Av is the linewidth. We see that with more energy dissipated
in the losses of the cavity, the cavity Q decreases and the linewidth increases.
1.5 Slab-Coupled Optical Waveguide Device Applications
In sections 1.3-1.4, we have shown that the unique properties of the SCOW gain medium are favorable and directly applicable to the realization of high-power low-noise semiconductor optical amplifiers and lasers. In the upcoming sections, emphasis will now be placed on system
level applications for SCOW-based devices. We first detail the application space for SCOWA amplifiers by comparing SCOWA amplifiers to the current state of the art technology. We then examine the uses of SCOWL and SCOWECL lasers focusing on systems whose functionality can significantly benefit from high power lasers. Finally, we introduce the Slab-Coupled Optical Waveguide Photodiode (SCOW-PD) concept and describe the applications where it can be utilized.
1.5.1 Slab-Coupled Optical Waveguide Amplifier Applications
Optical amplifiers are used in optical communication systems where the signal level must be amplified in order to preserve the SNR or to keep the signal within detection limits. From a systems perspective, optical amplifiers are classified into three different categories: booster amplifiers, in-line amplifiers, and pre-amplifiers. Booster amplifiers are used to directly amplify the output of an optical source in order to boost signal levels prior to transmission. Because the laser polarization state is known, the optical amplifier can be polarization dependent as long as the polarization state of maximum gain is in the same state as that of the laser signal. Booster amplifiers require high saturation output powers in order to transmit as large of a signal as possible. The gain and noise figure requirements are less stringent as the signal emitted by the laser source will likely already be high. However, a high-gain low-noise figure booster amplifier is still useful. Since noise figure and RIN are both directly related to spontaneous emission noise, a low noise figure amplifier can be directed integrated with a low RIN laser in the same material system for photonic system applications.
The SCOWA device exemplifies all characteristics needed for a booster amplifier. Its ultra-high saturation output power, high coupling efficiency, and low noise figure make it ideal for amplifying the power of transmitted signals. This is especially apparent in wavelength division multiplexing (WDM) applications where the SCOWA's high saturation output powers are expected to suppress crosstalk between channels. A high coupling efficiency is also important for efficient power transfer between the SCOWA and optical fiber. The amplifier's low noise figure provides the added benefit of low noise amplification. Traditionally, low noise figures are critical only in-line and pre-amplifier applications but not for booster amplifier applications where the signal levels are high. However, because of the common properties shared
between noise figure, relative intensity noise, and linewidth, the same material used to fabricate a low noise amplifier can also be used in designing low noise lasers. In integrated laser-amplifier applications, low noise, high power, narrow linewidth systems can be realized. In addition, if the SCOWA can be designed to be polarization insensitive, options for in-line amplifier operation become available. In these amplifiers, the noise figure is critically important. Finally, because the gain bandwidth of a SCOWA is > 100 nm, one SCOWA amplifier can potentially amplify a large number of input channels. This is in direct contrast to EDFAs which have a gain bandwidth of -35 nm.
Inline amplifiers are used for signal regeneration in order to counteract propagation losses that attenuate the signal. These amplifiers require high gain and low noise figure since the signal levels will be low due to losses. Polarization insensitivity is essential as the conventional telecomm fibers do not preserve polarization. Thus, inline amplifiers need to be able to amplify all polarizations equally as the signal polarization upon reaching the amplifier is unknown. High saturation output power is useful in these amplifiers in order to drive the signal level higher upon exit. Currently, due to the polarization sensitivity of the SCOWAs, they cannot be used as inline amplifiers. However, through proper design, it is conceivable that a polarization insensitive SCOWA can be demonstrated.
Pre-amplifiers are used to boost the signal prior to detection in order to increase the sensitivity of the receiving detector. Similar to inline amplifiers, pre-amplifiers are required to be polarization insensitive. Furthermore, these amplifiers need high gain and low noise figure in order to compensate for low signal levels at the input. High saturation output powers, however, are not important as receivers typically do not handle high power levels. SCOWA amplifiers are unsuitable to serve as pre-amplifiers since they are intrinsically polarization sensitive and have noise figures which are still too noisy for pre-amplifier applications. Furthermore, many of the advantages of using a SCOWA (high output power) are only of secondary concern in pre-amplifiers. Thus, even if a polarization insensitive SCOWA could be fabricated, it will likely not find usage as a pre-amplifier.
1.5.2 Slab-Coupled Optical Waveguide Laser Applications
High power lasers find use in many applications where attenuation would otherwise cause a signal to fall below an acceptable minimum. Typical low-noise semiconductor lasers output a few mW of power and require external amplification to reach signal levels practical for most applications. This amplification process introduces noise and reduces system efficiency, so it is desirable to bypass the amplifier by using a higher power source. One application for high power mode locked lasers is in photonic analog-to-digital converters where they are utilized to sample a microwave input signal. The sampling process is performed using a modulator with the laser pulses as the input and the microwave signal as the driver for the modulator. Here, high powers compensate for losses encountered during signal propagation such that detection sensitivity is high when the modulated optical signal is eventually detected. SCOWLs are excellent candidates as mode locked laser sources as a colliding pulse mode locked SCOWL has been recently demonstrated exhibiting 8.54 GHz repetition rate, < 20 ps detector limited pulse duration, and 170 mW average output power out of each facet [38].
In addition to mode locked SCOWLs, external-cavity laser configurations using the SCOW gain medium have also been realized. These external-cavity lasers use a fiber Bragg grating as the wavelength selective element to achieve narrow linewidth, high power, and low RIN performance in a single frequency source. The measurements of these slab-coupled optical waveguide external-cavity lasers (SCOWECLs) will be detailed in Chapter 3. The measured SCOWECL characteristics make them excellent sources for analog photonic links. In an analog photonic link, data that is picked up by a remote receiver antenna is relayed back to the central office via a fiber-optic network. This is accomplished remotely by modulation of the received information onto a laser signal sent from the central office. Because the noise properties of an optical link are largely influenced by the properties of the laser, the laser must meet strict standards in order to achieve optimum link performance. In particular, an ideal optical link laser will have high output power, low RIN, and narrow linewidth. Narrow linewidth, in particular, is essential for phase-modulated laser signals as the phase noise of the laser must be very low to allow for accurate signal demodulation. The SCOWECL is ideal for this application as it is expected to perform exceptionally in all three of these metrics based on our earlier discussion.