Radio Science, Volume 34, Number 3, Pages 667-779, May-June 1999
Aspect sensitivity of VHF radar echoes
observed in the middle
and upper troposphere during the passage
of a cut-off low
Bemard CampistronLaboratoire d'A6rologie (CNRS), Observatoire Midi-Pyr6n6es, Universit6 Paul Sabatier, Toulouse, France
Yves B. Pointin
Laboratoire de M6t6orologie Physique (CNRS), Observatoire de Physique du Globe de Clermont-Ferrand Universit6 Blaise Pascal, Clermont-Ferrand, France
Fabienne Lohou and Jean-Pierre Pages
Laboratoire d'A6rologie (CNRS), Observatoire Midi-Pyr6n6es, Universit6 Paul Sabatier, Toulouse, France
Abstract. The aspect sensitivity of VHF radar signals is related to the enhancement of the echo power and the narrowing of the spectral width at vertical incidence relative to the off- zenith directions. The strong aspect sensitivity is usually associated with stable atmospheric layers. In this paper the aspect sensitivity measured between an altitude of 4 and 15 km during the passage of a tropopause folding linked to a cut-off low is analyzed and discussed. The study mainly uses data acquired during a 2-day period with a three-beam VHF radar with relatively broad beam widths (6.8ø). The angular dependence of the echoes is investigated using the power ratio of vertical to oblique beam and the spectral width obtained at vertical incidence. These two diagnostic parameters provided a nearly identical depiction of the stratospheric descent associated with the upper frontal zone. However, a discrepancy is observed between the location of the stratospheric subsidence and the tropopause height offered by the radar and that deduced from the meteorological analysis produced by an operational forecasting numerical model. Owing to the aspect sensitivity of the echoes, an underestimate amounting to 20% was found in the horizontal wind measurement. Finally, a comparison of simultaneous observations of two closely spaced VHF radars (100 kin) has shown a good spatial coherence of the aspect sensitivity structures.
1. Introduction
The so-called aspect sensitivity of VHF radar measurements is related to the zenith angle dependence of the backscattered power and spectral width. The enhancement of the echo power and the narrowing of the spectral width at vertical or near-
vertical incidence relative to the off-zenith directions are of common occurrence and well established now
for VHF radar observations [e.g., Gage and Green,
Copyright 1999 by the American Geophysical Union.
Paper number 1998RS900032. 0048-6604/99/1998RS900032511.00
1978; ROttger et al., 1981; Hocking et al., 1986; Woodman and Chu, 1989; Yoe et al., 1994]. Strong aspect sensitivity is mainly found in the stratosphere and mesosphere. The unstable and turbulent troposphere usually presents slight aspect sensitivity except in the stable region around the tropopause, which exhibits the strongest vertical enhancement in the lower atmosphere. This was used as a mean for the tropopause height detection [Gage and Green, 1978]. Occasionally, aspect sensitivity enhancement was observed in the middle and lower troposphere, particularly during the passage of frontal zones [e.g., Hooper and Thomas, 1995].
There is still controversy about the backscattering process giving rise to the echo angular dependence,
668 CAMPISTRON ET AL.: VHF ASPECT SENSITIVITY IN A CUT-OFF LOW
although it is generally accepted that it is produced by stable and thin horizontally stratified atmospheric structures. The existence of thin temperature sheets and their relation with VHF signal enhancement was proved by Luce et al. [1995] using very high
resolution in sire measurements. Two main echo
mechanisms have been proposed to explain the origin of the aspect sensitivity of the echoes. (1) The first is scattering from amsotropic turbulence [e.g., Gage and Green, 1978; Doviak and Zrnic ', 1984; Hocking and Hamza, 1997]. Woo&an and Chu [1989] have proposed a model of a thin atmospheric sheet in which the scattering sources evolve from anisotropic structures at the edges toward more isotropic ones when approaching.the center of the layer. (2) The second is partial reflection from a single or a group of thin horizontal layers with sharp vertical variations in the refractive index. The specular echo model (mechanism 2) is called Fresnel scattering when the layers are vertically randomly distributed within the radar resolution volume. It is called diffuse reflection when the layers are not perfectly horizontal but present some roughness due to waves or turbulence [e.g., ROttger and Liu, 1978; ROttger, 1980; Gage et al., 1981]. According to Hocking [1997], the distinction between echoes from anisotropic turbulence and from an ensemble of specular reflectors is always difficult in radar measurements. In the following, we will use the general term of amsotropic specular reflection for these two types of
echoes.
Apart from the backscattering from hydrometeors, scattering from refractive index irregularities induced by isotropic turbulence [Tatarskii, 1961] is a well- accepted mechanism [}Foodman and Chu, 1989] to explain radar echoes observed in the absence of aspect sensitivity, which usually predominates for zenith angles larger than about 10 ø [Hocking et al., 1990]. Certainly, it is the conjunction of these different kinds of echoing sources, more or less dominant within the radar resolution volume, which produces the observed radar signal.
In this study, we present an analysis of the aspect sensitivity observed during the passage of a jet stream linked to a cut-off low. In particular, we show that aspect sensitivity might be helpful to map stratospheric descent not well resolved by a forecasting model.
2. The Experimental Setup
The observations discussed here have been
collected during the ESTIME (Echanges Stratosphere Troposphere Investigations /t Moyenne Echelle) experiment (1993-1995), which was aimed at investigating the stratosphere-troposphere exchanges and mixings associated with cut-off low events. The project was mainly based on data acquired by the regional wind-profiler network (5-VHF and 1-UHF radars) deployed in southern France, roughly arranged in a triangular formation with a mean side dimension of 400 km [Camp•stron, 1997]. The present study
focuses on the data of one of the VHF radars situated
at the Centre de Recherches Atmosph6riques (CRA) on a plateau (43.13øN, 0.37øE) at a height of 600 m in the foothills of the Pyr6n6es mountains (see Figure 1). This mountain range, separating France and Spain
between the Atlantic Ocean and the Mediterranean
Sea, is oriented roughly west to east. It is an isolated structure with a length of about 400 km and a mean transept of 50 kin. The nearest summit at a distance of
30 km from the radar culminates at 2800 m. In section
7, the analysis of the CRA radar data is complemented with a comparison made with observations collected, in a restricted period of 10 hours, by another VHF
radar of the network of identical instrumental
characteristics. This radar, located in Toulouse (43.62øN, 1.43øE) at an altitude of 150 m, is approximately 100 km northeast of the CRA radar (see Figure 1).
These two radars were operated at a 45-MHz transmitted frequency, with a 6-kW peak power, a 6400-Hz pulse repetition frequency, and a 25-l•s- coded pulse. A 10-element complementary code provided an effective range resolution of 375 m. A vertical beam and two oblique beams, with perpendicular azimuth angles and an off-zenith direction of 14.7 ø, were alternately used to get vertical profiles of the three components of the wind every 12
min.
A coaxial-collinear
antenna
(56x56
m
2) provided
for these three directions a one-way half-power beam width 0b of 6.8 ø. The vertical sampling was made of 48 range gates, evenly spaced by 362 m, starting at an
altitude of 3839 m.
The measurements were off-line carefully edited in
order to extract the three moments of the
meteorological spectra. In a first step, the mean noise level of the Doppler spectra was determined with the
CAMPISTRON ET AL.' VHF ASPECT SENSITIVITY 1N A CUT-OFF LOW 669
10 ø W 0 ø q 00 10 ø E
Figure 1. Horizontal wind and height contours (meters) on the 500-hPa surface at 1200 UTC on March
4,1995, provided by the European Centre for Medium-Range Weather Forecasting (ECMWF) model. The star and the circle, nearby the 0 ø meridian in We south of France, give respectively the location of
the Centre de Recherches Atmosph6riques (CRA) and Toulouse (TLSE) VI-IF radars.
objective method proposed by Hildebrand and Sekhon [1974], and the zero velocity spectral line, contaminated by ground clutter and instrumental effects, was removed and replaced by a value interpolated from the two adjacent spectral lines. Usually, several distinct Doppler peaks emerge above the noise level. In a second step, the selection of the meteorological peak was done on the basis of vertical and temporal continuity and thresholdings. Finally, the selected peak was fitted to a Gaussian curve from which mean radial velocity, echo power, and spectral width were computed.
3. Meteorological Overview of the
Case Study
Early on March 3, 1995, a baroclinic wave of the westerly jet stream begins to develop over western
Europe and the nearby Atlantic Ocean. Figure 1 displays, on the 500-hPa surface, the meteorological analysis of the European Center for Medium-Range Weather Forecasts (ECMWF) model obtained on March 4, 1995, at 1200 UTC. Figure 1 shows a cold air outbreak in a strong northerly flow crossing the British Isles, the west of France, and the north of Spain. A deepening low, centered above the Alpine Mediterranean coast, is located on the trough extending between the North Sea and Corsica. On March 5 at 1200 UTC, the low has moved toward central Italy and is now almost detached from the synoptic current. The day after, this cut-off low has disappeared from the meteorological charts.
The data analysis is restricted to the period from 1600 UTC March 3 to 0900 UTC March 5, 1995. The time-height section of the wind observed by the radar is presented in Figure 2a. As for the next radar
670 CAMPISTRON ET AL.' VHF ASPECT SENSITIVITY IN A CUT-OFF LOW VVIND SPEED ( M S4) .... ::.:,:::..-::: ::::'::::":.... •::- .-:../:•'i• •. ß 0 16. .7,2. 48. 64. 80 •..': . ... "':- •....:: ..: . . ... :• 7'" . . ' .
•' •'• ::::• :"": ""'
":'
4
• '" "'•:
4 16 20 O0 04 08 12 16 20 O0 04 08(a)
-nuœ
(UTC)
• 7
(b)
(10
'3 $ -1 )
... PV (10-"
K M 2 S '1 Kg
'1)
16 20 O0 04 08 12 16 20 O0 04 08
OSMAR95
TIME (UTC)
OSMAR9$
Figure 2. Time-height sections above the radar site: (a) horizontal wind vectors and speed (m S -1) observed by the VHF radar, and (b) contours of B•x•nt-Vaisfilfi frequency N (solid lines) and potential vorticity (PV) (dashed lines) derived from the analysis of the ECMWF model.
sections, a smoothing in height (three data gates) and in time (three hours) was applied to the data for better clarity. The southward descending branch of the jet streak associated with the baroclinic wave appears
on March 4, between 0600 and 2000 UTC, as a core of strong wind centered at an altitude of about 9 km,
reaching
values
larger than 65 m s
4 around
1600
UTC.
The time-height section above the radar site of the
Brtmt-Vai'sfilfi
frequency
N and potential
vorticity
(PV) are shown in Figure 2b. These fields were obtained from an analysis of the ECMWF model. N is a measure of the static stability of the atmosphere, and PV is a conservative quantity for inviscid adiabatic
dry motion.
These
parameters
are expressed
by the
CAMPISTRON ET AL.' VHF ASPECT SENSITIVITY IN A CUT-OFF LOW 671
N - g 630 PV-
0 63z '•a
63p630
where g is the gravitational constant, 0 is the potential temperature, •a is the vertical component of the absolute vorticity, z is the altitude, and p is the
pressure.
The packing of the N contours indicates a tropopaus½ height of about 7 km at the beginning of the period and of about 10.5 km at the end of the period. On March 4 between 0400 and 1400 UTC, the downward sloping of the contours reveals the passage of the baroclinic zone linked to an upper 1½v½1 frontal
surface. A similar feature is observed on the PV contours and corroborates the intrusion of
stratosphcric air into the upper troposphere. According to the 2-PV-unit contour, which is usually taken as a separation between stratosphcric and tropospheric air, that stratosphcric descent, which precedes the passage of the jet core, extends down to
an altitude of about 6.5 km on March 4. In view of the
previous synoptic description, this weak tropopaus½ fold is situated on the cyclonic side of the jet stream. 4. Aspect Sensitivity Analysis
This study of aspect sensitivity is based on three different approaches, often reported for the tropopause height detection. The first method analyzes only the local enhancement of the echo power Pv obtained at vertical incidence [Gage and Green, 1978]. The second one makes use of the Pv/Po ratio between the echo power observed at vertical and that observed in an oblique direction [Tsuda et al., 1986], where Po represents the average of the echo power received by the two oblique beams. The last method is based on the spectral width C•v measured in the zenith direction [Hocking et al., 1986]. The spectral width is here defined as the root-mean-square of the Doppler spectrum variance. For a vertically pointing beam with a relatively large aperture, the beam-broadening effect governs mostly the spectral width. According to Sloss and Atlas [1968], a finite beam induces a spectral width c•, which is expressed for isotropic scatters and for a Gaussian beam diagram by the following relationship:
C•b--
Ob
(16 In 2) -ø'•
V
(1)
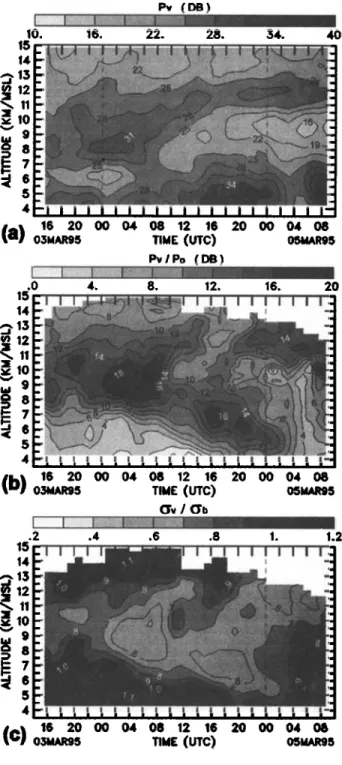
Pv (DB) 10. 16. 2.2. 28. 34. 15 14 . .[;"<;':'::' ... .,,-':.} ::..:.;::.: ;..•;' ' ' ... :•'•! ... ::. ' '•:":':-:':>.'. ... '::'i ,•:'• ß '•" ": ' " 4OFigure 3. Time-height sections of aspect sensitivity parameters observed by the VHF radar: (a) vertical echo power Pv (decibels relative to an arbitrary reference power level); (b) vertical to oblique echo power ratio Pv/Po (decibels); and (c) normalized vertical spectral width Cry/Crb.
672 CAMPISTRON ET AL.: VHF ASPECT SENSITIVITY IN A CUT-OFF LOW
where
V is the horizontal
wind speed
(m s-•),
and
0•
(radians) is the half-power one-way width of the
beam.
When the beam broadening is the only source of spectral broadening, then isotropic scatterers give Ov value equal to Oh, and anisotropic specular reflectors give Ov value smaller than Ob [Hocking et al., 1990]. If other spectral broadening factors, such as turbulence, add to the beam effect, Ov becomes larger than Ob for isotropic scatterers, but it can become smaller or larger than Ob for anisotropic specular reflectors depending on the contribution of the extra broadening factors. Therefore the ratios Ov/Oh (as P•/Po) provide information on the degree of aspect sensitivity of the
echoes.
Figure 3a presents the time-height section, for the considered period, of the uncalibrated vertical signal- to-noise ratio Pv corrected for the squared range dependence. In the upper part of the tropopause fold, evidenced by the N field in Figure 2b, there is a core of Pv larger than 30 dB extending slightly downward and centered at a height of 8.5 km on March 4 at 0200 UTC. This core is part of a tongue of Pv enhancement, sloping upward with time, reaching a height of 12 km on March 5. This particular zone, well detached from the environment at the end of the period, follows the tropopause region deduced from Figure 2b. In fact, the so-deduced radar tropopause appears shifted upward from the ECMWF tropopause of approximately 1.5 km.
Time-height sections of Pv/Po and o• /Oh are presented in Figures 3b and 3c, respectively. It is clearly apparent that these two fields depict a similar pattern of the aspect sensitivity, with opposite variations such that strong values of Pv/Po are well
correlated to small Ov/Ob values. However, the Pv/Po presentation displays much more detail on the aspect sensitivity (and therefore on the stability of atmosphere) than the Ov/OU field. Figure 3c also shows that less than 10% of the data have Ov/Ob larger or
equal to 1, which is a necessary (but not sufficient) condition for the presence of isotropic echoes. These data are on the average associated in Figure 3b with Pv/Po smaller than 6 dB, which indicates that come from amstropic specular reflections. It appears that for this case study, anisotropic specular reflections are preponderant in the middle and upper troposphere.
These aspect sensitivity fields present notable similarities with the vertical echo power field. Corresponding with the core of strong of Pv enhancement in the region of the upper tropopause fold, there is a core of strong aspect sensitivity with values reaching 20 dB for Pv/Po and less than 0.5 for Ov/Ob. In the same way, the upper tropopause is marked by an ascending branch of high aspect sensitivity, which is crossed, on the afternoon of March 4, by a zone of weaker aspect sensitivity connected with the jet stream maximum. This clearly apparent region might indicate different evolutions (mixing, radiative or convective warming or cooling, and so on) than its environment.
The more striking feature of Figures 3b and 3c is a tongue of high aspect sensitivity sloping downward with time, from the upper tropopause fold down to a height of 5 km at the end of March 4. No equivalent feature is evident in the Pv field of Figure 3a, in the N, or in the PV field in Figures 2a and 2b. Probably, this stable zone displayed by this feature of the aspect sensitivity fields is linked to the upper frontal surface not well resolved by the ECMWF model and possibly corresponds to a stratospheric descent.
5. Aspect Angle and Wind Measurement
Errors
Aspect sensitivity induces a deformation of the polar diagram of the radar beam which is more strongly weighted toward zenith. As a consequence, the effective pointing angle 0½ of an oblique beam is displaced toward zenith. In order to avoid this source
of error in the retrieval of the horizontal wind
velocity, 0½ has to be used in place of the nominal value 0r. The estimation of 0½ requires knowledge of the polar diagram of the scatterers. Hocking et al. [1990] proposed a simple model, used here, in which the scatterers have a polar diagram of the form exp (-
02 / 020,
where
0 is the tilt angle
of the beam
and
0, is
the
aspect
angle
corresponding
to the e -• half width
of
the polar diagram of the backscatterers. This parameterization is in accordance with the Gaussian- like angular dependence of the backscattered power (at least for angles close to the vertical) reported by numerous authors [ROttger et al., 1981; Waterman et al., 1985; Tsuda et al., 1986; Chu et al., 1990]. The
CAMPISTRON ET AL.' VI-[F ASPECT SENSITIVITY IN A CUT-OFF LOW 673 parameter 0s is related to the degree of aspect
sensitivity of the echoes and ranges from 0 ø for pure anisotropic specular reflections to infinity for pure isotropic scatterers. As shown by Hocking et al. [1990], the importance of 0• relies on the fact that its inverse is directly proportional to the horizontal correlation length of the scattering field.
The estimation, from the radar data, of the effective pointing angle 0e and of the aspect angle 0s is deduced using the hypothesis that the scatterers have a backscatter polar diagram of a Gaussian type [Hocking et al., 1990]. It is also assumed that 0s is independent of the radar beam tilt angle or, in other words, that only one type of scattering process exists. The three following equations are derived by Hocking et al. [1990]:
sin 0e = sin 0 T ( 1 + 020 / 02s )-1 (2)
where
0o
= 0b ( 8 In 2 )-0.• is the e -• half width
of the
assumed-Gaussian radar polar diagram.
An estimation of the aspect angle 0• can be deduced from the powers Pv and Po obtained in the vertical and oblique directions:
02s
-- 02T
/ In ( Pv
/ Po
) - 020
(3) Another measure of 0• can be derived from the spectral width C•v of the zenith beam Doppler spectra and C•b the isotropic spectral width defined by (1) from beam broadening, as02s = 020 ((C•v/C•b) -2-- 1)-' (4)
In (4), the assumption
is also
made
that the spectral
width C•v
only results
from the beam broadening
effect. When this condition is verified, the ratio C•v/C•
reaches
a maximum
value
of 1 for isotropic
scattering,
and the aspect
angle
0• tends
to infinity.
Actually,
other
spectral
broadening
factors,
such
as turbulence,
can add to C•v and give a C•v/C• value greater than 1. In that case, (4) is no more appropriate and the value of
0s is arbitrarily
set
to a large
number.
Figure
3c shows
that
this occurred
for less
than 10% of the analyzed
data. .o 15 14 • 12 :x 10 • 9 • 8 • 7 5 4 •5. 6. g. 12. 15 . --'- ß ...::: -:':- -.; ß .::!•.:-'%..-. •.,•--,:L•r.-•..:.. ., .,
ß
• ... -:*
....:•. :%.:;?
., :., •.,-•:•:• ...j:::
. ..;.......
.: ".::•:
. ...'
.:.:...:.:•:.'":½•
...::..•::-:::;. ..:.•:•-•
.... . -•....
::.-:•
.:•':•'.,.:.::...
ß
..,..
...
'•.
....
•.,' ;::::.
::....
:•::..,?;;-.•:
:.•:•::g•
..%:::..•]•:
j}•
...
f.[•..
•"::"•':.'::•
...
. ....
-.•.•..•/:•:j:.6•.•:•.
.:.,... - ::.;•
'•:•:•::::..•..•:•:•::•E[•?y/•?
r•"••
:'•;[ ... ....-.::.:.::. :: .. •:;•.;'•: •.-.•':..:' ... :•-:•" '; ... : ... :•:;.-•.(:'::' ... ' ... '" .:i: .." .: . ß :'," '-'""'•'•'•½::.- . :%.- ... • •:-::½ •;• 4 ?.-' .; . ' ' '•'•'•:•--'- :'•':, '••,••:•.:a•---.•:• .... •,?-:.: ... C• •
s' ..
:..•.v:.::;
...:• :•
...:...
)":'"::'::'":'•'•":•",-.:•.:..
: ..
. ' . • ....(b) 16 20 O0 04 08 12 16 20 O0 04 •
OSMARg5 TIME (UTC) 05HARg5V ( corrected )- V ( measured ) (M S4 )
.0 2. 4. 6. 8. 10
•5i.• •'•'• •'"l•j...
"•'",•t::,•
• [• • i •
...
....
"'i i i'•'"d
14 ... ß ... I ... '"" •:....k. .,f' -. = , ':' .:. II .... " -:'" '.:":'":".-':..;- ': ..:' • -- ..-.. '.
--
...
• 10 :-....' :.":-:•.. ... :! : :'" : ... - .;...-.::::c• .... •:•_..:...::,,".• ' 'ø" .... "• .... ...:'" . - ... ..:: .ii ::!.; ", ' '.-:•-":-::•:: ' .':'.. ::-
i'ii:,,:
:-.
7
S:';:::•
:'I•""
• a :" --:•':
.. - :::.
....
... 8
..:
:..
g *--'
i::'i-.:'
...
::
....
":'-:i::::;..-'..•..::::
! ...i
ß
,,
...
(½) ',, :zo
OII,,tAR'g,,5oo o,
IllliE (UTC),,,
oo o, oa
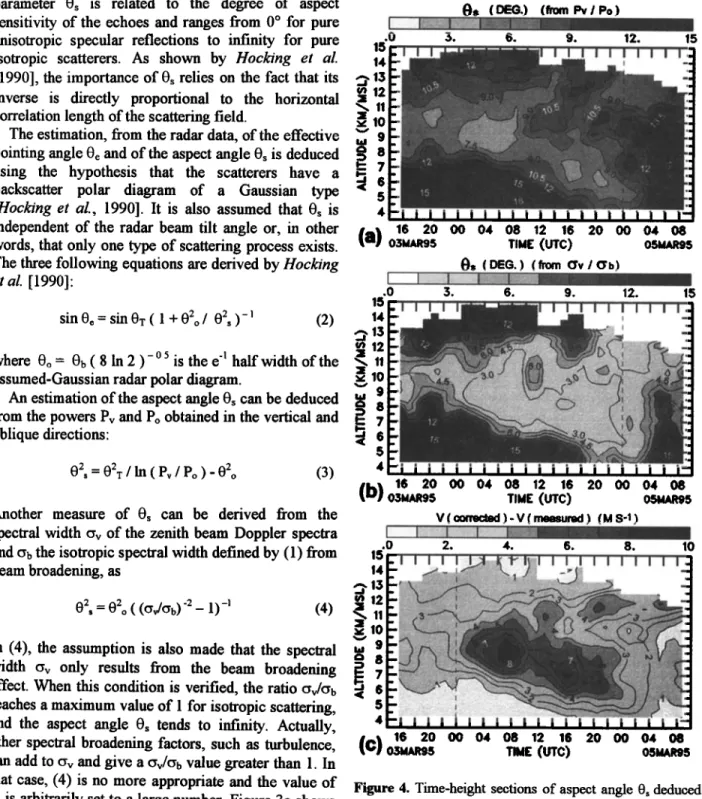
0,51•R'•5Figure 4. Time-height sections of aspect angle 0, deduced (a) from P,/Po, (b) from Ov/oh, and (c) the difference between the measured wind speed and the corrected wind speed taking into accotrot the effect of the aspect sensitivity.
674 CAMPISTRON ET AL.' VHF ASPECT SENSITIVITY IN A CUT-OFF LOW
Time-height sections of the aspect angle derived from the power ratio (equation (3)) and from the vertical spectral width (equation (4)) are presented in Figures 4a and 4b, respectively. For the clarity of the presentation, Os values greater than 20 ø are assigned to 20 ø . The morphology of the aspect sensitivity given by the aspect angle fields is, as expected, similar to that displayed by the aspect ratio sections of Figures 3b and 3c. On the basis of these figures, the transition from anisotropic specular reflections to more isotropic echoes takes place for 0s angles exceeding 10ø-15 ø. This threshold was also noted by Yoe et al. [1994] and Hooper and Thomas [ 1995].
Actually, in Figures 4a and 4b, the values of 0• making use of the oblique beam power (equation (3)) are always larger than that based on the spectral width measured at vertical incidence (equation (4)). For instance, in the region of large aspect sensitivity, at a height of 9 km at the beginning of March 4, 0• deduced from (3) reaches a value of about 7 ø, whereas 0• deduced from (4) shows value as low as 2 ø. A
similar
strong
discrepancy
between
both 0• estimates
was also observed by Hocking et al. [1990]. Using a combination of different oblique beams, these authors,
Hooper
and Thomas[1995],
and Jain et al. [1997]
found
a general
increase
of Os
with increasing
radar
observation zenith angle. The zenith angle
dependence
of the aspect
angle is explained
by
Hocking
et al. [1990]
by the simultaneous
presence
in
the radar resolution volume of different sottrees of echoes ranging from anisotropic specular structures, more sensitive to vertical beam, to isotropic scatterers that dominate the signal of oblique beams with
pointing
angles
larger
than about
10
ø. The angular
dependence
of 0•, in contradiction
with the
assumption
made
in the derivation
of equations
(3)
and (4), can explain
a large
part of the discrepancies
between the two methods of 0• evaluation.
Once the aspect angle is determined, the effective
zenith
angle
0• computed
from (2) allows
us to take
into account the aspect sensitivity effect in the retrieval of the horizontal wind velocity. In spite of the limitations of the backscattering model, Yoe et al.
[1994]
found,
in comparison
with rawinsoundings,
a
real improvement
of the wind velocity
estimation
when 0• was used in place of the nominal value 0•. Note that such corrected wind speed has been used in Figme 2a and in (1).
The time-height section of the difference between the aspect corrected and uncorrected wind speed is presented in Figure 4c. The aspect angle derived from (3) was used instead of that from (4) since it makes use of oblique and vertical information and seems more representative of a mean 0• than the value extracted from (4). On the other hand, this choice is also dictated by the satisfactory wind correction obtained by Yoe et al. [1994] using the aspect angle derived from the power ratio method. The difference
between both wind estimates reaches a maximum of
10 m s -• in a zone located in advance and beneath the jet stream core. This corresponds to an
underestimation for an uncorrected wind of about
20%. This result emphasizes the necessity to take into account the effect of aspect sensitivity in horizontal wind measurements even for a radar with a relatively large oblique beam angle (15 ø) but with a broad beamwidth (6.8ø). Unfortunately, there was no radiosounding close to the radar site able to validate these results, and the wind analyzed by the ECMWF model is, in the jet stream region, weaker than the
uncorrected radar wind.
The above results are based on the assumption of horizontal refractive index layers. Larsen and R6ttger [1991] have observed persistent refractive index layers tilted from the ground with an angle of about 1 ø. This tilt angle is comparable to the beam pointing angle offset produced by aspect sensitivity, which for Pv/Po ratios of 10 and 20 dB, are equal to 1.3 ø and 2.6 ø, respectively. A more rigorous approach of the horizontal wind correction due to aspect sensitivity needs to take into account the effect of the tilt angle of the atmospheric layers, i.e., to modify the formulation of the effective pointing angle 0• in (2). As 0• is relative to the normal of the atmospheric layers, it is a simple matter to correct it, provided the tilt angle and the azimuthal direction of the scattering layer slope
are known.
6. Temporal Evolution of Radar
Parameters at the Level of the Jet Stream Core
The analysis of aspect sensitivity is now concentrated on a particular level that crosses the most aspect-sensitive region and the core of the upper jet stream. Figure 5 presents a time series of several
CAMPISTRON ET AL.' VHF ASPECT SENSITIVITY IN A CUT-OFF LOW 675
-.8øL
I I I I I I I I I I I I I I I I I I I I I_1 3øLI I I I I .I...1
I I I I I ! I I I I I I I I
o•
•L
O0 I .,-%,%? .....•. ... ommotad
_1 25•-_,-,,
/ .... •
'\.•. /v•flioal •
--
(a) •6 20 00 o• os •2 •6 2o 00 o• os (b) •6 2o 00 o• os •2 •6 2o 00 o• os
03MAR95 TIME ('UTC•J 05MAR95 03MAR95 TIME (UTC) 05MAR9525 I I I I I I I I I I I I I I I I I I I I !/
1 I I I I I I I ! I I I I I I I I I I I '11
•,20
- I I,, .9
•15 -- I .8
o -' I
•5-
(c)
OSMAE9516
•o oo
o• os
TIME (UTC)•2 •6 •o oo
o• os
05MAR95(d•)
03MAR95•6 •o oo
o• os
TIME (UTC)•2 16
•o oo
o• os
05MAR95.7 .4 .1 .2 .5 I I I I I I I I I I I I I I I I I I I . -- .. ,,. I I I I I I I I I I I I I I I I I I I 16 20 O0 04 08 12 16 20 O0 04 08 16 20 O0 04 08; 1:2 16 :20 O0 04 08
(e) 051dAR95 TIME
(UTC)
05MAR95
(fi 05MAR95
TIME
(UTC)
05MAR95
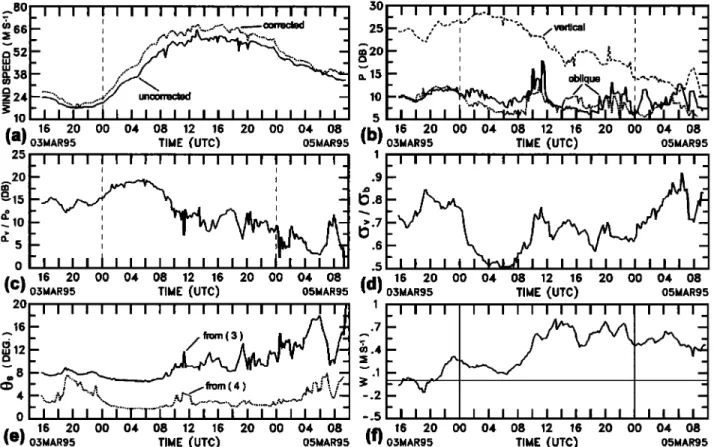
Figure 5. Time series of radar parameters obtained at a height of 9 km: (a) aspect corrected and uncorrected wind speed, (b) signal-to-noise ratio fi)r the three beams corrected for the squared range dependence, (c) aspect ratio Pv/Po, (d) aspect ratio crJCrb, (e) aspect angle 0s derived from equations (3) and (4), and (f) vertical velocity w. A 2-hour running mean was applied, and values deviating more than
twice the standard deviation were removed.
radar parameters acquired during the considered period at a height of 9 kin. A 2-hour running mean is applied to the data after removal of values deviating
more than twice the standard deviation calculated
during this 2-hour period.
As shown in Figure 5a, the wind reaches a
maximum
intensity
of about 70 m s
-• (aspect
corrected) around 1600 UTC on March 4. The
uncorrected
wind
is 8 m s
-• weaker.
The
region
of the
largest aspect sensitivity values precedes the jet stream core passage and is visible from 0000 to 1000 UTC on March 4. During that period, the maximum aspect sensitivity occurs at 0600 UTC and is characterized in Figures 5c-5e by an aspect ratio PJPo as high as 19 dB and an aspect ratio <x,/rx• of 0.5, while the values of the aspect angle 0• derived from the power and spectral width methods are of 7 ø and
2 ø, respectively. Figure 5e clearly shows that both 0• estimates follow the same general temporal trend, and, as discussed above, the aspect angle value derived from the signal power is always larger by several degrees than the estimate obtained from the vertical spectral width.
Figure 5b presents the signal power observed on the vertical beam and on the two orthogonal oblique beams. The vertical power shows a large variation of about 18 dB during this 42-hour period. On the contrary, the oblique power values oscillate around 10 dB within an interval of about 5 dB. On average, the difference between both oblique powers is close to zero. However, persistent differences, which cannot be attributed to statistical error in the measurements, are clearly apparent in at least two particular regions.
676 CAMPISTRON ET AL.: VHF ASPECT SENSITIVITY IN A CUT-OFF LOW
largest aspect sensitivity event presented above. The difference between the two oblique signals is about 2 dB and corresponds, considering the orientation of the beams, to aspect sensitivity stronger along the wind than transverse to the wind direction. The reverse is observed during about 5 hours at the time of the passage of the jet stream maximum. Such azimuthal anisotropy of the aspect sensitivity was reported by Yoe et al. [1994], Jain et al. [1997], and Tsuda et al. [1997].
The time series of the vertical velocity w measured with the zenith beam is plotted in Figure 5f. During more than 50% of the considered period w is larger than 0.4 m s -• and reaches a maximum of 0.8 m s -• around the wind maximum. A similar range of values was measured by Yoe et al. [1994] during jet stream passages. However, this radar variable has to be taken with caution since several potential sources of error
can affect this measurement. A deviation in the
vertical pointing angle of 1 ø can induce, in the
presence
of horizontal
winds of 40 m s
-•, a false
vertical
velocity
of 0.7 m s
-• which
is comparable
to
the observed values. An equivalent effect arises, in conjunction with aspect sensitivity, from the atmospheric refractivity layer tilted from the horizontal. As mentioned earlier, tilt angles of the order of 1 ø were measured by Larsen and ROttger [ 1991 ] with a VHF interferometric method.
During the passage overhead of the strong aspect sensitivity region, between 0000 and 1000 UTC on March 4, the vertical velocity (Figure 5f) decreases
regularly
down to a minimum
of 0.1 m s
-• at 0600
UTC, coincident with the maximum of aspect sensitivity in Figure 5d, and increases afterward. The same temporal trend can be seen in the aspect sensitivity evolution displayed in Figure 5d. The evident similarity in the behavior of these two parameters during a period of 10 hours may not be a simple coincidence, especially when remembering that this period is also associated with a persistent azimuthal anisotropy. The presence of tilted refractivity layers seems a good candidate to explain these observations. The same suggestion was made by Larsen et al. [1991] to explain the persistent discrepancy over several hours between the vertical velocity measured from the vertical beam and the one indirectly derived from the combination of radial velocity measurements provided by several oblique
beams
7. Spatial Distribution of the Aspect
Sensitivity Fields
During this cut-off low event, the other four VHF radars of the network were in operation. The CRA radar selected for this study, well positioned in the margin of the cut-off low, offered the best and most continuous description of the aspect sensitivity fields. The others radars were either outside of the interesting atmospheric region and/or collected the data during discontinuous short time periods due to instrumental malfunctions. After inspection of this data set, we have selected, for an analysis of the spatial extent of the aspect sensitivity fields, a 10-hour period of
common observation of the CRA radar and of the
VHF radar located in Toulouse (hereinafter referred to as the TLSE radar). This best comparison period goes
from
2200
UTC, Mdrch
4 until
0800
UTC, March
5,
1995. As mentioned in section 2, both radars have
identical technical characteristics and use the same
off-line editing software.
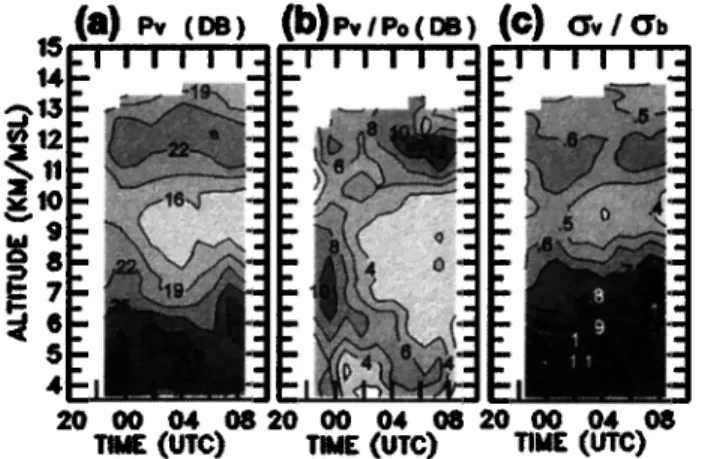
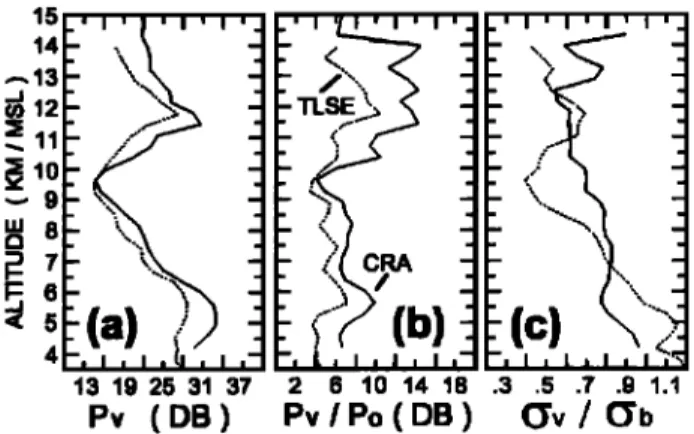
Figure 6 displays, for the selected period, the time- height sections of P,•, P,/Po, and c•,/C•b provided by the TLSE radar. Time-averaged vertical profiles over this period of these three parameters obtained by the two radars are presented in Figure 7. The radar fields of Figure 6 compare well with those in Figure 3 derived
TIME (UTC) TIME (UT½) TIME
Figure 6. Time-height sections of parameters observed by the VHF radar located in Toulouse during the period from
2200 UTC, March 4 to 0800 UTC, March 5, 1995: (a)
vertical echo power Pv (decibels relative to an arbitrary reference power level); (b) vertical to oblique echo power ratio Pv/Po (decibels); and (c) normalized vertical spectral
width (xv/(Xb. The gray scale is the same as that used •n Figure 3.
CAMPISTRON ET AL.' VHF ASPECT SENSITIVITY IN A CUT-OFF LOW 677 15 14 ,-,13 • 12 •;11
'1'1'1'1'
1
•10 .•9 "• 8 • ?;
(b) (½)
(a)
4 13 19 25 31 37 2 6 10 14 18 .3 .5 .7 .9 1.1 Pv ( DB ) Pv I Po ( DB ) C•v / C•t• Figure 7. Time-averaged vertical profiles, over the 10-hour period considered in Figure 6, of parameters measured bythe CRA radar (solid lines) and the TLSE radar (dotted
lines): (a) vertical echo power Pv (decibels relative to an arbitrary reference power level); (b) vertical to oblique echo power ratio Pv/Po (decibels)' and (c) normalized vertical
spectral width •v/•b.
by the CRA radar. The enhancement of the vertical backscattered power Pv in the tropopause region is seen by both radars around 12 km altitude. The
vertical evolutions of Pv for these two instruments are
also very close in Figure 7a. The descending branch of higher Pv/Po values observed by the CRA radar (Figure 3b) is also marked in Figure 6b. The TLSE radar has only observed the extremity of this branch, which extends in Figure 6b from an altitude of about 7
km at 2200 UTC on March 4 down to 4 km altitude at
about 0600 UTC, March 5. The vertical profiles in Figure 7b show a similar evolution of Pv/Po with height, but TLSE radar have always observed weaker values of this index of aspect sensitivity. The comparison is not as good for C•v/C•b (Figures 3c and 6c). In Figure 7c, there is a relatively large deviation between the measurements by the two radars of this parameter. The TLSE radar presents larger values of C•v/C• at low altitude between 4 and 7 km and smaller
values at middle altitude from 7 to 11 kin. Since the
comparison with Pv/Po or Pv is relatively satisfactory, the cause of the discrepancy obtained with C•v/C• is unclear. It might result from inaccuracies in the measurement of the vertical spectral width c• due, for instance, to the effect of ground clutter imperfectly removed. On the other hand, this parameter is sensitive to small-scale turbulence, and a different turbulence regime at the vertical of the radars might explain part of the observed discrepancies.
When each radar section of Figure 3 is superposed on each corresponding section of Figure 6, the best visual correlation is obtained when TLSE images are shifted by a negative time lag of about 4 hours. A similar result is also obtained with a comparison of the wind field time-height sections. This indicates that the TLSE radar has observed the same atmospheric feature as the CRA radar but with a delay of approximately 4 hours. This comparison made with closely spaced radars brings some insight into the spatial distribution and coherence time of the aspect sensitivity structure, which can be useful in the understanding of the physical process responsible of the anisotropic specular echoes.
8. Conclusion
In this paper, we have examined the aspect sensitivity of VHF radar echoes, through the analysis of the vertical signal enhancement and the narrowing of the vertical spectral width, during a jet stream passage associated with a cut-off low. The goal of this study was to assess the potentiality of a VHF wind profiler to investigate the interactions between stratospheric and tropospheric air. In past studies (several are quoted in the text), large aspect sensitivities have mainly been observed in the lower stratosphere. In the present case study, large aspect sensitivity occurred in about two thirds of the middle and upper troposphere during the 42-hour period analyzed. As shown by the analysis of the ECMWF model, strong aspect sensitivity regions were found to be associated with the tropopause and a tropopause fold, indicating an intrusion of stratospheric air. However, there was a discrepancy between the location of these peculiar atmospheric zones given by the radar and by the numerical model. Particularly, the tropopause fold observed by the radar appears deeper. This result emphasizes the interest in conjointly using numerical model outputs and wind profiler products in order to get a better understanding of the vertical transfers between the stratosphere and the troposphere.
Owing to the aspect sensitivity effect, the underestimation of the horizontal wind speed was found to reach 20% of the nominal value. This points out that even for a radar with a relatively large oblique beam angle (15 ø) but with a broad beam width (6.8ø), aspect sensitivity can be, in certain circumstances, an important source of error that requires to be detected
678 CAMPISTRON ET AL.: VHF ASPECT SENSITIVITY IN A CUT-OFF LOW
and corrected. Among the results obtained in this work, which confirm some past observations, is the presence of azimuthal anisotropy over a long period of time and a connection between strong aspect sensitivity and vertical velocity, which might indicate a possible source of error in the measurement of this most important atmospheric parameter. Finally, a comparison of simultaneous observations of two closely spaced VHF radars (100 kin) have showed a good spatial coherence of the aspect sensitivity
structures.
Acknowledgments. This work was funded by both
PNCA and PATOM programs of the Institut des Sciences
de l'Univers (INSU), which is part of the French Centre National de la Recherche Scientifique (CNRS). The authors acknowledge all the scientific and technical teams of the laboratories involved in the ESTIME experiment: CETP,
SA/OHP, LA/OMP, CNRM, LSEET, and LAMP/OPGC.
References
Campistron, B., Retrieval of the 3D kinematics from a
regional network of wind profilers, in Proceedings of the 28th Conference on Radar Meteorology, Am. Meteorol.
Soc., Boston, Mass., pp. 83-84, 1997.
Chu, Y.H., J.K. Chao, C.H. Liu, and J. ROttger, Aspect sensitivity at tropospheric heights measured with a vertically pointed beam of the Chung-Li VHF radar,
Radio Sci., 25, 539-550, 1990.
Doviak, R.J., and D. Zmic', Reflection and scatter formula
for anisotropically turbulent air, Radio Sci., 19, 325-336,
1984.
Gage, K.S., and J.L. Green, Evidence for specular reflection from monostatic VHF radar observations of the stratosphere, Radio Sci., 13, 991 - 1001, 1978.
Gage, K.S., B.B. Balsley, and J.L. Green, Fresnel scattering model for the specular echoes observed by VHF radar, Radio Sci., 16, 1447-1453, 1981.
Hildebrand, P.H., and R.S. Sekhon, Objective determination of noise level in Doppler spectra, d. Appl. Meteorol., 13,
808-811, 1974.
Hocking, W.K., Recent advances in radar instrumentation and techniques for studies of the mesosphere, stratosphere, and troposphere, Radio Sci.,32, 2241-2270,
1997.
Hocking, W.K., and A.M. Hamza, A quantitative measure of the degree of anisotropy of turbulence in terms of atmospheric parameters, with particular relevance to radar studies, d. Atmos. Terr. Phys., 59, 1011-1020,
1997.
Hocking, W.K., R. Riister, and P. Czechowsky, Absolute
reflectivities and aspect sensitivities of VI-tF radio wave
scatterers measured with the Sousy radar, d. Atmos. Terr. Phys., 48, 131-144, 1986.
Hocking, W.K., S. Fukao, T. Tsuda, M. Yamamoto, T. Sato, and S. Kato, Aspect sensitivity of stratospheric VHF radio wave scatterers, particularly above 15-km
altitude, Radio Sci., 25, 613-627, 1990.
Hooper, D., and L. Thomas, Aspect sensitivity of VHF scatterers in the troposphere and stratosphere from
comparisons of powers in off-vertical beams, d. Atmos. Terr. Phys., 57, 655-663, 1995.
Jain, A. R., Y. Jaya Rao, and P. B. Rao, Aspect sensitivi .ty of the received radar backscatter at VHF: Preliminary observations using the Indian MST radar, Radio Sci., 32,
1249-1260, 1997.
Larsen, M.F., and J. ROttger, VI-tF measurements of in- beam incidence angles and associated vertical-beam radial velocity corrections, d. Atmos. Oceanic Technol.,
8, 477-490, 1991.
Larsen, M.F., S. Fukuao, O. Amga, M.D. Yamamaka, T. Tsuda, and S. Kato, A comparison of VHF radar vertical-
veloci .ty measurements by a direct vertical-beam method
and by a VAD technique, d. Atmos. Oceanic Technol., 8,
766-776, 1991.
Luce, H., M. Crochet, F. Dalaudier, and C. Sidi,
Interpretation of VI-tF ST radar vertical echoes from in situ temperature sheet observations, Radio Sci., 30, 1003- 1025, 1995.
Rottger, J., Reflection and scattering of VHF radar signals from atmospheric refractivity structures, Radio Sci., 15,
259-276, 1980.
ROttger, J., and C.H. Liu, Partial reflection and scattering of VI-tF radar signals from the clear atmosphere, Geophys.
Res. Lett., 5, 357-360, 1978.
ROttger, J., P. Czechowsky, and G. Schmidt, First low power VI-tF radar observation of tropospheric,
stratospheric and mesospheric winds and turbulence at
Arecibo Observatory, d. Atmos. Terr. Phys., 43, 789-800,
1981.
Sloss, P. W., and D. Atlas, Wind shear and reflectivity
gradient effects on Doppler radar spectra, J. Atmos. Sci.,
25, 1080-1089, 1968.
Tatarskii, V.I., Wave Propagation in a Turbulent Medium, Mc Gnaw-Hill, New York, 285 pp., 1961.
Tsuda, T., T. Sato, K. Hirose, S. Fukao, and S. Kato, MU radar observations of the aspect sensitivity of backscattered VI-tF echo power in the troposphere and lower stratosphere, Radio Sci., 21, 971-980, 1986. Tsuda T., W.E. Gordon, and H. Saito, Azimuth angle
variations of specular reflection echoes in the lower atmosphere observed with the MU radar, d. Atmos. Sol.-
Terr. Phys., 59, 777-784, 1997.
Waterman, A. T., T. Z. Hu, P. Czechowsky, and J. Rottger, Measurement of anisotropic permittivity structure of
CAMPISTRON ET AL.: VHF ASPECT SENSITIVITY IN A CUT-OFF LOW 679
upper troposphere with clear-air radar, Radio Sci., 20,
1580-1592, 1985.
Woodman, R. F., and. Y. H. Chu, Aspect sensitivity
measurements of VHF backscatter made with the Chung-
Li radar: Plausible mechanisms, Radio Sci., 24, 113-125, 1989.
Yoe, J. G., P. Czeckowsky, R. Raster, and G. Schmidt, Spatial variability of the aspect sensitivity of VHF radar echoes in the troposphere and lower stratosphere dudlag jet stream passages, Ann. Geophys., 12, 733-745, 1994.
B. Campistron, F. Lohou, and J.P. Pages, Centre de
Recherches Atmosph6riques, 65300 Campistrous, France. (e-mail: camb•aero.obs-mip.fr)
Y.B. Pointin, Laboratoire de M6t6orologie Physique,
Universit6 Blaise Pascal, 24 avenue des Landais, 63177
Aubibre, France. (e-mail: pointin•opgc.tmiv-
bpclermont. fr)
(Received March 11, 1998; revised November 17, 1998;