HAL Id: hal-01671399
https://hal-univ-rennes1.archives-ouvertes.fr/hal-01671399
Submitted on 31 Jan 2018HAL is a multi-disciplinary open access archive for the deposit and dissemination of sci-entific research documents, whether they are pub-lished or not. The documents may come from teaching and research institutions in France or abroad, or from public or private research centers.
L’archive ouverte pluridisciplinaire HAL, est destinée au dépôt et à la diffusion de documents scientifiques de niveau recherche, publiés ou non, émanant des établissements d’enseignement et de recherche français ou étrangers, des laboratoires publics ou privés.
Diffusional kurtosis imaging (DKI) incorporation into an
intravoxel incoherent motion (IVIM) MR model to
measure cerebral hypoperfusion induced by
hyperventilation challenge in healthy subjects
Aude Pavilla, Giulio Gambarota, Alessandro Arrigo, Mehdi Mejdoubi, Regis
Duvauferrier, Hervé Saint-Jalmes
To cite this version:
Aude Pavilla, Giulio Gambarota, Alessandro Arrigo, Mehdi Mejdoubi, Regis Duvauferrier, et al.. Diffusional kurtosis imaging (DKI) incorporation into an intravoxel incoherent motion (IVIM) MR model to measure cerebral hypoperfusion induced by hyperventilation challenge in healthy subjects. Magnetic Resonance Materials in Physics, Biology and Medicine, Springer Verlag, 2017, 30 (6), pp.545-554. �10.1007/s10334-017-0629-9�. �hal-01671399�
Diffusional Kurtosis Imaging (DKI) incorporation into Intravoxel Incoherent Motion (IVIM) MR model to measure cerebral hypoperfusion induced by hyperventilation challenge in healthy subjects
Aude Pavilla1,2,3, Giulio Gambarota1,2, Alessandro Arrigo,3 Mehdi Mejdoubi3, Régis
Duvauferrier3, Hervé Saint-Jalmes1,2,4
1 INSERM, UMR 1099, Rennes, F-35000, France
2 Université de Rennes 1, LTSI, Rennes, F-35000, France
3 Department of Neuroradiology, Pierre-Zobda-Quitman Hospital, University Hospital of
Martinique, French West Indies, France
4 CRLCC, Centre Eugène Marquis, Rennes, F-35000, France
Corresponding author: Aude Pavilla, MSc
Department of Neuroradiology,Pierre-Zobda-Quitman Hospital,
University Hospital of Martinique, French West Indies.
Tel: +596 596 55 21 81; Fax: +596 596 75 16 68
email: aude.pavilla@gmail.com
Word count of abstract and text: 200 (abstract) ; 3597 (text)
Number of figures and tables: 4 figures and 4 tables
Number of references: 38
Acknowledgments
This study was supported by the Conseil Scientifique et Méthodologique (CSM) of the
Abstract
Object: To investigate the diffusional kurtosis imaging (DKI) incorporation into the
intravoxel incoherent motion (IVIM) model for measurements of cerebral hypoperfusion in
healthy subjects.
Materials and Methods: Eight healthy subjects underwent a hyperventilation challenge with
a four-minute diffusion weighted imaging (DWI) protocol, using 8 b-values chosen with the
Cramer-Rao-Lower-Bound optimization approach. Four regions of interest in gray matter
(GM) were analyzed with the DKI-IVIM model and the bi-exponential IVIM model, for
normoventilation and hyperventilation conditions.
Results: A significant reduction in the perfusion fraction (f) and in the product fD* of the
perfusion fraction with the pseudodiffusion coefficient (D*) was found with the DKI-IVIM
model, during the hyperventilation challenge. In the cerebellum GM, the percentage changes
were f:-43.7±40.1, p=0.011 and fD*:-50.6±32.1, p=0.011; in thalamus GM, f:-47.7±34.7,
p=0.012 and fD*:-47.2±48.7, p=0.040. In comparison, using the bi-exponential IVIM model
only a significant decrease in the parameter fD* was observed for the same regions of interest.
In frontal-GM and posterior-GM, the reduction in f and fD* did not reach statistical
significance, either with DKI-IVIM or the bi-exponential IVIM model.
Conclusion: When compared to the bi-exponential IVIM model, the DKI-IVIM model
displays a higher sensitivity to detect changes in perfusion induced by the hyperventilation
condition.
Keywords: Diffusion magnetic resonance imaging, perfusion, hyperventilation, intravoxel
Introduction
The IntraVoxel Incoherent Motion (IVIM) is a magnetic resonance imaging (MRI) method
that enables for the simultaneous assessment of diffusion and perfusion [1]. In this model [2],
the total signal decay obtained by diffusion-weighted imaging (DWI) incorporates a vascular
compartment in addition to the pure diffusive compartment (characterized by the diffusion
coefficient D). The vascular component arises from the molecules of water in the blood
capillaries that mimic a pseudo-diffusion process characterized by the pseudo-diffusion
coefficient D*. The perfusion fraction f is another IVIM-derived parameter that represents the
capillary vascular volume fraction.
The IVIM method has been applied to several body organs [3–5]; a number of studies on the
human brain have also emerged in the last few years. A linear relationship between the
perfusion fraction f and the cerebral blood volume (CBV) has been reported [6–8], in
particular in gray matter [9].
In the standard IVIM model, here referred to as the “bi-exponential IVIM”, the signal decay
at different values of diffusion weighting (b-values) can be described with a bi-exponential
function. The bi-exponential IVIM model describes the pure diffusive contribution to the total
signal decay with a mono-exponential function. However, acquisitions at higher b-values
(b>1000 s/mm2) reveals a deviation from a mono-exponential curve [10]. Accordingly, such
non-Gaussian effects when the diffusion is restricted/hindered have been investigated with
more sophisticated diffusion models, namely, the bi-exponential diffusion model [11, 12], the
continuous diffusion compartments [13] or the diffusional kurtosis imaging (DKI) [14]. DKI
is based on a mathematical approach that uses a polynomial model with a dimensionless
factor called the kurtosis (K). This coefficient is a measure of the deviation from Gaussian
DKI model has been shown to be robust for parameter quantification and its application has
been successfully investigated in previous diffusion studies [16–18]. The incorporation of
DKI into the IVIM model (DKI-IVIM model) is of great interest for both perfusion and
diffusion characterization. In recent studies, the DKI-IVIM model has been applied to clinical
investigations of neck nodal metastases and brain tumours[19, 20]; furthermore, in healthy
volunteers, De Luca et al. [21]performed a detailed analysis of the changes of the DKI-IVIM
parameters with perfusion, in calf muscle.
In the current study, we sought to investigate whether non-Gaussian diffusion behavior could
be identified and quantified by the DKI-IVIM analysis in the specific context of a
hyperventilation challenge for perfusion measurements in brain. Specifically, the
hyperventilation challenge [22–24] is well known to induce a decrease of cerebral blood
volume and blood flow (CBV and CBF, respectively). In a previous study [25], the effects of
a similar challenge (which used inhaled gases) on the perfusion fraction f and on the product
fD* were investigated with the bi-exponential IVIM model. Thus, in the current study we
compared the DKI-IVIM model with the bi-exponential IVIM model in order to identify the
most suitable method for detecting perfusion changes, as those that might occur in pathologies
such as ischemic stroke. The IVIM-relevant sequence parameters (i.e., the b-values) were
optimized using a Cramer-Rao Lower Bound (CRLB) analysis [26], in order to obtain a scan
time compatible with clinical examination procedures.
Thus, the overall aim of this study was to assess the ability of the DKI-IVIM model to detect
changes in cerebral perfusion in comparison with the standard bi-exponential IVIM model, in
Materials and methods
MR imaging
This study was approved by the local institutional review board. Eight healthy volunteers (3
women, 5 men; age years) were recruited. MR imaging was performed on a 1.5-T
clinical system (Optima MR 450, GE Healthcare, Waukesha, WI, USA) equipped with an
eight-channel head coil. Since no specific IVIM protocol for the quantification of cerebral
perfusion was provided by the vendor, we designed an optimized IVIM protocol using the
vendor-supplied DWI sequence. DWI images were acquired using a single-shot spin-echo
echo-planar imaging sequence with the diffusion-weighted gradients (δ/Δ= 36/47 ms) along
three orthogonal directions and with the following parameters : ASSET factor = 2, repetition
time/echo time (TR/TE) = 3000/75 ms, field of view (FOV) = 250 x 250 mm2, matrix size =
128 x 128, in-plane resolution = 1.95 x 1.95 mm2, 27 slices with a slice thickness of 4 mm
without gap, bandwidth = 3906 Hz.
A CRLB analysis was performed to determine the optimal set of b-values required to extract,
with the best precision: 1) f, D* and D for the bi-exponential IVIM model and 2) f, D*, D and
K for the DKI-IVIM model. We introduced for each model a figure of merit that takes into
account the standard deviation of each parameter. The figures of merit were written as :
and for the
bi-exponential IVIM model and the DKI-IVIM model, respectively; are the
CRLB computed values while f, D*, D and K represent the target values of these parameters.
The minimization procedure of the figure of merit was performed numerically using
Mathematica (Wolfram Research Champaign, IL, USA). The target values were chosen in
Although a minimum of 4 b-values and 5 b-values was required for the bi-exponential IVIM
model and the DKI-IVIM model, respectively, this minimum was increased to eight b-values
to improve precision, while keeping the scan time suitable for clinical applications. Finally,
the optimum b-values set obtained through this procedure was: 0, 60, 80, 300, 400, 900, 1000
and 1500 s/mm2. The maximum b-value was chosen to ensure adequate SNR for
quantification in both grey and white matter [20]. The total acquisition time of the IVIM MR
sequence was 4 min. Furthermore, for segmentation purposes T1-weighted anatomical images
were acquired with a 3D gradient echo acquisition (TR /TE =10.8/ 4.4 ms, inversion
time = 500 ms).
Hyperventilation challenge
The first IVIM measurement was performed while the subject breathed normally
(normoventilation condition, NV). Then, the hypocapnia condition was achieved through
hyperventilation, with the aid of metronome beeps played over the headphones to pace the
subject’s breathing twice as fast as in NV condition [28]. During this hyperventilation
challenge, the CO2 respiratory levels and the ventilation rate were continuously monitored
using a nasal cannula; a gas sampler/analyzer displayed the end-tidal partial pressure of CO2
(PETCO2) in mmHg and the ventilation rate in breaths per minute. Once the subject was in a
stationary condition (hyperventilation condition, HV), a second IVIM measurement was
performed. The PETCO2 and ventilation rate were measured each minute during the IVIM
acquisitions in both NV and HV conditions, to ensure the efficiency of the hyperventilation
challenge. Values of PETCO2 were used as an indirect measure of the arterial partial pressure
Image Processing
MR images were transferred to an independent workstation for post-processing. For each
subject, the T1-weighted anatomical images were voxel-wise segmented into to gray matter
(GM), white matter (WM), and cerebrospinal fluid (CSF) probability maps using the FAST
(FMRIB’s Automated Segmentation Tool) tool in FSL (FMRIB Software Library, Oxford,
UK). A gray matter mask was created at a threshold of 0.9 to mitigate partial volume effect
with WM and CSF. The diffusion-weighted images in NV conditions and the gray matter
mask were first co-registered together. Four regions of interest (ROIs) were drawn in the
cerebellum GM, the thalamus GM, the frontal GM and the posterior GM. Then, the same
co-registration procedure was applied to diffusion-weighted images in HV condition and the four
ROIs were copied to these images for subsequent comparison and analysis.
The IVIM analysis was subsequently performed with in-house MATLAB scripts (MATLAB
2016a, MathWorks, Natick, MA, USA) based on the nonlinear least-square fitting method
with the Trust-Region algorithm.
The bi-exponential function in the conventional IVIM model is given by the expression :
[1]
where S(b) and S0 are the signal obtained with and without (b=0s/mm2) diffusion encoding,
respectively.
The DKI-IVIM model is described by the equation :
[2]
where K is the Kurtosis factor that quantifies the deviation from the Gaussian behavior. K=0
The direct fitting method that estimates all IVIM parameters simultaneously has been shown
to provide limited reliability and precision due to limited number of samples, noise and
non-linearity as reported in other IVIM studies [4, 29]. For this reason, a “segmented” technique
considering the diffusion signal at high and low b-values separately was used to analyze the
IVIM data [30, 31]. The segmented algorithm consisted of three steps. First, since D* is
significantly greater than D, the effect of D* on the signal can be considered negligible when
b-values are large enough (typically, for b-values greater than 300 s/mm2 ). Thus D and K
were obtained by fitting the signal (b-values > 300 s/mm2 ) to the function:
[3]
for the bi-exponential IVIM model, and to the function:
[4]
for the DKI-IVIM model.
In both cases, is the intercept of the normalized diffusion-related signal (b > 300 s/mm2)
with the y-axis (in other terms, the normalized value of the signal at b = 0 s/mm2 if no
pseudo-diffusion component was present). In the second step, for both models the perfusion
fraction was computed as: . Finally, the Trust-Region algorithm was used to
determine the value of the pseudo diffusion coefficient D* based on Eq. [1] for bi-exponential
IVIM model and Eq. [2] for DKI-IVIM model, using all data points and the values
determined for D (D and K, for DKI-IVIM model) and f. The parameter fD*, which has been
associated to the blood-flow [8], was obtained by scalar multiplication.
For non-physiologically acceptable values of f (close to 1), that may reflects undetectable
perfusion (vascular component vanishing), the perfusion fraction was set to zero while D*
Data analysis and statistical analysis
In order to compare the curve fitting results obtained with the bi-exponential IVIM and
DKI-IVIM models, the Akaike Information Criterion (AIC) was used [32]:
[5]
where N is the sample size (number of points), SS is the sum of squared deviations and k the
number of estimated parameters. The formula of the AIC value shows that the Akaike
information criterion takes into account the goodness of the fit as well as the complexity of
the model. The model with the lower AIC value is the preferred model. Therefore, for a given
fit, the AIC difference between the two models was computed as follows:
; given the above definition, a positive value
indicates that the DKI-IVIM model is preferred over the bi-exponential IVIM; whereas a
negative value indicates that the bi-exponential IVIM model is preferred over the
DKI-IVIM model.
A paired Student t-test was performed to determine the statistical differences between NV and
HV conditions for all the estimated IVIM parameters with both IVIM models. A significant
Results
The efficiency of the hyperventilation challenge was validated by a significant decrease of the
end-tidal partial pressure of CO2 (PETCO2), from the normoventilation to the hyperventilation
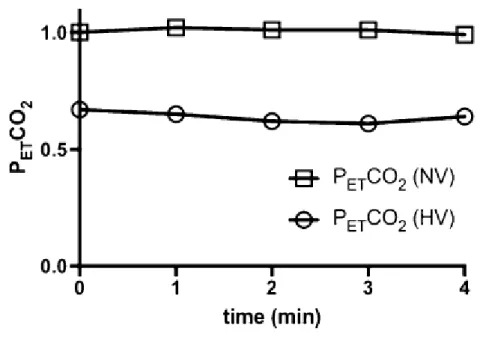
condition (p < 0.0001). Figure 1 shows the PETCO2 levels during the IVIM protocol in both
conditions. It is also noteworthy that the PETCO2 levels remained stable during both IVIM
measurements.
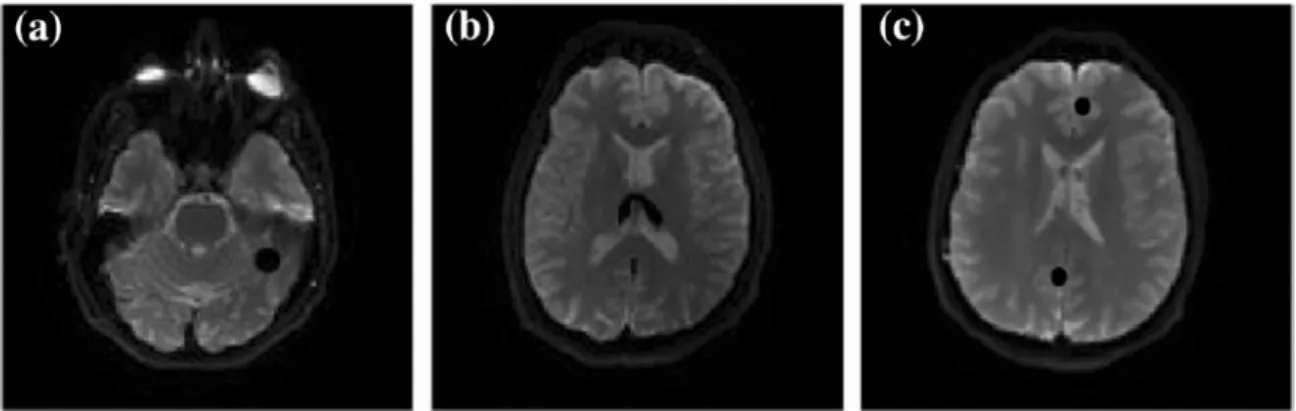
Figure 2 shows an example of axial IVIM images (b = 80 s/mm2) in one volunteer (subject
no. 5 in Table 3 and Table 4: male, 35 years old) with the ROIs in the cerebellum GM,
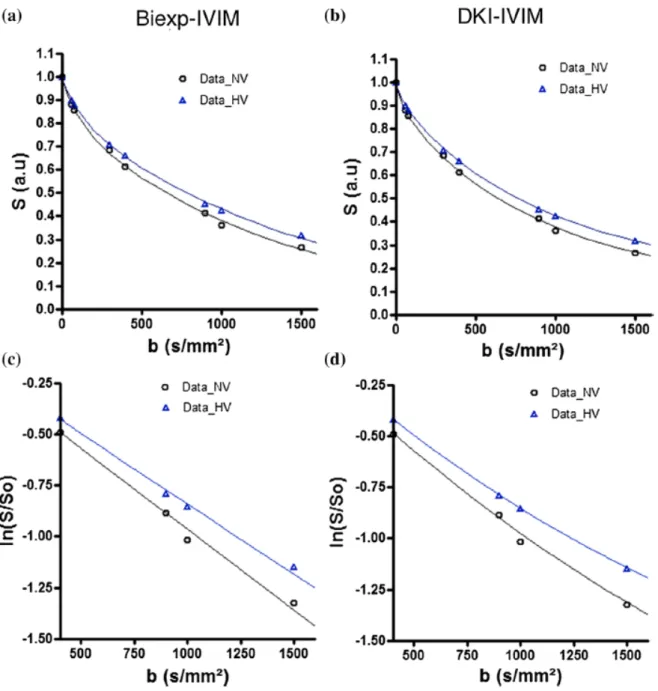
thalamus GM, posterior and frontal GM. In Figure 3, the plot of the signal intensity as a
function of the b-values from the same volunteer, for the thalamus GM ROI under
normoventilation (NV) and hyperventilation (HV), is presented. The bi-exponential IVIM
(Figure 3a) and DKI-IVIM (Figure 3b) curve fit is represented by the solid lines, for each
ventilatory condition. The effect of the hyperventilation challenge on the perfusion can be
revealed by visual inspection. Indeed, while the slope between b = 300 s/mm2 and b = 1500
s/mm2, which is proportional to the diffusion coefficient D,did not differ between NV and
HV conditions, the slope between b = 0 s/mm2 and b = 300 s/mm2, which is proportional to
the blood-flow related IVIM parameter fD*, decreased under HV condition with both IVIM
models. Moreover, the y-intercept of the line fitted between b = 300 s/mm2 and b = 1500
s/mm2 was higher for the HV condition; this means that the perfusion fraction f in the HV
condition was smaller than in the NV condition, as expected during a hyperventilation
challenge, where the cerebral blood volume and flow are reduced. This observation was
common to the two IVIM models investigated. On the other hand, when looking closer at the
curve fit of the signal between b = 300 s/mm2 and b = 1500 s/mm2, in Figure 3c and 3d, a
condition could be noted. These findings were further supported by the analysis based on
Aïkake Information Criterion, which showed that the DKI-IVIM model was the more
appropriate model to fit the data for both ventilatory conditions. As a matter of fact, the value
(averaged over all ROIs, in both ventilatory conditions and for all volunteers) was
significantly greater than zero (p < 0.0001).
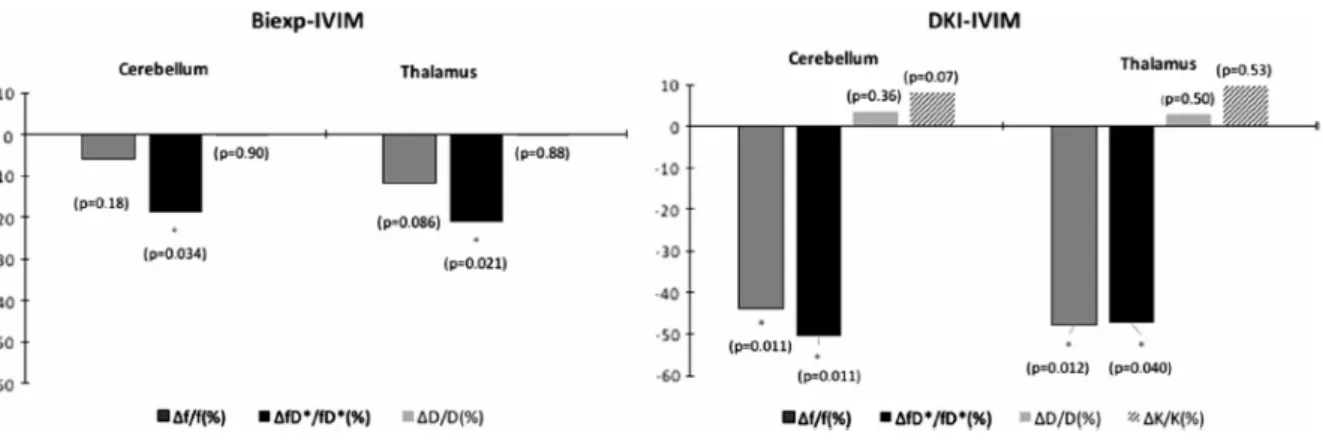
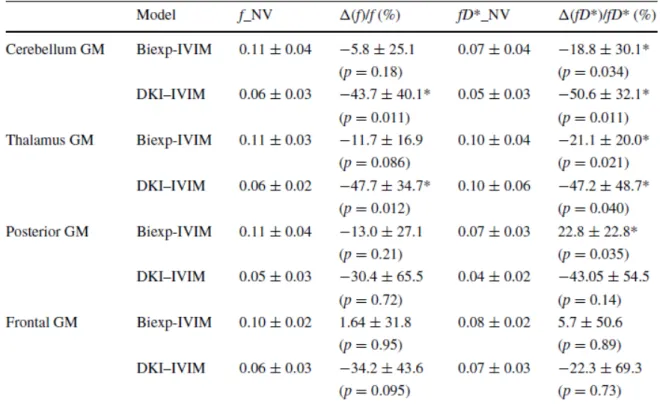
The changes in the IVIM parameters induced by the hyperventilation were estimated using
the two models. The statistics of the changes in the perfusion parameters f and fD*, averaged
over all volunteers in the four ROIs, is summarized in Table 1. Table 2 summarizes the
changes in the diffusion parameters D and K. We observed a reduction of f and fD* when the
volunteers hyperventilated, with both the bi-exponential IVIM and the DKI-IVIM model, in
the cerebellum and thalamus GM ROIs. Concerning the perfusion fraction f, the differences
were most statistically significant with a - 43.7% change in the cerebellum GM (p = 0.011)
and a - 47.7 % change in the thalamus GM (p = 0.012), with the DKI-IVIM model, as also
shown in Figure 4. The blood-flow related IVIM parameter fD* significantly decreased in the
cerebellum GM and thalamus GM ROIs, as assessed by the bi-exponential IVIM analysis.
The DKI-IVIM model led to the same conclusion but displayed a higher sensitivity, in
comparison to the bi-exponential IVIM model, to detect changes in fD* for those two ROIs.
On the other hand, in frontal and posterior GM, the reduction in f and fD* did not reach
statistical significance, either with DKI-IVIM or the bi-exponential IVIM model. An
abnormal increase in fD* was observed with the bi-exponential IVIM model in posterior GM.
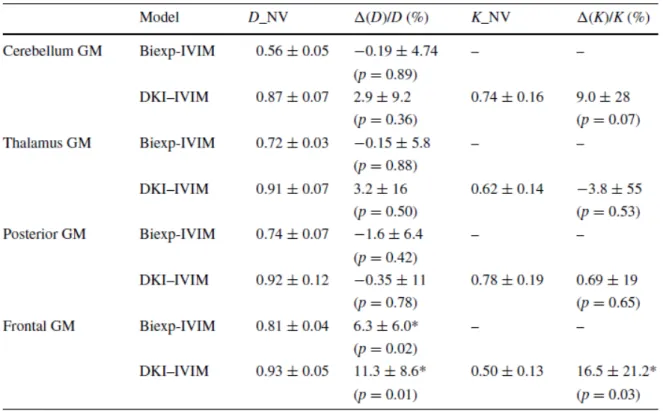
No significant changes in the diffusion parameters D and K (DKI-IVIM model) and D
(bi-exponential IVIM) were observed during the hyperventilation challenge, with the exception of
the frontal GM that exhibited a slight significant increase.
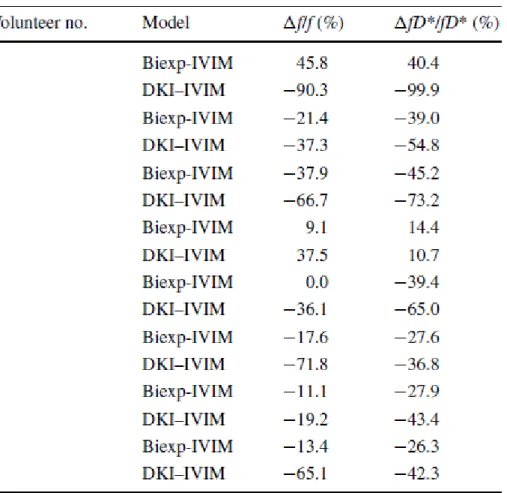
Table 3 shows the changes in f and fD* for each volunteer in the cerebellum ROI, chosen
DKI-IVIM model in all volunteers, with the exception of the volunteer no. 4. The
bi-exponential IVIM model yielded a decrease of f and fD* in all volunteers but no. 1, 4 and 5.
Furthermore, the decrease observed in f and fD* with the bi-exponential IVIM model was
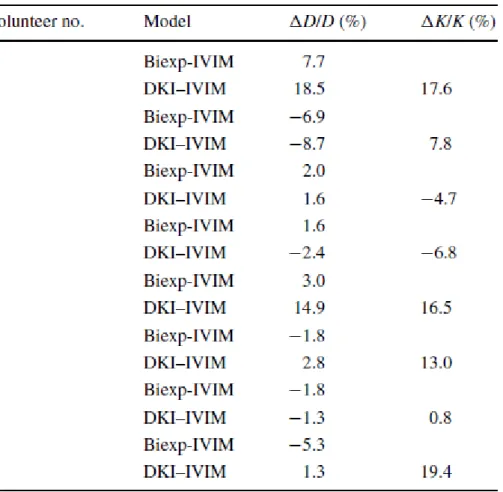
substantially smaller than that observed with the DKI-IVIM model. In Table 4, the changes in
D and K, induced by the hyperventilation challenge, are shown for each volunteer in the
cerebellum ROI. The changes in D and K were much smaller than the changes observed in f
Discussion
In the current study, IVIM diffusion decays were acquired in eight healthy volunteers in
normo- and hyper-ventilation conditions; this latter condition is known to induce cerebral
hypoperfusion, thus mimicking a physiological event that might occur in a number of
pathologies. Two models were investigated to analyze the IVIM diffusion decays: the
“standard” bi-exponential IVIM model and the DKI-IVIM model. The DKI-IVIM model
appeared to be the better model, based on the Aïkake Information Criterion and on the higher
sensitivity to detect the changes in perfusion induced by the hyperventilation condition.
A significant reduction in both f and fD* was found with the DKI-IVIM model during the
hyperventilation challenge in the cerebellum and thalamus GM ROIs. A trend toward
reduction of f and fD* for the frontal and posterior GM ROIs was also observed.
In comparison, using the bi-exponential IVIM model, only a significant decrease in fD* was
observed in the cerebellum and thalamus GM ROIs. In posterior GM, the abnormal increase
in fD* could be due to partial volume confounding effects, arising from both white matter and
cerebro-spinal fluid contamination. In general, it is noteworthy that the frontal and posterior
GM ROIs exhibit moderate-to-severe confounding effects of partial volume, despite the
segmentation procedure, due to their location. Averaged over all volunteers, the perfusion
parameters estimated in these ROIs showed a larger variance, compared to the cerebellum and
the thalamus; similar observations were also reported in a previous study [25].
The bi-exponential IVIM model allows for the simultaneous quantification of the water
diffusion and of the perfusion in the capillary microcirculation. With respect to the water
diffusion, this model does not consider the non-Gaussian behavior related to
restricted/hindered diffusion, which might play an important role at higher b-values. The DKI
diffusion [14]; it has been widely explored this last decade providing encouraging results for
improved tissue characterization [16–18]. However, the DKI method implementation and its
extension to IVIM requires inevitably longer scan times to acquire data at higher b-values and
with enough SNR; furthermore, in comparison to the bi-exponential approach, the DKI-IVIM
model adds an another degree of freedom to the nonlinear least-squares fitting, that is already
SNR demanding. For these reasons, probably, widespread clinical applications of DKI have
been so far limited [15–18, 20]. On the other hand, DKI-IVIM has the advantage to provide
an estimation of the kurtosis factor (K), which might represent a potential complementary
biomarker of tissue diffusivity.
The kurtosis factor K could be of interest for clinical applications, as preliminary studies
report in oncology [19, 33]. K is a phenomenological index that does not have a direct
biophysical interpretation but can be correlated indirectly to biophysical processes or indexes.
It has been hypothesized that the kurtosis factor at least might reflect the interaction of water
molecules with cell membranes and intracellular components [34, 35]. The DKI-IVIM
incorporates the non- Gaussian DKI diffusion model into IVIM imaging, and thus it provides
a measure of water diffusion, perfusion and kurtosis in a given tissue.
The application of DKI-IVIM in clinical settings requires short scan times; to this aim, it is
crucial to optimize the pulse sequence parameters. In the current study, an optimized IVIM
protocol was developed using the CRLB approach to identify the optimal b-values for
improved precision on the parameters D, f, D* and K. Eight b-values ranging from 0 to 1500
s/mm2 were used, for a total scan time of four minutes. The study protocol included an
hyperventilation challenge. This challenge is well known to induce a reduction in cerebral
perfusion associated with hypocapnia conditions [22, 28] characterized by simultaneous CBV
and CBF decrease. The use of this challenge allows for mimicking a perfusion impairment
(PETCO2) was monitored during the challenge to corroborate that the physiologic effects of
hypocapnia was indeed taking place during the IVIM acquisitions. On the other hand, no
significant correlation was found between the perfusion parameters and the difference of
PETCO2. This could probably be ascribed to the small cohort size (n = 8).
In the IVIM model, the parameter f reflects the capillary blood volume fraction and the
parameter fD* represents an index proportional to the capillary blood flow; indeed, a
correlation between f and CBV measured by dynamic susceptibility contrast (DSC-MRI) has
been reported in brain gray matter [9] and gliomas [20]; the fD* has been shown to be a
sensitive metric to quantify cerebral blood flow [36, 37]. Furthermore, theoretical
relationships between f and CBV and between fD* and CBF were proposed [6] but they
require the knowledge of the capillary geometry, which is likely to vary with anatomy and
pathologies; overall, these theoretical relationships remain still object of debate [9, 38]. In the
current study, a decrease in both f an fD* (with the DKI-IVIM model) was observed during
the hyperventilation challenge; thus, the results of our work corroborate the idea that
IVIM-derived parameters f and fD* are valid physiological markers of perfusion; as such, they are
of interest in investigations of pathologies that affect the status of the capillary network.
This study suffers from some limitations. The number of subjects was small. Furthermore, the
maximum value of the b-factor was limited to 1500 s/mm2, which may not be the optimal
value, according to kurtosis non-Gaussian theory. Another limitation of the current study is
that the data analysis was performed on regions of interest rather than on a voxel-by-voxel
basis. In the supplementary materials, parametric maps of f and fD* are shown.The quality of
these maps needs to be improved; to estimate the IVIM parameters on a voxel-by-voxel
fashion, it will be necessary to increase the number of acquired b-values and/or the number of
averages, at the expense of increasing the scan time. Another possible option would be to
Compliance with Ethical Standards
Disclosure of potential conflicts of interest
The authors each declare that they have no conflict of interest.
Research involving Human Participants and/or Animals
All procedures performed in studies involving human participants were approved by the
appropriate ethics committee and were therefore performed in accordance with the ethical
standards laid down in the 1964 Declaration of Helsinki and its later amendments.
Informed consent
Authors’ Contribution
Pavilla: Protocol/ Data collection / Data analysis
Gambarota: Protocol/ Data analysis/ project development
Arrigo: Protocol/ Data collection management/ project development
Mejdoubi: Protocol/project development
Duvauferrier: Protocol/project development
References
1. Le Bihan D, Breton E, Lallemand D, Grenier P, Cabanis E, Laval-Jeantet M (1986) MR
imaging of intravoxel incoherent motions: application to diffusion and perfusion in neurologic
disorders. Radiology 161:401–407.
2. Le Bihan D, Breton E, Lallemand D, Aubin ML, Vignaud J, Laval-Jeantet M (1988)
Separation of diffusion and perfusion in intravoxel incoherent motion MR imaging.
Radiology 168:497–505.
3. Koh D-M, Collins DJ, Orton MR (2011) Intravoxel incoherent motion in body
diffusion-weighted MRI: reality and challenges. AJR Am J Roentgenol 196:1351–1361.
4. Luciani A, Vignaud A, Cavet M, Nhieu JTV, Mallat A, Ruel L, Laurent A, Deux J-F,
Brugieres P, Rahmouni A (2008) Liver cirrhosis: intravoxel incoherent motion MR
imaging--pilot study. Radiology 249:891–899.
5. Le Bihan D (2008) Intravoxel Incoherent Motion Perfusion MR Imaging: A Wake-Up Call 1. Radiology 249:748–752.
6. Le Bihan D, Turner R (1992) The capillary network: a link between IVIM and classical
perfusion. Magn Reson Med 27:171–178.
7. Wirestam R, Borg M, Brockstedt S, Lindgren A, Holtås S, Ståhlberg F (2001)
Perfusion-related parameters in intravoxel incoherent motion MR imaging compared with CBV and
CBF measured by dynamic susceptibility-contrast MR technique. Acta Radiol Stockh Swed
1987 42:123–128.
8. Federau C, O’Brien K, Meuli R, Hagmann P, Maeder P (2014) Measuring brain perfusion
with intravoxel incoherent motion (IVIM): Initial clinical experience: Brain IVIM: Initial
9. Wu W-C, Chen Y-F, Tseng H-M, Yang S-C, My P-C (2015) Caveat of measuring
perfusion indexes using intravoxel incoherent motion magnetic resonance imaging in the
human brain. Eur Radiol 25:2485–2492.
10. Mulkern RV, Haker SJ, Maier SE (2009) On high b diffusion imaging in the human brain:
ruminations and experimental insights. Magn Reson Imaging 27:1151–1162.
11. Clark CA, Le Bihan D (2000) Water diffusion compartmentation and anisotropy at high b
values in the human brain. Magn Reson Med 44:852–859.
12. Sehy JV, Ackerman JJH, Neil JJ (2002) Evidence that both fast and slow water ADC
components arise from intracellular space. Magn Reson Med 48:765–770.
13. Bennett KM, Schmainda KM, Bennett (Tong) R, Rowe DB, Lu H, Hyde JS (2003)
Characterization of continuously distributed cortical water diffusion rates with a
stretched-exponential model. Magn Reson Med 50:727–734.
14. Jensen JH, Helpern JA (2010) MRI quantification of non-Gaussian water diffusion by
kurtosis analysis. NMR Biomed 23:698–710.
15. Rosenkrantz AB, Padhani AR, Chenevert TL, Koh D-M, De Keyzer F, Taouli B, Le
Bihan D (2015) Body diffusion kurtosis imaging: Basic principles, applications, and
considerations for clinical practice: Body Diffusion Kurtosis Imaging. J Magn Reson Imaging
42:1190–1202.
16. Weber RA, Hui ES, Jensen JH, Nie X, Falangola MF, Helpern JA, Adkins DL (2015)
Diffusional Kurtosis and Diffusion Tensor Imaging Reveal Different Time-Sensitive
Stroke-Induced Microstructural Changes. Stroke 46:545–550.
17. Zhu J, Zhuo C, Qin W, Wang D, Ma X, Zhou Y, Yu C (2015) Performances of diffusion
kurtosis imaging and diffusion tensor imaging in detecting white matter abnormality in
schizophrenia. NeuroImage Clin 7:170–176.
(2016) Grading of Gliomas by Using Monoexponential, Biexponential, and Stretched
Exponential Diffusion-weighted MR Imaging and Diffusion Kurtosis MR Imaging. Radiology
278:496–504.
19. Lu Y, Jansen JFA, Mazaheri Y, Stambuk HE, Koutcher JA, Shukla-Dave A (2012)
Extension of the intravoxel incoherent motion model to non-gaussian diffusion in head and
neck cancer. J Magn Reson Imaging 36:1088–1096.
20. Wu W-C, Yang S-C, Chen Y-F, Tseng H-M, My P-C (2016) Simultaneous assessment of
cerebral blood volume and diffusion heterogeneity using hybrid IVIM and DK MR imaging:
initial experience with brain tumors. Eur Radiol. doi: 10.1007/s00330-016-4272-z
21. De Luca A, Bertoldo A, Froeling M (2016) Effects of perfusion on DTI and DKI
estimates in the skeletal muscle: Effects of Perfusion on DTI and DKI in Muscle. Magn
Reson Med. doi: 10.1002/mrm.26373
22. Kety SS, Schmidt CF (1946) The effects of active and passive hyperventilation on
cerebral blood flow, cerebral oxygen consumption, cardiac output, and blood pressure of
normal young men. J Clin Invest 25:107–119.
23. Moreton FC, Dani KA, Goutcher C, O’Hare K, Muir KW (2016) Respiratory challenge
MRI: Practical aspects. NeuroImage Clin 11:667–677.
24. Zhang J, Zhou D, Nguyen TD, Spincemaille P, Gupta A, Wang Y (2016) Cerebral
metabolic rate of oxygen (CMRO2) mapping with hyperventilation challenge using
quantitative susceptibility mapping (QSM). Magn Reson Med. doi: 10.1002/mrm.26253
25. Federau C, Maeder P, O’Brien K, Browaeys P, Meuli R, Hagmann P (2012) Quantitative
Measurement of Brain Perfusion with Intravoxel Incoherent Motion MR Imaging. Radiology
265:874–881.
26. Leporq B, Saint-Jalmes H, Rabrait C, Pilleul F, Guillaud O, Dumortier J, Scoazec J-Y,
liver examination: Optimization of Liver Motion Imaging at 3.0T. J Magn Reson Imaging
41:1209–1217.
27. Federau C, Sumer S, Becce F, Maeder P, O’Brien K, Meuli R, Wintermark M (2014)
Intravoxel incoherent motion perfusion imaging in acute stroke: initial clinical experience.
Neuroradiology 56:629–635.
28. Tancredi FB, Hoge RD (2013) Comparison of cerebral vascular reactivity measures
obtained using breath-holding and CO2 inhalation. J Cereb Blood Flow Metab 33:1066–1074.
29. Suo S, Cao M, Zhu W, Li L, Li J, Shen F, Zu J, Zhou Z, Zhuang Z, Qu J, Chen Z, Xu J
(2016) Stroke assessment with intravoxel incoherent motion diffusion-weighted MRI: Ivim
Diffusion-Weighted Mri for Human Stroke. NMR Biomed 29:320–328.
30. Suo S, Lin N, Wang H, Zhang L, Wang R, Zhang S, Hua J, Xu J (2015) Intravoxel
incoherent motion diffusion-weighted MR imaging of breast cancer at 3.0 tesla: Comparison
of different curve-fitting methods: Different IVIM Analyses in Breast Cancer. J Magn Reson
Imaging 42:362–370.
31. Barbieri S, Donati OF, Froehlich JM, Thoeny HC (2016) Impact of the calculation
algorithm on biexponential fitting of diffusion-weighted MRI in upper abdominal organs.
Magn Reson Med 75:2175–2184.
32. Akaike H (1974) A new look at the statistical model identification. IEEE Trans Autom
Control 19:716–723.
33. Yuan J, Yeung DKW, Mok GSP, Bhatia KS, Wang Y-XJ, Ahuja AT, King AD (2014)
Non-Gaussian Analysis of Diffusion Weighted Imaging in Head and Neck at 3T: A Pilot
Study in Patients with Nasopharyngeal Carcinoma. PLoS ONE 9:e87024.
34. Le Bihan D (2013) Apparent Diffusion Coefficient and Beyond: What Diffusion MR
Imaging Can Tell Us about Tissue Structure. Radiology 268:318–322.
Diffusion Imaging for Enhanced Contrast of Brain Tissue Affected by Ischemic Stroke. PLoS
ONE 9:e89225.
36. Federau C, Meuli R, O’Brien K, Maeder P, Hagmann P (2014) Perfusion Measurement in
Brain Gliomas with Intravoxel Incoherent Motion MRI. Am J Neuroradiol 35:256–262.
37. Federau C, O’Brien K, Birbaumer A, Meuli R, Hagmann P, Maeder P (2015) Functional
Mapping of the Human Visual Cortex with Intravoxel Incoherent Motion MRI. PLOS ONE
10:e0117706.
38. Bisdas S, Braun C, Skardelly M, Schittenhelm J, Teo TH, Thng CH, Klose U, Koh TS
(2014) Correlative assessment of tumor microcirculation using contrast-enhanced perfusion
MRI and intravoxel incoherent motion diffusion-weighted MRI: is there a link between
Figures
Fig. 1 PETCO2 time evolution at rest and during the hyperventilation challenge.
Normalized PETCO2 time course (in minutes) averaged over all subjects each minute during
IVIM acquisition. For normoventilation (NV) conditions, PETCO2 data were normalized to
the initial values; for hyperventilation (HV) conditions, PETCO2 values were normalized to the
NV values at the same time point. These time courses show, first, that the PETCO2 is
approximately constant over the sequence duration and second, that there is a significant
Fig. 2 ROI delineation
Example of ROI delineation on one single slice of diffusion-weighted images (b = 80 s/mm2)
in the same subject. The free-hand ROI in cerebellum (a), thalamus (b) , posterior and frontal
Fig. 3 Example of IVIM analysis on the thalamus ROI
(a) An example of the IVIM signal decay in thalamus GM and the curve fitting with the
bi-exponential IVIM (Biexp-IVIM) model, under normoventilation (NV) and hyperventilation
(HV) conditions. The slope between b = 0 s/mm2 and b = 300 s/mm2, which represents an
estimate of the blood flow related IVIM fD* parameter, decreased during the hyperventilation
condition.
logarithmic scale.
(d) Zoom-in of (b), for b-values between b = 300 s/mm2 and b = 1500 s/mm2 , plotted on
logarithmic scale. The DKI-IVIM model appears to provide a better fit to the data, at least in
NV condition, when compared to the Biexp-IVIM model (c)
Fig. 4 Normalized percent changes during the hyperventilation challenge.
Normalized percent changes for the perfusion and diffusion IVIM parameters averaged over
all volunteers during the hyperventilation challenge. For each model, a paired Student t -test
Tables
Table 1. Summary of the statistics of the perfusion parameters f and fD* (x10-2 mm2/s)
obtained with the bi-exponential IVIM and DKI-IVIM models. Baseline (in normoventilation
(NV) condition) values and normalized percent changes averaged over all the volunteers
during the hyperventilation challenge are reported. The results are expressed as mean
Table 2. Summary of the statistics of the diffusion parameters D (x10-3 mm2/s) and K
obtained with the bi-exponential IVIM and DKI-IVIM models. Baseline (in normoventilation
(NV) condition) values and normalized percent changes averaged over all the volunteers
during the hyperventilation challenge are reported. The results are expressed as mean
Table 3. Individual normalized percent changes of the IVIM perfusion parameters f and fD*
obtained with the bi-exponential IVIM and DKI-IVIM models in the cerebellum gray matter
Table 4. Individual normalized percent changes of the IVIM diffusion parameter D (for the
bi-exponential IVIM model) and D and K (for the DKI-IVIM model) in the cerebellum gray