HAL Id: hal-01405848
https://hal.archives-ouvertes.fr/hal-01405848
Submitted on 4 Jun 2021
HAL is a multi-disciplinary open access
archive for the deposit and dissemination of
sci-entific research documents, whether they are
pub-lished or not. The documents may come from
teaching and research institutions in France or
abroad, or from public or private research centers.
L’archive ouverte pluridisciplinaire HAL, est
destinée au dépôt et à la diffusion de documents
scientifiques de niveau recherche, publiés ou non,
émanant des établissements d’enseignement et de
recherche français ou étrangers, des laboratoires
publics ou privés.
Transparent polycrystalline SrREGa 3 O 7 melilite
ceramics: potential phosphors for tuneable solid state
lighting
Marina Boyer, Alberto José Fernandez Carrion, Sandra Ory, Ana Isabel
Becerro, Sandrine Villette, Svetlana V. Eliseeva, Stéphane Petoud, Pierre
Aballea, Guy Matzen, Mathieu Allix
To cite this version:
Marina Boyer, Alberto José Fernandez Carrion, Sandra Ory, Ana Isabel Becerro, Sandrine Villette,
et al.. Transparent polycrystalline SrREGa 3 O 7 melilite ceramics: potential phosphors for tuneable
solid state lighting. Journal of Materials Chemistry C, Royal Society of Chemistry, 2016, 4 (15),
pp.3238-3247. �10.1039/C6TC00633G�. �hal-01405848�
Transparent
Polycrystalline
SrREGa
3O
7Melilite
Ceramics:
Potential Phosphors for Tuneable Solid State Lighting
Marina Boyer*
,a, Alberto José Fernandez Carrion
a, Sandra Ory
a, Ana Isabel Becerro
b, Sandrine
Villette
c, Svetlana V. Eliseeva
c, Stéphane Petoud
c, Pierre Aballea
a, Guy Matzen
aand Mathieu
Allix*
,aFull and congruent crystallization from glass is applied to the SrREGa3O7 melilite family (RE = Eu, Gd, Tb, Dy,
Ho, Er, Tm, Yb and Y). This innovative process enables the synthesis of polycrystalline ceramics exhibiting high transparency both in the visible and near infra-red regions, despite tetragonal crystal structures and micrometer scale grain sizes. Moreover, glass crystallization provides an original route to synthesize new crystalline phases which are not accessible from classic solid state reaction, as demonstrated for SrYbGa3O7 and SrTmGa3O7. To illustrate the potential optical applications of such materials, SrGdGa3O7 transparent
polycrystalline ceramics are doped with Dy3+ or Tb3+/Eu3+ in order to generate white light emission under UV excitation. It is foreseen that such transparent melilite ceramic phosphors, prepared via a cost-effective process, can be successfully used in solid state lighting devices of considerable technological interest.
INTRODUCTION
Transparent polycrystalline ceramics are of great interest for a wide range of optical devices, such as high energy lasers, transparent armours, scintillating materials and optical lenses.1–6 Transparency in these materials is usually achieved via sintering of specific precursors under extreme conditions to avoid porosity, which acts as light scattering centre.7 Along with the absence of porosity, ceramics usually require either a cubic crystal structure or a crystallite size much smaller than the incident wavelength to exhibit transparency. However, current processes leading to transparent ceramic present major drawbacks such as complex and time-consuming multistep methods, limited doping abilities, and elaboration at high temperature / high pressure which implies significant costs.
An alternative process was recently proposed in order to elaborate transparent polycrystalline ceramics overcoming these limitations: the full crystallization from glass approach.8–12 This innovative method combines glass technology advantages, such as large scale samples, shaping ability, low production costs and absence of porosity, with the active optical/photonic properties intrinsic to
ceramics.13–15 Moreover, this innovative approach was also demonstrated to enable the synthesis of highly transparent polycrystalline ceramics with noncubic symmetry materials, especially when the birefringence can be controlled via the presence of chemical disorder.11
The ABC3O7 melilite structure is a well-known host matrix for
luminescent materials.16–20 Its flexible tetragonal framework can accept various alkaline earth, rare earth and aluminium or gallium elements, respectively occupying the A, B and C sites. Interestingly, several members of the melilite family present a very weak birefringence and a relatively low melting point, such as SrGdGa3O7
(Δn = 0.008, Tm ≈ 1600°C). 16,21
According to these characteristics, melilite materials appear as promising candidates to achieve transparent polycrystalline ceramics by full crystallization from glass process, and to further develop luminescent materials with technological interest.
Among the ABC3O7 melilite family, the SrGdGa3O7 composition was
previously synthesized both as a single crystal and as a crystalline powder via a solid state process, and reported to present interesting laser properties.22,23 Actually, SrGdGa3O7 presents a well-known absorption band in the UV region, and can transfer the energy gathered to other lanthanides.20 Such an energy transfer process enhances the emission intensities of the doping lanthanides and enables simultaneous excitation of several elements. Thus, as reported for Gd2Si2O7,24 this energy transfer opens the possibility to
achieve high intensity white light emission from a single doping agent such as Dy3+. Tuneable luminescence with a possible white light emission was also reported from Tb3+ and Eu3+ co-doping in the same material.
In this article, we report the possibility to synthesize SrREGa3O7 transparent polycrystalline ceramics (RE = Eu, Gd, Tb, Dy, Ho, Er, Tm, Yb and Y), using a full crystallization from glass process. This synthesis method enables to enlarge the actual compositional domain of the melilite family to new members, namely SrYbGa3O7 and SrTmGa3O7, which cannot be elaborated by conventional solid
state synthesis. All the prepared SrREGa3O7 ceramics exhibit
transparency both in the visible and near-infrared regions, although different absorption bands and light scattering effects (due to varying birefringence values) are observed depending on the nature of the rare earth ion used. In order to illustrate the potential optical applications of such materials, remarkable white light emission arising from the sample volume25 is demonstrated for both Dy3+ and Tb3+/Eu3+ doped SrGdGa3O7 transparent ceramics.
EXPERIMENTAL SECTION
Synthesis procedureThe SrREGa3O7 (RE = Eu, Gd, Tb, Dy, Ho, Er, Tm, Yb and Y) melilite
transparent polycrystalline ceramics have been elaborated via a full crystallization from glass process.8 First, high purity SrCO3, RE2O3
and Ga2O3 powders (Strem Chemicals, purity > 99.9 %) were
weighed in stoichiometric amounts. They were subsequently mixed in an agate mortar using ethanol as a dispersant to maximize the homogeneity of the mixture. The resulting powder was then dried, pressed into pellets and placed in an aerodynamic levitator coupled to a CO2 laser heating system in order to achieve vitrification.26 The
pellet was thus heated up to about 1650 °C, left to homogenize for a few seconds and subsequently quenched down to room temperature at roughly 300 °C/s by simply shutting off the lasers. The amorphousness of the resulting beads was further checked by X-ray powder diffraction (Fig SI1). Full crystallization from glass was finally achieved via a single heat treatment performed in an open air atmosphere furnace for 2 hours. The crystallization temperature was optimized depending on the nature of the rare earth ion in the nominal composition (700 °C for Eu ; 715 °C for Gd, Tb and Dy ; 730 °C for Ho and Y ; and 765 °C for Er, Tm and Yb). A similar protocol was used for the SrGd1-xGa3O7:x RE3+ doped ceramic materials.
Characterization methods
Differential Scanning Calorimetry (DSC) was performed on a Setaram MULTI HTC 1600 instrument. The glass transition and crystallization temperatures of the various melilite glass compositions were determined from a 200 mg powder sample, using argon as a purging gas and a platinum crucible, with a heating rate of 10 K/min.
X-ray powder diffraction (XRPD) analyses were performed using a Bragg Brentano D8 Advance Bruker laboratory diffractometer (CuKα radiation) equipped with a lynxEye XE detector. Data were collected from 6 to 130° (2θ) at room temperature with a 0.01° step size and an acquisition time of 3 s per step. In situ high-temperature diffraction data were collected every 50 °C from 500 °C up to 1500 °C using an Anton Paar oven chamber (HTK1600N model) from 19 to 38° (2θ) with a 0.016° step size and an acquisition time of 1 s per step.
Transmission Electron Microscopy (TEM) experiments were performed to characterize the microstructure of the transparent polycrystalline ceramics. The samples were first prepared by mechanical polishing with a tripod and inlaid diamond discs until a 50 µm thickness. The thin foils were then obtained by argon ion milling (PIPS). TEM images were collected using a Philips CM20 transmission electron microscope fitted out with an EDAX analyser. Transmittance measurements were recorded over the 200-2700 nm range using a double beam commercial spectrophotometer (Cary 5000) equipped with a Photomultiplier and a PbS photocell for visible and infrared detection, respectively. The beads to be measured were mechanically polished into disks of 1 mm thickness using an automatic polisher running with silicon carbide papers.
Excitation and emission spectra of the different doped SrGdGa3O7
beads were recorded on a Horiba Jobin-Yvon Fluorolog3 spectrofluorometer, equipped with a 450 W CW xenon lamp and a photomultiplier tube (PMT) covering the full range from UV to near-IR (800 nm), operating in the front face mode. Quantum yields were determined with the use of an integration sphere (Model G8, GMP SA, Renens, Switzerland). The measurements were performed on powdered samples placed into 2.4 mm i.d. quartz capillaries. Each sample was measured three times under a 312 nm excitation. We used an integrated emission area ranging from 425 to 715 nm for Dy3+ doped samples, and from 350 to 715 nm for Eu3+/Tb3+ codoped ceramics. The Commission Internationale de L´Eclairage (CIE) chromaticity coordinates of the emitted light were calculated from the emission spectra, considering a 2° observer. The Correlated Colour Temperature (CCT) values of the white-light-emitting phosphors were then determined from the corresponding colour coordinates using the McCamy equation:27 CCT = −449n3 + 3525n2 − 6823n + 5520.33, where n = (x − xe)/(y − ye), xe = 0.332, and ye =
0.186.
RESULTS AND DISCUSSION
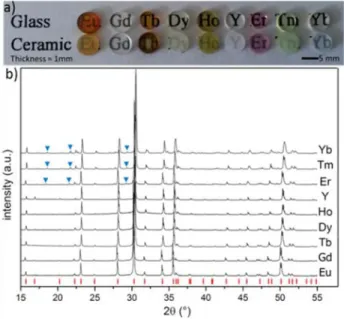
Synthesis and structural characterizationA series of SrREGa3O7 glasses were prepared using an aerodynamic levitation coupled to a laser heating system26,28 (Fig 1a). Glass materials could be obtained for RE = Eu, Gd, Tb, Dy, Ho, Er, Tm, Yb and Y. However, no glass formation could be achieved for large size rare earth cations, i.e. direct devitrification was observed for RE = La, Ce, Pr, Nd and Sm during quenching, suggesting that the SrREGa3O7 glass formation is influenced by the rare earth ionic radius size (a large size difference between the constituent cations enhances a short range order improving the glass forming ability).29 On the other hand, for the smallest cation (Lu), the size difference is certainly too large and prevents the formation of SrLuGa3O7 glass. Several SrREGa3O7 glass materials exhibit strong coloration,
Fig 1: a) Photograph of the SrREGa3O7 polished glass and polycrystalline ceramic
materials. b) X-Ray powder diffractograms of the transparent SrREGa3O7 polycrystalline
ceramics for different rare earth (RE = Eu, Gd, Tb, Dy, Ho, Er, Tm, Yb and Y). Red marks correspond to the indexation of SrGdGa3O7 phase (ICDD 50-1835) whereas blue
as expected by the presence of rare earth elements in the composition which partially absorb the incident visible light. Thermal analyses performed on the as prepared glasses (fig SI2) present a decrease of the glass transition and crystallization temperatures with the increase of the ionic radii, suggesting a less rigid glass network for large cations.29 Subsequently to glass synthesis, an annealing treatment of two hours performed at around 750 °C (optimized for each composition using DSC analyses) led to full crystallization of the glass materials. As presented in Fig 1b, X-Ray powder diffraction measurements performed on the annealed materials show pure melilite crystallization (ICDD 50-1835).26 A slight shift of the cell parameters is observed depending on the nature of the rare earth in the SrREGa3O7 compositions. This
shift is due to the evolving size of the rare earth incorporated in the melilite structure (the a and c cell parameters are decreasing, i.e. the reflections are moving towards high 2 theta angles, when the size of the rare earth cations is decreasing).
Moreover, no obvious presence of residual glass could be observed on the diffractograms, which was also confirmed by both scanning and transmission electron microscopy studies. As a consequence, a full crystallization from glass process could be applied to the SrREGa3O7 melilite glass materials, via a single heat treatment,
leading to polycrystalline ceramics. These SrREGa3O7 polycrystalline
ceramic exhibit remarkable transparency in the visible range, even though some light scattering effect clearly takes place in the materials given the observed loss of transparency by comparison with the related glass materials (Fig 1a). One can note that this light scattering is varying with the nature of the rare earth element. This effect is not surprising as the anisotropic tetragonal structure of melilite materials implies birefringence effects with intensities varying with the corresponding varying structures.
Fig 2: Projection of the SrREGa3O7 melilite structure, along the [001] and [100] axis.
GaO4 tetrahedra layer are stacked along the c-axis. Sr2+ and RE3+ share the same
crystallographic site and are randomly distributed between these layers.
The melilite structure is built up from layers of GaO4 tetrahedra
stacked along the c-axis. Between these sheets, Sr2+ and RE3+ are randomly distributed on the same crystallographic site (fig 2). It is worth noting that SrREGa3O7 melilite crystalline phases have been
reported previously only for RE ranging from La to Er and synthesized using a classic solid state reaction method.30 Crystallization from glass, or directly from the liquid state, can be an innovative approach to elaborate new crystalline phases which cannot be synthesized via a classic solid state reaction.8,11,31–38 Indeed, similarly to a sol-gel method approach, crystallization from glass enables lower synthesis temperature compared to classic solid state reaction, which can explain the formation of metastable crystalline phases not stable up to high temperature. Thus, it is quite remarkable to note that both SrTmGa3O7 and SrYbGa3O7
materials, never reported so far, can be prepared by full crystallization from glass process. These new melilite compositions correspond to the smallest rare earth ionic radii, i.e. the materials showing the largest mismatch between the Sr2+ and RE3+ ionic radius sizes. The low crystallization temperature appears here to be crucial to the formation of these original ceramic compositions. In order to investigate further this point and prove the impossibility to synthesize the ytterbium and thulium melilite crystalline phases by solid state reaction, we performed in situ X-ray diffraction experiments, from room temperature up to the melting point, of SrTmGa3O7 and SrYbGa3O7 compositions starting from SrCO3, RE2O3
and Ga2O3 precursors. Both experiments indicate that the melilite phase is not formed independently of the temperature between RT and the melting point at 1500 °C (Fig SI3). SrCO3 first decomposes at 900 °C and reacts with Ga2O3 to form SrGa2O4. At 1250 °C, RE2O3
and Ga2O3 start to form the RE3Ga5O12 garnet material, and the melting of the different crystalline phases except the garnet eventually occurs from 1400 °C. A similar in situ XRD experiment was also performed on the SrGdGa3O7 composition to demonstrate
the possibility to synthesize via a classical solid state reaction the other rare earth melilite compositions (Fig SI4). In this case, SrCO3
also first decomposes at 900 °C and react with Ga2O3 to form SrGa2O4. Then, between 1200 °C and 1400 °C, SrGa2O4, Ga2O3 and
Gd2O3 form the pure SrGdGa3O7 melilite crystalline phase. At 1500 °C, SrGdGa3O7 melts and only a liquid phase remains.
Although crystallization from glass can be considered as an innovative synthesis method, it is also limited by the fact that a glass material must be elaborated first. Unfortunately this is not the case for the large rare earth elements (RE = La, Ce, Pr, Nd and Sm) which show direct devitrification during melt quenching and thus cannot be prepared as transparent ceramics.
Looking closely at the X-ray diffractograms of the polycrystalline SrREGa3O7 materials corresponding to the smallest rare-earth
elements (RE = Er, Tm and Yb), several extra reflections can be observed (see blue triangles in Fig 1b) compared to the pure tetragonal P-421m melilite phase indexation perfectly matching the
RE = Eu, Gd, Tb, Dy, Ho and Y materials. An electronic diffraction
study performed on these three melilite materials also reveals the presence of extra spots compared to the tetragonal P-421m melilite
structure (Fig SI5). Remarkably, these extra reflections match perfectly the extra peaks observed by XRD and correspond to a 3x1x1 melilite superstructure. Thus, for smallest cations (RE = Er, Tm, Yb), the SrREGa3O7 melilite structure can be described as a
3x1x1 superstructure compared to the conventional tetragonal P-421m melilite structure. From preliminary Rietveld refinement
results, the tripling of the a cell parameter could be due to a periodic arrangement of the large Sr2+ and the small RE3+ ions along
this direction. A complete description of this superstructure will be detailed in a further communication.
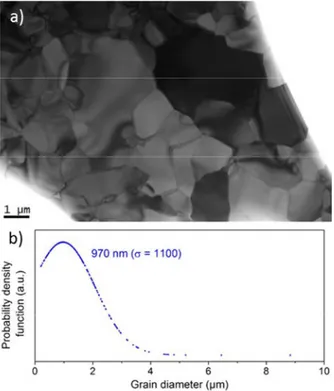
The absence of residual glass phase in our transparent ceramic materials was further confirmed by TEM experiments. The TEM image presented Fig 3a provides information on the microstructure of a typical fully crystallized SrREGa3O7 melilite ceramic. It shows
the absence of both remaining glass phase and porosities. The contrast obtained between the grains is due to the different crystallographic orientation of each grain (different Bragg contrasts). The observation of different grey level within a same grain is attributed to a slight curvature of the TEM foil, leading to a slight crystallographic disorientation. No secondary phase could be detected, even at the grain boundaries which appear very thin (Fig SI6). The SrGdGa3O7 ceramic material exhibits a wide grain size
distribution (fig 3b), with crystals ranging from 200 nm to 8 µm diameter, and a harmonic mean grain size diameter of 970 nm.
Transparency
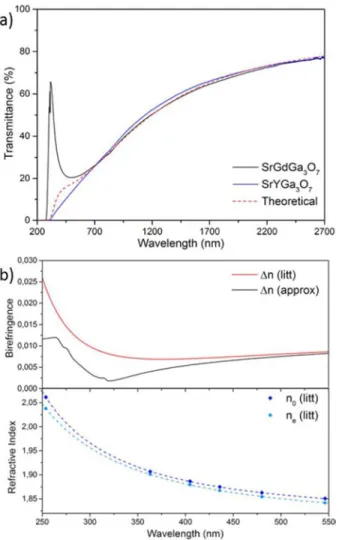
The different melilite polycrystalline ceramics presented in this work demonstrate a good transparency in the visible region as shown on the photography of the optical polished samples (Fig 1a), even though light scattering arising from birefringence affects the materials transparency with different effect depending on the rare earth element. In order to further study this transparency, transmittance measurements from the ultraviolet to the near infrared (NIR) ranges (200 – 2700 nm) were performed. Fig 4a depicts the transmittance curves of SrGdGa3O7 and SrYGa3O7
polycrystalline ceramics after thickness normalization at 1 mm.39 Both materials exhibit a transmittance up to 80 % in the NIR range and a slow decrease towards the visible region, to eventually become completely opaque below 275 nm. Both ceramics show the same transmittance behaviour for λ > 650 nm. However, below
Fig 3: a) TEM micrograph of the SrGdGa3O7 transparent ceramic showing the wide grain
size distribution, and the absence of residual glass or porosity. b) Grain size distribution of the SrGdGa3O7 ceramic. These values were obtained from analysis of numerous TEM
micrographs.
650 nm the gadolinium ceramic presents an increase of transmittance (at around 300 nm) which is not visible for the yttrium ceramic material. The transmittance curves of all the other polycrystalline ceramics appear similar to the yttrium material even though they present additional absorption bands related to the different rare earth elements (fig SI7).
A theoretical model derived from Apetz’s7 was then used and adjusted to the experimental transmittance curves in order to determine the origin of the transmittance differences at short wavelengths between the gadolinium and yttrium materials. Moreover, we aimed here at confirming that the light scattering measured in these polycrystalline ceramics was exclusively due to birefringence effects. Thus, the theoretical in-line transmittance can be described using the following equation: 1 exp 3 ∆ 100 where is the specular reflection:
and ! " , n the refractive index, r the average grain size radius (nm), t the sample thickness(nm), ∆# the birefringence: ∆# 2 3% #& #' and λ0 the incident
wavelength (nm). SrGdGa3O7 refractive indices were previously reported in the literature as #& 3.246 52 , 0&.&- ./
"&.& 1 21
0.006 01λ and #' 3.291 70 , 0&.&./ 2"&.& / &1 0.007 08λ .
40 A
suitable fit of the experimental transmittance values of the SrGdGa3O7 ceramic material can be obtained for λ > 650 nm with a
grain size diameter of 950 nm, which is almost matching the average grain size diameter determined from TEM images (970 nm, cf. Fig 3).
Below 650 nm, the model slightly differs from the SrYGa3O7 transmittance curve and does not take into account the transmittance increase observed at around 300 nm for the gadolinium ceramic. The incorrect fit at short wavelengths can be assigned to a possible erroneous value of the birefringence in this region. Thus, in order to evaluate the birefringence difference between the theoretical and the experimental results, an “approximated birefringence” of SrGdGa3O7 was calculated using
the following formula: ∆# 7"0
. 08 9# :;
"< . Such calculations
led to the results presented in Fig 4b. This figure clearly illustrates the very small difference between the birefringence of the literature and the approximated value (0.0144 maximum difference on the studied wavelength range, corresponding to a 0.7 % decrease of the refractive index). The graph also shows that no experimental points are reported in the related region (250 – 350 nm). Furthermore, these wavelengths are closed to the optical bandgap, explaining the difficulties to estimate the refractive indices in this region. However, this small birefringence difference can lead to an important underestimation of the transmittance value. For example, a 0.01 birefringence difference leads to a 50 % decrease of the transmittance such as observed in Fig 4a between the theoretical and experimental values. These curves highlight the importance of an accurate birefringence estimation to properly predict the transmittance behaviour of transparent polycrystalline ceramics. Moreover, this theoretical model derived from Apetz’s can be easily applied and provide precious help to predict the ability of a non-cubic crystalline phase to be synthesized as a transparent polycrystalline ceramic.
Fig 4: a) Transmittance curves after thickness normalization39 at 1 mm of both the SrGdGa3O7 (black) and SrYGa3O7 (blue) ceramics. The red dot curve corresponds to the
transmittance fit based on the theoretical model. b) (Up) Birefringence of SrGdGa3O7
determined in the literature (red) and from our approximation (black). Down: Ordinary (dark blue) and extraordinary (sky blue) components of the refractive indices reported in the literature and fitted with Sellmeier’s equation from experimental points.
White Light Emission: SrYGa3O7, SrGdGa3O7 and SrYbGa3O7
polycrystalline ceramics present a remarkable transparency in the visible region and their colourless aspect is an added value for further applications such as solid state white lighting. The gadolinium ceramic material exhibits, in addition, an interesting advantage over the other ceramics due to the well-known ability of Gd3+ ions to efficiently absorb UV radiation and transfer the resulting energy to a number of active lanthanide ions such as Dy3+, Eu3+ and Tb3+.24,41 Furthermore, excitation of these lanthanide ions through the Gd-Ln3+ energy transfer band is known to give rise to a higher emission intensity compared to direct excitation of the lanthanide ions themselves.43–45 For these reasons, we chose to focus our work on transparent gadolinium melilite ceramics for further demonstration of use of a transparent melilite ceramic as a single phase white light emitting phosphor. Two different strategies have been used for this purpose, consisting in the single doping of the SrGdGa3O7 transparent ceramic with Dy3+ ions, and the
co-doping with Tb3+ and Eu3+. The first approach generates a white light radiation as a result of the combination of the yellow and blue emissions of the Dy3+ ions.39 On the other hand, the Tb3+-Eu3+ co-doping leads to a white light emission with a better colour
rendering index due to the red contribution of the Eu3+ ions, which together with the blue and green emissions of Tb3+, leads to the pursuit white radiation.40 In addition, the co-doping strategy allows tuning the colour temperature of the white light by changing the relative concentrations of Tb3+ and Eu3+, as explained later in this section. A transparent SrGdGa3O7 polycrystalline ceramic doped
with 0.5 % Dy3+ was prepared following the same procedure as explained in the Experimental section for the undoped SrGdGa3O7
and using stoichiometric amounts of Gd2O3 and Dy2O3 while aiming
for the SrGd0.995Dy0.005Ga3O7 composition. The 0.5% doping content
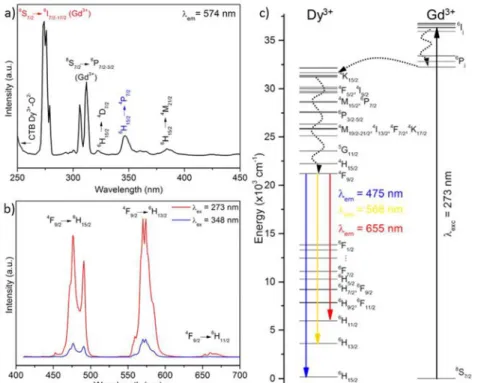
was chosen on the basis of previous studies which demonstrated that such a value was the optimum content to avoid concentration quenching effects.19 The excitation spectrum recorded for this material while monitoring the characteristic Dy3+ emission band at 574 nm is shown in Fig 5a. It exhibits a set of low intensity features in the 320 nm – 450 nm range with the most intense peak located at 348 nm, which corresponds to the direct excitation from the Dy3+ ground state up to higher levels of the 4f manifold. The high intensity excitation bands observed at wavelengths < 320 nm are due to the electronic transitions from the ground-state level of Gd3+ (8S7/2) to their
6
I11/2 and 6
PJ excited-state levels. The presence of
Gd3+ bands in this spectrum, where the Dy3+ emission is monitored, indicate that an energy transfer from Gd3+ multiplets to the Dy3+ accepting electronic levels takes place in this system. A schematic representation of the energy levels diagrams of Dy3+ and Gd3+ is shown in Fig 5c, where a correct match between the energy levels of both ions can be observed, thus allowing the described energy transfer. The emission spectrum of the SrGd0.995Dy0.005Ga3O7 ceramic upon excitation at both 273 nm (Gd3+-Dy3+ energy transfer band) and 348 nm (direct Dy3+ excitation) is shown in Fig 5b. As expected, the excitation through the Gd3+ bands with the following energy transfer to Dy3+ produces higher emission intensity than the direct Dy3+ excitation. Independently of their intensities, both spectra show two dominant emission bands located in the blue and yellow regions of the spectrum, which are characteristic of the 4f-4f transitions in Dy3+ ions. The band centred at 574 nm (yellow region), corresponding to the electric dipole transition (4F9/2
-6
H13/2), appears
stronger than the one centred at around 425 nm (blue region), corresponding to the magnetic dipole transition (4F9/2
-6
H15/2). The
intensity ratio observed for both bands suggests that the Dy3+ ions are located in non-inversion symmetry sites,46 which is indeed the case of the 4e Wyckoff position occupied by the rare earth element in the melilite structure.19 The colour coordinates obtained from the emission spectra of Fig 5b are (x,y) = (0.34, 0.39). They are located well inside the white region of the CIE diagram (Fig SI8) and the corresponding correlated colour temperature was 5258 K. Finally the 0.5 % Dy3+ doped transparent ceramic presents a remarkable 21 (1) % quantum yield under a 312 ± 4 nm excitation. These results demonstrate that our transparent ceramic material can be used as a novel single-phase phosphor for warm white light generation.
In order to synthesize a single-phase ceramic producing white light emission with broad spectral dispersion, the SrGdGa3O7 matrix was
further co-doped with Tb3+ and Eu3+ using the same experimental approach with appropriate amounts of Gd2O3, Tb2O3, and Eu2O3 and
aiming at SrGdGa3O7:xTb3+;yEu3+ (0.5 ≤ x ≤ 1.5 % and 0.3 ≤ y ≤
0.7 %) compositions. The low concentrations of Tb3+ ions used here were necessary to avoid concentration quenching of the blue emission.15 The Eu3+ doping levels were then adjusted experimentally to eventually obtain the pursuit white light emission by combination of the blue and green
Fig 5: a) Excitation spectrum of the SrGdGa3O7:Dy 3+
recorded while monitoring the characteristic Dy3+ emission band at 574 nm. b) Emission spectra of the SrGdGa3O7:Dy 3+
under 273 and 348 nm excitation (in red and blue respectively).c) Energy level diagram of Gd3+ and Dy3+ ions, showing the energy transfer from Gd3+ to Dy3+ and the relevant emission
bands.
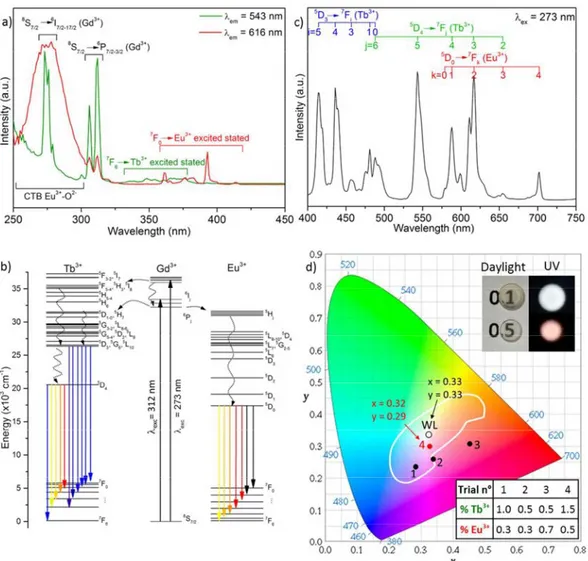
emissions of Tb3+ with the red of Eu3+. This approach requires, therefore, a simultaneous excitation of Eu3+ and Tb3+. Fig 6a presents two different excitation spectra of the SrGdGa3O7:xTb3+;yEu3+ (x=1.5 %, y=0.5 %) transparent ceramic material recorded while monitoring the characteristic emission wavelength of Tb3+ at 543 nm (green plot) and of Eu3+ at 616 nm (red plot). On the one hand, the high energy side of the spectrum recorded while monitoring the Tb3+ emission at 543 nm shows a sharp band peaking at 273 nm that corresponds to the electronic transitions from the ground state level of Gd3+ (8S7/2) to its 6IJ and 6PJ
excited levels. The presence of the Gd excitation band in this spectrum, where a Tb3+ emission is being monitored, indicates that an energy transfer is taking place from Gd3+ to Tb3+ ions in the sample. A schematic representation of the energy levels diagrams of Tb3+ and Gd3+ is shown in figure 6b, where a match between the energy levels of both ions can be observed, thus allowing the Gd Tb energy transfer to take place. On the other hand, the excitation spectrum recorded while monitoring the Eu3+ emission at 616 nm shows a much broader feature in the high energy region, with maximum at around 274 nm. Two bands are expected in this region of the Eu3+ spectrum, namely i) the Gd3+ Eu3+ energy transfer band at 273 nm, which has been sufficiently referenced in the literature20,24,47 and is detailed here in the schematic representation of figure 6b, and ii) the Eu-O charge transfer band (CTB),48 whose position varies with the matrix nature49,50 and is
observed here at around 275 nm. The broad nature of the Eu-O CTB hinders the direct observation of the shaper Gd3+ Eu3+ energy transfer band in the spectrum. In addition to these high energy bands, weaker features are observed at λ > 320 nm in both excitation spectra of figure 6a, which are due to the direct excitation of Tb3+ and Eu3+. In view of the characteristics of both spectra, a 273 (±2) nm excitation wavelength was then used to record the emission spectra of the different SrGdGa3O7:Tb3+,Eu3+
synthesised ceramics. This excitation enables simultaneous excitation of Tb3+ and Eu3+. The emission spectrum corresponding to the SrGdGa3O7:xTb
3+
;yEu3+ material with x= 1.5 % and y= 0.5 % is shown in Fig 6c. It displays emission bands covering the full visible spectrum, with blue and green emissions arising from Tb3+ doping and red ones from Eu3+, as labelled on the figure. The emission spectra of the other compositions are very similar, although different intensity ratios of the blue, green and red components were observed depending on the Tb/Eu contents. The CIE coordinates obtained for each phosphor have been plotted in the CIE diagram presented Fig 6d. The composition with 1.5 % Tb3+ and 0.5 % Eu3+ presents CIE coordinates (x=0.32 and y=0.29) very close to the theoretical white light point (x=0.33 and y=0.33) under a 273±2 nm excitation, with a CCT of 6355 K, higher than the one obtained for Dy3+, and therefore implying a colder white light. The other synthesised compositions showed CIE coordinates inside the
Fig 6: a) Excitation spectra of the SrGdGa3O7:1.5% Tb3+,0.5% Eu3+ transparent ceramic materials while monitoring the characteristic Tb3+ and Eu3+ emission bands at 543 and
616 nm respectively. b) Energy level diagram of Gd3+ and Tb3+/Eu3+ ions. c) Emission spectrum of the SrGdGa3O7:1.5% Tb3+,0.5% Eu3+ ceramic under a 273 nm excitation. d) CIE
diagram where the different SrGdGa3O7:Tb3+,Eu3+ trials are presented under a 273±2 nm excitation, showing the emission tuning ability of the melilite matrix depending on the
Tb3+,Eu3+ doping contents. WL represents the theoretical white light point at (x,y) = (0.33,0.33). The white line corresponds to the white light region limits. The table represents different trials with the corresponding Tb3+ and Eu3+ content. The inset presents a photograph of SrGdGa3O7:1.5%Tb3+,x% Eu3+ transparent (x = 0.1 and 0.5) ceramics under both
daylight and excitation with a commercial 312 nm lamp.
white light region, as observed in Fig 6d, with coordinates shifting from reddish to bluish white light as the Tb/Eu ratio was decreased. The low amount of doping element used (2%) is sufficient to observed white light emission, and prevents important light shown on Fig SI 9).
In summary, a new transparent, single-phase ceramic phosphor able to generate white light upon excitation with a narrow UV LED at 273 nm has been elaborated via a simple full crystallization from glass process. The emission can be easily tuned from bluish to reddish white light using different amounts of Tb3+ and Eu3+ doping ions.
Potential Applications
The use of a wider range excitation lamp at 273 nm would preferentially excite Eu3+ ions instead of Tb3+ ions due to the wide Eu-O CTB, as observed in the excitation spectrum of Fig 6a (red curve), thus eventually rendering a red phosphor. We have then optimised the SrGdGa3O7:xTb3+;yEu3+ ceramics to better suit realistic conditions (i.e. to generate white light by excitation with a broader emission centred at 312 (± 10) nm similar to the wide excitation of a commercial UV lamp). Upon such excitation, we found that the SrGdGa3O7: 1.5% Tb3+; 0.1% Eu3+ transparent ceramic showed an interesting white light emission, as shown in Fig
6d inset. In order to further demonstrate the interest of the transparent ceramic materials described in this paper, we measured the quantum yield of the SrGd0.98Ga3O7:1.5% Tb3+;0.5% Eu3+ and
SrGd0.984Ga3O7:1.5% Tb 3+
;0.1% Eu3+ transparent ceramics under a 312 ± 4 nm excitation (corresponding to the 8S7/2 6Pj Gd3+ excited
levels). The emission spectrum used for this measurement is presented fig. SI10. The measured quantum yields are 10 (1) % and 6.2 (5) % for respectively the 0.5% and 0.1% Eu3+ doped materials. The decrease of quantum yield for a lower amount of Eu3+ is due to both a weaker red emission intensity (correlated to fewer emitting centres) and a weaker absorption of the Eu-O CTB. The set of results obtained here opens therefore new avenues for the development of new cost effective single phase transparent ceramics with tuneable colour emission
CONCLUSION
SrREGa3O7 (RE = Eu, Gd, Tb, Dy, Ho, Y, Er, Tm, Yb) transparent
polycrystalline melilite ceramics have been prepared by a full crystallization from glass method. It is remarkable to note that this original process enlarges the existence domain of the SrREGa3O7 melilite family as it enables the synthesis of SrYbGa3O7 and
SrTmGa3O7 materials, unreported so far and not synthesizable by classic solid state reaction method.
Despite exhibiting a tetragonal cell, i.e. a birefringent structure, and micrometer grain sizes, these polycrystalline ceramics present remarkable transparency both in the visible and near infrared ranges. Both the material coloration and transmittance are shown to vary depending on the rare earth element. It is especially remarkable that gadolinium and yttrium compositions do not possess absorption bands in the visible range. The transparency observed in these materials can be explained by a complete absence of porosity and secondary phases, very tiny grain boundaries, and small birefringence values which induce limited light scattering. The optical transmittance has been fitted using a light scattering model based on Apetz’s model. Despite a small birefringence difference between the literature and our results, this model is shown to describe almost perfectly the transmittance behaviour of the SrREGa3O7 transparent polycrystalline melilite ceramics.
Finally, the full crystallization from glass process is here successfully applied to elaborate transparent polycrystalline ceramics which can be used to convert UV radiation into visible emission with tailored colour, and among them white light. Due to its promising transparency, absence of coloration and possible energy transfer between gadolinium and other lanthanides, the SrGdGa3O7 material
was selected to demonstrate white light emission, arising from the sample volume (and not only from the surface as usually observed for classic opaque ceramics) using various lanthanide element doping. Dy3+ doping was demonstrated to enable white light emission, but due to the lack of red component in the emission spectrum the colour rendering index remains limited. However, this Dy3+ doping presents a remarkable quantum yield of 20 %. More interestingly, we showed that Tb3+/Eu3+ co-doping leads to white light emitting ceramic with tuneable colour coordinates depending on the Tb3+ and Eu3+ contents. The emission colour can be controlled by varying the both Tb3+ and Eu3+ contents, which emits in the blue (400-500 nm) /green (500-650 nm), and red (575-710 nm) regions respectively. Although the quantum yield remains limited (10 % and 6.2 % depending on the Eu3+ concentration) this approach could be further optimized on this system and applied to more efficient compositions in order to develop white solid state
lighting devices with unique feasibility in device fabrication given the glass state machinability.
ACKNOWLEDGEMENTS
The authors thank the French ANR for its financial support to the projects CrystOG ANR-12-JS08-0002 and FOCAL ANR-14-CE07-0002. The ICMN (Orléans, France) and CME (Orléans, France) laboratories for TEM and PIPS accesses. A.J.F.-C. gratefully acknowledges an F.P.D.I. grant from Junta de Andalucía. Supported by MINECO (Project. MAT2014-54852-R). S.P. acknowledges support from INSERM.
REFERENCES
1 S. F. Wang, J. Zhang, D. W. Luo, F. Gu, D. Y. Tang, Z. L. Dong, G. E. B. Tan, W. X. Que, T. S. Zhang, S. Li and L. B. Kong, Progress in
Solid State Chemistry, 2013, 41, 20–54.
2 R. Won, Nat. Photonics, 2008, 2, 216–217.
3 I. W. Chen and X. H. Wang, Nature, 2000, 404, 168–171. 4 A. Ikesue and Y. L. Aung, Nat. Photonics, 2008, 2, 721–727. 5 A. Krell, J. Klimke and T. Hutzler, Opt. Mater., 2009, 31, 1144–
1150.
6 S. Chen and Y. Wu, Am. Ceram. Soc. Bull., 2013, 92, 32–37. 7 R. Apetz and M. P. B. van Bruggen, Journal of the American
Ceramic Society, 2003, 86, 480–486.
8 M. Allix, S. Alahrache, F. Fayon, M. Suchomel, F. Porcher, T. Cardinal and G. Matzen, Adv. Mater., 2012, 24, 5570–5575. 9 S. Alahrache, International patent, WO2013079707, 2013. 10 S. Alahrache, K. Al Saghir, S. Chenu, E. Veron, D. D. S. Meneses,
A. I. Becerro, M. Ocana, F. Moretti, G. Patton, C. Dujardin, F. Cusso, J.-P. Guin, M. Nivard, J.-C. Sangleboeuf, G. Matzen and M. Allix, Chem. Mat., 2013, 25, 4017–4024.
11 K. Al Saghir, S. Chenu, E. Veron, F. Fayon, M. Suchomel, C. Genevois, F. Porcher, G. Matzen, D. Massiot and M. Allix, Chem.
Mater., 2015, 27, 508–514.
12 M. Boyer, S. Alahrache, C. Genevois, M. Licheron, F.-X. Lefevre, C. Castro, G. Bonnefont, G. Patton, F. Moretti, C. Dujardin, G. Matzen and M. Allix, Cryst. Growth Des., 2016, 16, 386–395. 13 G. Patton, F. Moretti, A. Belsky, K. A. Saghir, S. Chenu, G.
Matzen, M. Allix and C. Dujardin, Phys. Chem. Chem. Phys., 2014, 16, 24824–24829.
14 D. Chen, Z. Wan, Y. Zhou, X. Zhou, Y. Yu, J. Zhong, M. Ding and Z. Ji, ACS Appl. Mater. Interfaces, 2015, 7, 19484–19493.
15 D. Chen, Z. Wan, Y. Zhou, W. Xiang, J. Zhong, M. Ding, H. Yua and Z. Ji, J. Mater. Chem. C, 2015, 3, 3141–3149.
16 Y. Zhang, X. Yin, H. Yu, H. Cong, H. Zhang, J. Wang and R. I. Boughtont, Cryst. Growth Des., 2012, 12, 622–628. 17 M. Karbowiak, P. Gnutek, C. Rudowicz and W.
Ryba-Romanowski, Chem. Phys., 2011, 387, 69–78.
18 H. Xia, J. Feng, J. Xu, Z. You, Y. Wang and C. Tu, J. Quant.
Spectrosc. Radiat. Transf., 2015, 155, 90–95.
19 A. A. Kaminskii, H. H. Yu, J. Y. Wang, Y. Y. Zhang, H. J. Zhang, O. Lux, H. Rhee, H. J. Eichler, J. Hanuza, H. Yoneda and A. Shirakawa, Laser Phys., 2014, 24, 085803.
20 X. M. Zhang, J. H. Zhang, L. F. Liang and S. Qiang, Mater. Res.
Bull., 2005, 40, 281–288.
22 F. Hanson, D. Dick, H. Verdun and M. Kokta, J. Opt. Soc. Am.
B-Opt. Phys., 1991, 8, 1668–1673.
23 H. Xia, J. Feng, Y. Wang, J. Li, Z. Jia and C. Tu, Sci Rep, 2015, 5, 13988.
24 A. Jose Fernandez-Carrion, M. Ocana, J. Garcia-Sevillano, E. Cantelar and A. Isabel Becerro, J. Phys. Chem. C, 2014, 118, 18035–18043.
25 J. Xu, J. Ueda, K. Kuroishi and S. Tanabe, Scr. Mater., 2015, 102, 47–50.
26 J. K. R. Weber, International Journal of Applied Glass Science, 2010, 1, 248–256.
27 C. Mccamy, Color Res. Appl., 1992, 17, 142–144.
28 D. A. Winborne, P. C. Nordine, D. E. Rosner and N. F. Marley,
MTB, 1976, 7, 711–713.
29 A. Rosenflanz, M. Frey, B. Endres, T. Anderson, E. Richards and C. Schardt, Nature, 2004, 430, 761–764.
30 J. M. S. Skakle and R. Herd, Powder Diffraction, 1999, 14, 195– 202.
31 G. Rousse, B. Baptiste and G. Lelong, Inorg. Chem., 2014, 53, 6034–6041.
32 M. Boyer, E. Veron, A. I. Becerro, F. Porcher, M. R. Suchomel, G. Matzen and M. Allix, Crystengcomm, 2015, 17, 6127–6135. 33 E. Veron, M. N. Garaga, D. Pelloquin, S. Cadars, M. Suchomel, E.
Suard, D. Massiot, V. Montouillout, G. Matzen and M. Allix,
Inorg. Chem., 2013, 52, 4250–4258.
34 J. Yu, S. Kohara, K. Itoh, S. Nozawa, S. Miyoshi, Y. Arai, A. Masuno, H. Taniguchi, M. Itoh, M. Takata, T. Fukunaga, S. Koshihara, Y. Kuroiwa and S. Yoda, Chem. Mater., 2009, 21, 259–263.
35 T. Shishido, Y. T. Zheng, A. Saito, H. Horiuchi, K. Kudou, S. Okada and T. Fukuda, J. Alloy. Compd., 1997, 260, 88–92.
36 I. V. Ogorodnyk, I. V. Zatovsky and N. S. Slobodyanik, Russ. J.
Inorg. Chem., 2007, 52, 121–125.
37 N. Y. Strutynska, I. V. Zatovsky, M. M. Yatskin, N. S. Slobodyanik and I. V. Ogorodnyk, Inorg Mater, 2012, 48, 402–406.
38 T. Nakanishi, K. Watanabe, J. Ueda, K. Fushimi, S. Tanabe and Y. Hasegawa, J. Am. Ceram. Soc., 2015, 98, 423–429.
39 L. Lallemant, N. Roussel, G. Fantozzi, V. Garnier, G. Bonnefont, T. Douillard, B. Durand, S. Guillemet-Fritsch, J.-Y. Chane-Ching, D. Garcia-Gutierez and J. Aguilar-Garib, J. Eur. Ceram. Soc., 2014,
34, 1279–1288.
40 Y. Y. Zhang, H. J. Zhang, H. H. Yu, J. Y. Wang, W. L. Gao, M. Xu, S. Q. Sun, M. H. Jiang and R. I. Boughton, Journal of Applied
Physics, 2010, 108, 063534.
41 V. Bedekar, D. P. Dutta, M. Mohapatra, S. V. Godbole, R. Ghildiyal and A. K. Tyagi, Nanotechnology, 2009, 20, 125707. 42 A. J. Fernández-Carrión, M. Ocaña, J. García-Sevillano, E.
Cantelar and A. I. Becerro, J. Phys. Chem. C, 2014, 118, 18035– 18043.
43 J. Li, J.-G. Li, S. Liu, X. Li, X. Sun and Y. Sakka, J. Mater. Chem. C, 2013, 1, 7614–7622.
44 T. Grzyb, M. Runowski and S. Lis, J. Lumines., 2014, 154, 479– 486.
45 A. I. Becerro, S. Rodriguez-Liviano, A. J. Fernandez-Carrion and M. Ocana, Cryst. Growth Des., 2013, 13, 526–535.
46 P. A. Tanner, Chem. Soc. Rev., 2013, 42, 5090–5101. 47 P. D. G. Blasse and P. D. B. C. Grabmaier, in Luminescent
Materials, Springer Berlin Heidelberg, 1994, pp. 91–107.
48 M. Zhao, L. Li, J. Zheng, L. Yang and G. Li, Inorg. Chem., 2013, 52, 807–815.
49 G. S. R. Raju, E. Pavitra, Y. H. Ko and J. S. Yu, J. Mater. Chem., 2012, 22, 15562–15569.
50 H. E. Hoefdraad, F. M. A. Stegers and G. Blasse, Chemical Physics
![Fig 2: Projection of the SrREGa 3 O 7 melilite structure, along the [001] and [100] axis](https://thumb-eu.123doks.com/thumbv2/123doknet/14700049.564484/4.918.121.423.601.1013/fig-projection-srrega-o-melilite-structure-axis.webp)