HAL Id: hal-01283822
https://hal.archives-ouvertes.fr/hal-01283822
Submitted on 6 Mar 2016
HAL is a multi-disciplinary open access archive for the deposit and dissemination of sci-entific research documents, whether they are pub-lished or not. The documents may come from teaching and research institutions in France or abroad, or from public or private research centers.
L’archive ouverte pluridisciplinaire HAL, est destinée au dépôt et à la diffusion de documents scientifiques de niveau recherche, publiés ou non, émanant des établissements d’enseignement et de recherche français ou étrangers, des laboratoires publics ou privés.
Modelling of the vulnerability of the Japanese
population to radioactive discharges from Fukushima
nuclear power plant
Sandra Perez
To cite this version:
Sandra Perez. Modelling of the vulnerability of the Japanese population to radioactive discharges from Fukushima nuclear power plant. European Colloquium of Quantitative and Theoretical Geography (ECQTG), Stamatis Kalogirou, Mar 2011, ATHENES, Greece. pp.639 : 646. �hal-01283822�
Modelling of the vulnerability of the Japanese population to radioactive
discharges from Fukushima nuclear power plant
Sandra PEREZ
Senior lecturer, Department of Geography, University of Nice Sophia Antipolis,
98, bd E. Herriot - BP 3209 06204 Nice Cedex France. Tel. +33 (0)4 93 37 56 86, Email: perez@unice.fr.
ABSTRACT
The Japanese authorities have been measuring since March 16th the radiation level around the Fukushima nuclear plant as well as in the 46 other prefectures of the country. Considering these daily measurements of radiation level in the air, in fallout, tap water, dust, soil, leafy vegetables and seawater, we propose to assess the population exposure to the radioactivity by using Bayesian networks. Bayesian networks are handy thanks to their dynamic component, calculating probability distributions in accordance with the “system state” variable (in this case, the exposure of the population) over time.
KEYWORDS
Modelling, Health Risk, Environmental Health, Fukushima, Bayesian Networks
1. INTRODUCTION
The aim of this study is to quantify the health impact of the radioactive discharges. We will distinguish external exposure through inhalation of radionuclides from internal exposure through ingestion of contaminated water or food because internal exposure is 20 times more dangerous than an external one. Because of the uncertainty due to the health impact assessment, the methodology chosen is a probabilistic modelling with Bayesian networks. More precisely, we are going to use a Dynamic Bayesian Network (DBN) enabling us, informed of the population exposure at some point, to simulate its evolution over time and then to detect when the threshold of 1 Sievert (at which the effects on health appear) is reached. We also hope to be able to answer the following question: depending on the areas, which contamination mode could be most important (external, internal or both)? Our goal is to define the areas to which the Japanese health authorities should really pay attention in the future in order to prevent as much as possible diseases related to exposure to radionuclides such as iodine-131 or cesium-137.
2. THE ENVIRONMENTAL ASSESSMENT IN THE JAPANESE PREFECTURES
Starting this analysis, we do not know which areas are most affected: this is the reason why we decided to take into account all the Japanese Prefectures (Map 1). The radioactivity level measurements in the air have been recorded hourly in the prefectural capitals’ city halls by the Ministry of Education, Culture, Sports, Science and Technology in Japan (MEXT)1. These measurements relate to the dose rate, meanwhile the integrated dose is the sum of the total hourly measurements recorded over a one-month period since measurements began (on March 16th), representing 34 968 data. Knowing the dose rates and, then, the integrated doses, we will be able to estimate population exposure.
2.1. Air
The highest value (2183 μ Sv) is of course observed in the Fukushima Prefecture. The neighboring prefecture, Ibaraki, recorded the second highest value (153 μ Sv), although it is 10 times less than in the Fukushima Prefecture. The integrated dose in Miyagi and Tochigi is similar (80 μ Sv). Although in their northern part Ibaraki and Tochigi Prefectures are contiguous with the Fukushima one, their distance from the NPP (200 & 170 km), possibly their mountains, such as Shirane (2,578 m), Nantai (2,484 m) and Nasudake (1,917 m), (by blocking the radioactivity-carrying winds) and above all the fact that they are not
1
under the plume, protect them from a higher level of radiation. We guess the Miyagi Prefecture location, which is a little further inland and somewhat outlying from the plume, as we can see on the picture below, could also explain the low levels of integrated dose despite the proximity to the NPP (58 km).
0 200 400 600 800 1000 1200 1400 1600 1800 1 3 5 7 9 11 13 15 17 19 21 23 25 27 29 31 33 35 37 39 41 43 45 47 (µ S v) Prefectures
Integrated dose (reported by prefecture)
(from 3/17/11 to 4/17/11)
Chart 1: Air integrated dose reported by prefecture Figure 1: Position of Miyagi, Google map 3D
Based on modelling performed by IRSN2 on the dispersion of radioactive releases into the atmosphere across Japan between March 12th and March 25th, we know that “the plume headed in directions that have varied over time according to the meteorology: north-east until March 14th, to the south and south-westerly direction towards Tokyo (March 15th), then eastward toward the Pacific. From March 20th and during the following days the plume was directed at the inland in a changing way (especially in Tokyo in March 23rd) but also towards the northwest.”
2.2. Fallout
The radioactive particles can fall to the ground as dry deposition or be swept away by rising air currents and fall quite far from their origin through rain or snow (wet deposition). That is why the spatial distribution of iodine-131 and cesium-137 in fallout overflows was first observed in the air.
0 50000 100000 150000 200000 250000 1 3 5 7 9 11 13 15 17 19 21 23 25 27 29 31 33 35 37 39 41 43 45 47 R adi oa ct ivi ty le ve l ( M B q/ km 2) Prefectures
Fallout (reported by prefecture)
(from 3/20/11 to 4/20/11)
Iodine 131 Césium 137
Chart 2: Fallout integrated dose reported by prefectures
The Ibaraki Prefecture (8) is very affected (211 936 MBq/km2)3, followed by the Tokyo Prefecture (13) (84 834 Mbq/km2) which is 225 km away from the NPP, and the Yamagata (6), Saitama (11), Tochigi (9), Chiga (12) and Gumma (10) Prefectures. Fallouts were most significant on 21st March due to the combined effect of the north wind and rain as we can see from the table below:
2
http://www.irsn.fr 3
Data for Fukushima Prefecture were only available from March 29th but we have more accurate data thanks to the monitors deployed in the Fukushima prefecture as you can see in subsection 3.2.
Prefecture Iodine 131 MBq/km2 Cesium 137 MBq/km2 Ibaraki 93 000 13 000 Yamagata 58 000 4 300 Saitama 7 200 790 Tochigi 5 300 250 Gunma 3 700 320 Tokyo 2 900 560
Table 1: The Prefectures most affected by fallouts on March 21st
These fallouts explain, of course, the contamination in drinking water (deposits in waterbodies which water is captured for water supply of cities) and fresh products (vegetables which leaves will capture radionuclides) and, then, the contamination of milk and meat through the animals that graze, this is the way of internal contamination. The internal exposure is then evaluated by the rate of fallouts as we are not able to estimate if the population would be in the coming years apart from contaminated products4. Futhermore, the Fukushima’s food self sufficiency ratio is 85%. Thus, 163 000 becquerels of radioactive cesium-137 per kilogram were detected on March 23rd 5, in the soil of the Iitate village (40 km northwest from the plant) which is very impacted by the fallouts.
2.3. Water
The cumulative radiation level in drinking water reported by prefecture is unsurprisingly quite similar to the fallout one.
0 100 200 300 400 500 600 1 3 5 7 9 11 13 15 17 19 21 23 25 27 29 31 33 35 37 39 41 43 45 47 (B q/ l) Prefectures
Drinking water (reported by prefecture) (from 3/19/11 to 4/19/11)
Iodine 131 Césium 137
Chart 3: Drinking water integrated dose reported by prefecture
Measurements in water have been conducted once per day since March 19th. If levels of radioactive iodine rise over 100 Bq/l, it is recommended not to use tap water for preparing baby milk formula. Indeed, children under one year are most sensitive to iodine. As far as adults are concerned, the threshold is 300 Bq/l for iodine (and 200 Bq/l for cesium, never reached). Between March 19th and April 19th, the threshold of 100 Bq/l has been exceeded only once on March 25th (110 Bq/l) in Tochigi Prefecture (9). Since March 30th, iodine rates fell sharply because iodine remains in the water for a while (the radioactivity period of iodine is low: -50% each 8.5 days). From May 1st, iodine and cesium are no longer detectable in Japanese prefectures’ water. The above chart gives an indication of the cumulative dose of iodine and cesium in the different Japanese prefectures’ drinking water. The most affected by iodine-131 are Tochigi (476 Bq/l), Ibaraki (376 Bq/l), Fukushima (252 Bq/l)6, Tokyo (218 Bq/l) and Saitama (215 Bq/l).
In conclusion of these initial tests conducted across all Japanese prefectures, we can differentiate populations of Fukushima and Ibaraki who are both externally (air) and internally (fallout, water) exposed
4 http://search.japantimes.co.jp/mail/nn20110713a1.html 5 http://www3.nhk.or.jp/daily/english/23_28.html 6
to radioactivity, meanwhile the populations of Tochigi, Tokyo, Saitama are mainly internally exposed (fallout, water) and those of the provinces of Yamagata, Gumma, Chiga “only”exposed to fallout.
Many measurement points were set up in the Fukushima Prefecture in order to analyze the radioactivity in the air7, dust, soil, vegetables and sea.
3. THE ENVIRONMENTAL ASSESSMENT IN THE FUKUSHIMA PREFECTURE
3.1 Air
43 sampling points have been monitored out of the twenty-kilometer area. MEXT has been recording four times per day (10 a.m., 1 p.m., 4 p.m., & 7 p.m.). 7 p.m. has been selected as reference time because we noted that it is at that moment that the radioactivity tends to be higher (likely due to an accumulation effect in the sea that goes back inland through the sea breeze). We have then extended these measurements to the whole day. We classified items according to their distance from the NPP and we noticed that radiations do not spread concentrically depending on the distance but depending on the wind directions. Every point under the dominant wind flow (North West) is therefore under the plume and is then characterized by higher levels of radioactivity. Thus, the chart below shows that even the closest sampling points (20 km) if outside of this main direction (NW) are the less affected, and two points at the same distance will not be affected in the same way (i.e. sampling points n.32 - 39290 µ Sv and n.42 - 1244 µ Sv). This questions the geometric areas that have been drawn and have influenced the decisions to evacuate the population living within 30 km from the plant. In the emergency context, the Japanese authorities have relied on what had been done in Chernobyl, but it is now time to clarify these areas. Indeed, the population living at 30 km NW from the NPP has not been obliged to evacuate when it is one that is most affected.
0 5000 10000 15000 20000 25000 30000 35000 40000 45000 50000 4 1 ( 2 0 k m W ) 4 3 ( 2 0 k m SW ) 4 5 ( 2 0 k m S) 7 6 ( 2 0 k m SW ) 8 3 ( 2 0 k m NW ) 7 1 ( 2 5 k m S) 7 7 ( 2 5 k m SW ) 8 0 ( 2 5 k m N) 2 1 ( 3 0 k m W NW ) 3 1 ( 3 0 k m W NW ) 3 2 ( 3 0 k m NW ) 3 3 ( 3 0 k m NW ) 3 4 ( 3 0 k m NW ) 4 2 ( 3 0 k m W ) 4 4 ( 3 0 k m S) 4 6 ( 3 0 k m NW ) 7 2 ( 3 0 k m S) 7 9 ( 3 0 k m NW ) 6 ( 3 5 k m N) 1 4 ( 3 5 k m W ) 1 5 ( 3 5 k m W ) 2 2 ( 3 5 k m W NW ) 2 3 ( 3 5 k m W NW ) 3 8 ( 3 5 k m S) 7 3 ( 3 5 k m S) 7 4 ( 3 5 k m S) 1 0 ( 4 0 k m NW ) 1 1 ( 4 0 k m NW ) 1 2 ( 4 0 k m W ) 1 3 ( 4 0 k m W ) 3 6 ( 4 0 k m NW ) 8 4 ( 4 0 k m SW ) 3 ( 4 5 k m NW ) 5 ( 4 5 k m N) 2 0 ( 4 5 k m NW ) 3 9 ( 4 5 k m N) 7 5 ( 4 5 k m S) 4 ( 5 0 k m NW ) 3 7 ( 5 0 k m NW ) 2 ( 5 5 k m NW ) 8 6 ( 5 5 k m W ) 1 ( 6 0 k m NW ) 8 5 ( 6 0 k m NW ) (µ Sv ) Sampling points
Integrated dose (Fukushima Prefecture)
(from 3/17/11 to 4/17/11)
Chart 4: Air integrated dose in Fukushima Prefecture
3.2 Dust, soil, leafy vegetable and sea water contamination
The dust can lead to contaminate the ground and then the food chain (vegetables, animals, milk). Dust has been collected over 26 sampling points since March 19th; chart 5 illustrates the radioactivity concentration average in the dust. Once again the concentration level does not vary linearly with the distance from the source but depending on the northwest flow. The highest reading (555 Bq/m3 of iodine-131) is obtained at 2-7 point (35 km NW, Date county) on March 25th (3 p.m.). Note that the highest average (47 Bq/m3 of iodine 131 at point 1-5) was obtained due to a peak on March 23rd at 1 p.m.: 530 Bq/m3 of iodine-131, while the following measurement (2 p.m.) only indicates 180 Bq/m3.On March 24th at 10 a.m., it dropped to 5.9 Bq/m3. This shows that rates can vary quite rapidly from one hour to another because of sporadic releases from the NPP and because the radioactivity is very volatile. It can vary considerably from one point to another in the same city. There are two measurement sites in the city of Kawamata Yamakiya (sampling points 2-7): one with averages of 21 Bq/m3 of iodine-131 and 0.64 Bq/m3 of cesium-137, the other one with respectively 30 Bq/m3 of iodine and 26 Bq/m3 of cesium. Then the roughness of the
7 No detailed data for drinking water
geographic space or microclimatology seem to play an important role in the spatial distribution of radioactivity. 0 5 10 15 20 25 30 35 40 45 50 R adi oa ct ivi ty C onc ent ra ti on (B q/ m 3 ) Sampling points
Dust (Fukushima Prefecture) (from 3/19/11 to 4/20/11) Iodine 131 Cesium 137 -100 000 200 000 300 000 400 000 500 000 600 000 700 000 800 000 900 000 R ad io ac tiv ity C o n ce n tr atio n ( B q /k g ) Sampling points
Soil (Fuskushima Prefecture) (from 3/23/11 to 4/22/11)
Iodine 131 Cesium 137
Chart 5: Radioactivity concentration in dust Chart 6: Radioactivity concentration in soil
0 50000 100000 150000 200000 250000 300000 350000 400000 450000 R adi oa ct ivi ty conc ent ra ti on ( B q/ kg) Sampling points
Leaf Vegetable (Fukushima Prefecture)
(from 3/18/11 to 4/20/11)
Iodine 131 Cesium 137
Chart 7: Radioactivty concentration in leafy vegetables
As far as the soil is concerned, 38 sampling points have been measured since March 23rd. The max value is obtained at 106 point (520 000 Bq/kg of iodine-131) and at 3-5 point with 770 000Bq/kg of cesium-137, but the former value is the result of only one measurement and thus does not give a right idea of this item. On March 20th in upland soil of Iitate village (40km NW), the radioactivity concentration of iodine-131 was 1 170 000 Bq.kg (for 16 000 Bq.kg of cesium-137). Therefore, the radioactivity concentration in leafy vegetables measured over 14 sampling points tends to follow the previous dust and soil charts where the peaks are observed for NW or SW direction.
Due to the massive releases in the ocean of radioactive water used to cool the nuclear reactors, MEXT has measured since March 23rd twelve sampling points at different depth levels (over the sea up to 172 m). The iodine contamination will have less impact than cesium: iodine will indeed be quickly dispersed due to its low half life, while the cesium will remain active for a long time (30 years) with a contamination risk of the food chain (concentration factor and therefore bioaccumulation of 400 for fish). Items 4 and 5 in front of the plant are the most affected (averages over 200 Bq/l of cesium). Which confirms contamination due to the releases of water used to cool the reactors, and more so it was only on April 16th contamination suddenly increased to point 4 (Cs-137 undersea outer layer 186 Bq/l). Since May 6th, cesium appears in marine soil at 93.9 Bq/g at 31 m’s depth and 32.3 Bq/g at another point at 117 m’s depth8.
0 50 100 150 200 250 300 350 A B 1 2 3 4 5 6 7 8 9 10 R ad io ac tiv ty C on ce ntr atio n (B q/L ) Sampling points
Sea water (Fukushima prefecture)
(from 3/23/11 to 4/22/11)
Undersea I-131 (Bq/L) Undersea Cs-137 (Bq/L) Undersea I-131 outer layer (Bq/L) Undersea Cs-137 outer layer (Bq/L) Undersea I-131 lower layer (Bq/L) Undersea Cs-137 lower layer (Bq/L) Over the sea (µ Sv)
Dust over the sea I-131 (Bq/m3) Dust over the sea Cs-137 (Bq/m3)
Map 1: Seawater, MEXT Chart 8: Radioactivity Concentration in seawater
8
Knowing the levels of radioactivity to which the population was exposed during the first month, it is time to assess the health impact of these releases.
4- HEALTH IMPACT ASSESSMENT OF RADIOACTIVE WASTE
After discharges the radioactivity in the air decreases with time, what is known as radioactive decay. Only in the early days when the releases were significant could the population be exposed to high doses. Rates are now lower. In fact, the population will be exposed to low doses of radioactivity for at least 60 years, since cesium has a period of 30.5 years after which its activity decreases by half.
4.1 Evaluation of annual external exposure
External exposure means doses are likely to be received on the whole body in the absence of protection from discharges. To assess as precisely as possible the annual external exposure, we conducted the following operations: the natural radioactivity of each prefecture has been subtracted from the integrated dose. Indeed, we are subject to natural radioactivity which is estimated to 2 400 mSv/year on the surface of the Earth: it may be much higher in some areas (Ramsar in Iran, Kerala in India, Guarapari region in Brazil) where high levels of radioactivity are recorded without excess of diseases. The body seems to adapt itself to this environment; furthermore natural radioactivity is less dangerous than the artificial one. Natural radioactivity is about 1 500 mSv/year in Japan but varies greatly from one prefecture to another. MEXT actually gives a range of values: eg Fukushima (0037-0046) is expressed in mSv/hr, and for each prefecture, we took the lowest in order not to underestimate the artificial radioactivity. We converted natural radiation into hours for 1 month because the artificial radioactivity (integrated dose) is calculated this way. In order not to overestimate the artificial exposure during 1 year (radioactive decay), we took the most recent available data of radioactivity in the air (25th May), multiplied it by 30.5 (number of days in one month), then by 11 months and added the first month’s integrated dose, which gives us the external exposure per year.
4.2 Evaluation of annual internal exposure
As regards internal exposure due to fallouts9 in the prefectures, we converted the integrated dose of fallouts from MBq/km2 units into µSv/hour, using the formula provided by the National Institute of Radiological Sciences of Japan: 2.6MBq/km2 of iodine 131 exposure equals 0.0000031 µSv/h and 2.3 MBq/km2 of cesium equals 0.0000040 µSv/h. Results have subsequently been extended to 12 months in order to get an annual exposure again. Data collected in Fukushima Prefecture on leafy vegetables are not expressed in MBq/km2 but in Bq/kg, which represents the activity. Again we had to convert the Bq/kg into mSv using dose factors that are 0.000022 for iodine-131 and 0.000014 for cesium. The result was then converted into µSv in order to add the values of external exposure.
Having now µSv on both sides (external and internal exposure) we can add the two exposure types to get an idea of the population total exposure over one year. We can now calculate the committed dose for children, corresponding to the radiation levels to which they will be exposed in 70 years (assuming they are still living in Fukushima prefecture). The committed doses are expressed in mSv; they have been converted into Sievert knowing that for every Sv the likelihood of developing cancer increases by 5%10. Two approaches can be used to assess effects on health: a deterministic approach where one tries to quantify the effects from the point of view of their seriousness and a stochastic approach, adopted here, which evaluates the effects from the point of view of their probability of occurrence. Being exposed to radiations over a long period of time and being strongly exposed do not have the same impact on the body because DNA is going to repair the radiation effect but, step by step, DNA will get tired, will become brittle and breaks will finally appear promoting carcinogenesis.
9
we are aware that there is a bias because we do not have data at the prefectural level for activity in vegetables as in Fukushima, but only the fallouts
10
4.3 Calculation of cancer probability increase by Dynamic Bayesian Network
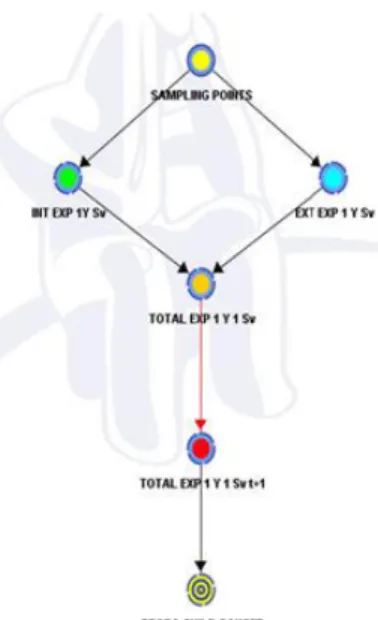
Featuring internal (INT EXP 1Y Sv) and external (EXT EXP 1Y Sv) exposure of the population over one year and thus their total exposure (TOTAL EXP 1Y 1 Sv), a Dynamic Bayesian Network will calculate the committed dose for children over 70 years (TOTAL EXP 1Y Sv t + 1) and the likelihood of related cancer (PROBA CHILD CANCER) (Figure 2). This calculation was performed at the prefectural level but, at this scale, only the Fukushima prefecture is around the threshold of 1 Sv (0.9922). The analysis will therefore focus on the different sampling points in Fukushima prefecture. It appears from this analysis that 54.55% of the measured points have increased probabilities of developing cancer in the range of 51% and 185.768%, and for 22.73% of the points the odds are increased in a range that varies between 337.143 and 486.167%. The question is: where are these points located? If they are in the 20-km area where the population was evacuated, this will not impact on health; if they are located in the area between 20 and 30 km where only containment recommendations have been taken, and even more beyond 30 km, there will be an impact.
Figure 2: Dynamic Bayesian Network, (BayesiaLab 5.0.2)
0 1000 2000 3000 4000 5000 6000 7000 41 -20 km W 43 -20 km S W 45 -20 km S 76 -20 k m S W 83 -20 km N W 71 -25 k m S 77 -25 km S W 80 -25 km N 21 -30 k m W N W 31 -30 km W N W 32 -30 km N W 33 -30 km N W 34 -30 k m N W 42 -30 km W 44 -30 k m S 46 -30 k m N W 72 -30 km S 79 -30 k m N W 6 -35 km N 7 -35 k m N 14 -35 km W 15 -35 k m W 22 -35 km W N W 23 -35 k m W N W 38 -35 k m S 73 -35 km S 74 -35 k m S 10 -40 km N W 11 -40 k m N W 12 -40 km W 13 -40 k m W 36 -40 km N W 84 -40 km S W 3 -45 km N W 5 -45 km N 20 -45 k m N W 39 -45 km N or th 75 -45 k m S 4 -50 k m N W 37 -50 k m N W 2 -55 km N W 86 -55 km W 1 -60 km N W 85 -60 km N W Sampling points Probability of cancer (%)
Chart 9: Probability of cancer
As we can see from the chart, beyond 30 km, probabilities for the population of developing cancer due to the artificial radioactivity are obviously weaker than within the 30-km area (average of 1 271%) but they are far from being insignificant (581% point 36- 40 km NW, 533% point 2- 55km NW, 471% point 3- 45 km NW, etc ...). Note that most of these points are oriented NW and are thus under the dominant wind flow as noted above. It is in those places where no protective measures have been taken so far that health
monitoring must be done in the coming years, especially in children who are most susceptible to iodine-131 (thyroid cancer) and cesium-137 (childhood leukemia). Protective measures should be envisaged in this area by November 2011 when the threshold of 1 Sv will be reached since these annual exposure values of these points are between 1.34 and 1.66 Sv.
Map 2: The results of chart 9, map adapted from the Remy Scoccimaro’s map
(http://japgeo.free.fr/Sendai/FukushimaKen.png) 5- DISCUSSION
The problem of boundaries arises in an accurate way: boundaries are drawn to manage the space but could also have health impacts on people as they are not required to be confined while the above-mentioned areas are more exposed than others which are closer to the NPP. Taking into account other factors than the euclidean distance, such as the microclimatology, should help refine the boundaries in order to better match the actual exposure of populations. There is also the problem of access to data at a detailed level (municipalities) because the real interest of DBN would have been to contextualize the probability of developing cancer by variables related to the age of the population, number of children, number of women, type of dwelling (wooden, concrete) and agricultural activities (dairy products, vegetables, fisheries), but unfortunately we did not have access to those data.
6- REFERENCES
Bourguignon, M., Mercier, J.P., Vers une harmonisation internationale de la radioprotection : le point de vue de l’ASN, Contrôle (167), 2010, pp.40-44.
Bonner WM. Low-dose radiation : Thresholds, bystander effects, and adaptive responses. Proc Natl Acad Sci USA 2003, 100, 4973-5.
Bissel M.J., Radisky D. Putting tumours in context. Nature Reviews/Cancer 2001, 1, 46-54.
Brenner DJ., Doll R., Goodhead DT. et al Cancer risk attributable to low doses of ionizing radiation Assessing what we really know. Proc. Natl. Acad. Sci USA, 2003, 100, 13761-13766.
Camplin, W.C., Brownless, G.P., Round, G.D., Winpenny, K., and Hunt, G.J (2006),
Radionuclides & Radioprotection: Guide pratique, Paris:CEA and EDP Sciences.
Feinendegen, L.E., Neumann R.D., The issue of risk in complex adaptive systems: The case of low-dose radiation induced cancer. Hum Exp Toxicol. 2006; 25:11-17.
ICRP (2005), Low-dose Extrapolation of Radiation-related Cancer Risk. ICRP Publication 99. Ann. ICRP 35 (4)
Kawachi, I., Berkman, L., (2003) Neighborhoods and Health, Oxford University Press, 347p.
Korb, K.B., Nicholson, A.E., Bayesian Artificial Intelligence, Second Edition Chapman & Hall/CRC Computer Science & Data Analysis, 491p.
Lestaevel, P., Racine, R., Bensoussan, H., Rouas, C., and al. Césium 137 : propriétés et effets biologiques après contamination interne; Médecine Nucléaire Volume 34, Issue 2, February 2010, pp.108-118.
Manigandan, P.K. Activity concentration of radionuclides in plants in the environment of western ghats (India), African journal of plant science vol.3 (9) pp.205-209, September 2009.
Renaud P., Champion D., Brenot J., (2007), Les retombées radioactives de l’accident de Tchernobyl sur le territoire français. Conséquences environnementales et exposition des personnes, Paris:IRSN. Editions Tec et Doc - Lavoisier.
Sottas P-E., Bruzzi R., Vernez D., Mann S., Guillemin M., Droz P-O., (2005), A Bayesian framework for the combination of different occupational exposure assessment methods, IOHA.
Stannard J. Nevell, (1989) Radioactivity and Health: A History. Pacific Northwest Laboratory and U.S. Department of Energy.