HAL Id: hal-00304699
https://hal.archives-ouvertes.fr/hal-00304699
Submitted on 1 Jan 2002HAL is a multi-disciplinary open access archive for the deposit and dissemination of sci-entific research documents, whether they are pub-lished or not. The documents may come from teaching and research institutions in France or abroad, or from public or private research centers.
L’archive ouverte pluridisciplinaire HAL, est destinée au dépôt et à la diffusion de documents scientifiques de niveau recherche, publiés ou non, émanant des établissements d’enseignement et de recherche français ou étrangers, des laboratoires publics ou privés.
in Germany: dynamics and modelling with INCA
J.-J. Langusch, E. Matzner
To cite this version:
J.-J. Langusch, E. Matzner. N fluxes in two nitrogen saturated forested catchments in Germany: dynamics and modelling with INCA. Hydrology and Earth System Sciences Discussions, European Geosciences Union, 2002, 6 (3), pp.383-394. �hal-00304699�
N fluxes in two nitrogen saturated forested catchments in
Germany: dynamics and modelling with INCA
Jens-Johann Langusch and Egbert Matzner
Department of Soil Ecology, Bayreuth Institute for Terrestrial Ecosystem Research (BITÖK), University of Bayreuth, D-95440 Bayreuth Email for corresponding author: [email protected]
Abstract
The N cycle in forests of the temperate zone in Europe has been changed substantially by the impact of atmospheric N deposition. Here, the fluxes and concentrations of mineral N in throughfall, soil solution and runoff in two German catchments, receiving high N inputs are investigated to test the applicability of an Integrated Nitrogen Model for European Catchments (INCA) to small forested catchments. The Lehstenbach catchment (419 ha) is located in the German Fichtelgebirge (NO Bavaria, 690-871 m asl.) and is stocked with Norway spruce (Picea abies (L.) Karst.) of different ages. The Steinkreuz catchment (55 ha) with European beech (Fagus sylvatica L.) as the dominant tree species is located in the Steigerwald (NW Bavaria, 400-460 m asl.). The mean annual N fluxes with throughfall were slightly higher at the Lehstenbach (24.6 kg N ha-1) than at the Steinkreuz (20.4 kg N ha-1). In both catchments the N fluxes in the soil are dominated by NO
3. At
Lehstenbach, the N output with seepage at 90 cm soil depth was similar to the N flux with throughfall. At Steinkreuz more than 50 % of the N deposited was retained in the upper soil horizons. In both catchments, the NO3 fluxes with runoff were lower than those with seepage. The average annual NO3 concentrations in runoff in both catchments were between 0.7 to 1.4 mg NO3-N L-1 and no temporal trend was observed.
The N budgets at the catchment scale indicated similar amounts of N retention (Lehstenbach: 19 kg N ha-1 yr-1; Steinkreuz: 17 kg N ha-1 yr-1).
The parameter settings of the INCA model were simplified to reduce the model complexity. In both catchments, the NO3 concentrations and fluxes in runoff were matched well by the model. The seasonal patterns with lower NO3 runoff concentrations in summer at the Lehstenbach catchment were replicated. INCA underestimated the increased NO3 concentrations during short periods of rewetting in late autumn at the Steinkreuz catchment. The model will be a helpful tool for the calculation of “critical loads” for the N deposition in Central European forests including different hydrological regimes.
Keywords: forest ecosystem, modelling, N budgets, N saturation, NO3 leaching, water quality, INCA
Introduction
The N cycle in many forest ecosystems of the temperate zone has been changed substantially by the impact of atmospheric N deposition. The rates of N deposition differ in various regions but, in Central Europe, 20–40 kg N ha–1 yr–1 are commonly found in throughfall (Dise et al.,
1998a, b). These inputs represent a significant disturbance of the N cycle. The effects of chronically high N deposition in forest ecosystems are often summarised as ‘‘N-saturation”. According to Aber et al. (1989), N saturation in forest ecosystems is reached when the deposition of N and N mineralisation exceed the biological N demand. This leads to NO3 leaching into the groundwater and might increase the emission of N2O and NO from the soils.
Nitrate concentrations in ground and surface water from forested catchments are normally far less than those from highly fertilised pastures and farmlands. However, even a small increase in NO3 losses from forests may have large implications for drinking water management, since these waters are often used to dilute polluted water from other areas. Furthermore, NO3 losses cause changes in the biogeochemistry of the catchments by increasing cation losses and inducing a higher risk of water acidification due to Al leaching (Dise et al., 2001).
While substantial progress has been made in understanding the effects, predictions of the effects of N deposition on soil processes, trees, NO3 leaching and denitrification in specific forest ecosystems are still
uncertain. At a regional scale, the NO3 leaching from forests was related empirically to the N deposition and to the C/N ratio of the forest floor (Matzner and Grosholz, 1997; Dise
et al., 1998a, b). The positive influence of N deposition on
the emission of N2O and NO from forest soils remains a matter of debate (Brumme et al., 1999).
Deterministic models of N turnover in terrestrial ecosystems have been developed for and applied mainly to agricultural systems. In these systems, the N cycle is driven by large inputs from fertilization and large outputs with biomass export, denitrification and seepage. (Whitehead, 1990; Jones et al., 1991; Lunn et al., 1996). In contrast, N inputs to forests from the atmosphere occur only at relatively low rates and are distributed more or less homogeneously throughout the year. The outputs by denitrification and seepage are generally much lower (Brumme et al., 1999). Furthermore, the accumulation of N in biomass is small, while its immobilization in forest soils may be substantial (Magill et al., 1997).
Here, data are presented on N fluxes and concentrations in two different forested catchments in Germany subjected to high rates of atmospheric N deposition. Long term developments and seasonal dynamics of NO3 in runoff and on N budgets at the catchment scale are examined and the information collected is used to test the INCA model (Integrated Nitrogen Model for European Catchments; Whitehead et al., 1998a, b) for its performance in predicting N fluxes for small forested catchments. The INCA model simulates flow pathways, N turnover including uptake and denitrification, fluxes and concentrations of both nitrate-N and ammonium-N in the soil, the groundwater and the river in daily resolution.
Sites and methods
SITES
The Steinkreuz catchment (55 ha in area) is located in the German Steigerwald area, 49°52´20´´ N, 10°27´40´´ E, at elevations between 400–460 m asl. The average air temperature is 7.5°C and mean annual precipitation is some 750 mm. Bedrock is Triassic sandstone (Middle Keuper) with clayey layers. Dominating soil types are Dystric Cambisols and Vertic Cambisols (FAO-System). Gleyic Cambisols occur only on small areas close to the creek. The soils are of sandy to loamy texture (Gerstberger, 2001). The forest stand comprises 75% of 130-year old European beech (Fagus sylvatica L.) with 25% sessile oak (Quercus petraea (Matt.) Liebl.) of the same age.
The Lehstenbach catchment (419 ha in area) is located in the German Fichtelgebirge area, 50°08´35´´ N, 11°52´10´´ E
at 690–871 m. The average air temperature is 5.8°C and the mean annual precipitation is 1100 mm. Bedrock is granite and the dominating soil types are acidic Cambisols, Gleysols and Histosols (FAO-System). A substantial area of the catchment is covered by wetlands and bogs (35%). The catchment is afforested by old Norway spruce (Picea abies (L.) Karst.) 45 to 160 years old. The stand at the plot ‘Coulissenhieb’ was planted in 1850. The Coulissenhieb site, located in the terrestrial part of the catchment with Cambisols and Cambic Podzols as dominating soil types (Gerstberger, 2001) has soil texture which varies from loamy sand to loam.
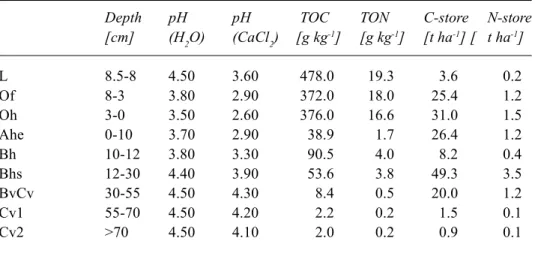
The C pools in the soil are higher at Coulissenhieb than at Steinkreuz (Table 1). The N pool of the Coulissenhieb soil is about 9400 kg ha–1 with 2900 kg ha–1 in the forest
floor. At Steinkreuz, the total N pool of the soil was 6100 kg ha–1 with only 600 kg ha–1 in the forest floor.
Methods
At the Steinkreuz catchment, precipitation has been measured daily since January 1995. Samples for analysis of major elements have been collected bi-weekly with three replicates. Volume and element concentrations in throughfall have been measured bi-weekly in nine parallel samples from January 1995. Three of the nine samples are combined to give three mixed samples which are analysed for major elements. Stemflow amounts to about 7% of the soil water input and was measured at five trees. Samples of stemflow water were analysed for major elements bi-weekly. Ceramic suction lysimeters (seven replicates) were used to sample soil solution at 60 cm soil depth. Soil solutions have been collected and analysed bi-weekly since May 1995.
Discharge at the weir has been measured daily since November 1994 and water samples have been taken bi-weekly since then. Measurements of air temperature, air humidity, solar radiation, wind speed and wind velocity have been made since November 1994 at an open field station.
At the Lehstenbach catchment, bulk precipitation and throughfall as well as soil solution samples were sampled at the ‘Coulissenhieb’ plot. The volume of bulk precipitation has been measured daily since January 1994 and samples for analysis of macro-elements are collected bi-weekly with five replicates. Volume and element concentrations in throughfall have been measured bi-weekly in 20 parallel samples since June 1992. Ceramic suction lysimeters (20 replicates) have been used to sample soil solution at 90 cm soil depth. Soil solution samples have been collected bi-weekly since June 1993. Discharge at the weir has been measured daily since November 1986. Water samples have been taken bi-weekly since November 1987 for analysis of
Table 1a. Soil properties and soil N storage at the Steinkreuz catchment.
Depth pH pH C N C-store N-store [cm] (H2O) (CaCl2) [g kg-1] [g kg-1] [t ha-1] [t ha-1] L 3-2 5.30 4.70 445.0 20.4 Of 2-0.5 5.10 4.50 413.0 21.8 12.0a 0.6a Oh 0.5-0 4.10 3.40 205.0 11.5 I Ah 0-5 3.90 3.20 66.9 4.3 35.5 2.3 I Bv 5-24 4.30 3.80 10.9 0.6 27.1 1.5 I Swd-Bv1 24-50 4.60 3.90 3.5 0.2 7.1 0.4 I Swd-Bv2 50-80 4.90 4.00 1.6 0.2 4.1 0.5 II Cv 80-85 5.20 4.10 1.4 0.3 0.6 0.1 III Cv 85-115 5.20 4.10 1.4 0.2 1.9 0.3 IV Cv1 >115 5.50 4.20 0.7 0.1 1.4 0.2 IV Cv2 5.50 4.20 0.8 0.1 1.3 0.2
a = Sum of: L+Of+Oh
Table 1b. Soil properties and soil N storage at the Lehstenbach catchment.
Depth pH pH TOC TON C-store N-store [cm] (H2O) (CaCl2) [g kg-1] [g kg-1] [t ha-1] [ t ha-1] L 8.5-8 4.50 3.60 478.0 19.3 3.6 0.2 Of 8-3 3.80 2.90 372.0 18.0 25.4 1.2 Oh 3-0 3.50 2.60 376.0 16.6 31.0 1.5 Ahe 0-10 3.70 2.90 38.9 1.7 26.4 1.2 Bh 10-12 3.80 3.30 90.5 4.0 8.2 0.4 Bhs 12-30 4.40 3.90 53.6 3.8 49.3 3.5 BvCv 30-55 4.50 4.30 8.4 0.5 20.0 1.2 Cv1 55-70 4.50 4.20 2.2 0.2 1.5 0.1 Cv2 >70 4.50 4.10 2.0 0.2 0.9 0.1
major elements. Meteorological measurements of air temperature, air humidity, solar radiation, wind speed and wind velocity have been made since May 1994 at an open field station.
The water fluxes with seepage at the plot-scale were calculated by the soil water model Hydrus-2D (Simúnek et
al., 1996) for Steinkreuz at 60 cm depth and by the model
SIMULA18, (Manderscheid, 1995) at 90 cm depth for the Coulissenhieb plot. Both models simulate seepage based on estimates of actual transpiration, soil physical parameters and root distribution.
Parameterisation of the INCA model
The driving data for the INCA model, including soil moisture deficit, hydrologically effective rainfall, airtemperature, actual throughfall, discharge and inorganic nitrogen concentrations were compiled for the period 1995– 1999. Soil water deficit was calculated as the difference between actual transpiration and throughfall. At the Steinkreuz, the calculated seepage at 60 cm depth was taken as hydrologically effective rainfall while at Lehstenbach, the hydrologically effective rainfall was calculated as throughfall – actual transpiration – soil water deficit.
At the Steinkreuz catchment, a discharge to deeper groundwater that is not accounted for at the weir measurements, is suggested by the fact that the Cl budget (throughfall + stemflow – runoff) of the catchment is strongly positive over the five years using measured discharge rates. In addition, transpiration measurements at the trees revealed annual transpiration rates of only 180 mm (Tenhunen et al., 2001) which supports the suggestion of
groundwater losses from the catchment. Thus, the discharge was adjusted to a balanced long term Cl budget which resulted in an average discharge rate of 257 mm. The latter was also used to calculate the annual fluxes of elements in runoff.
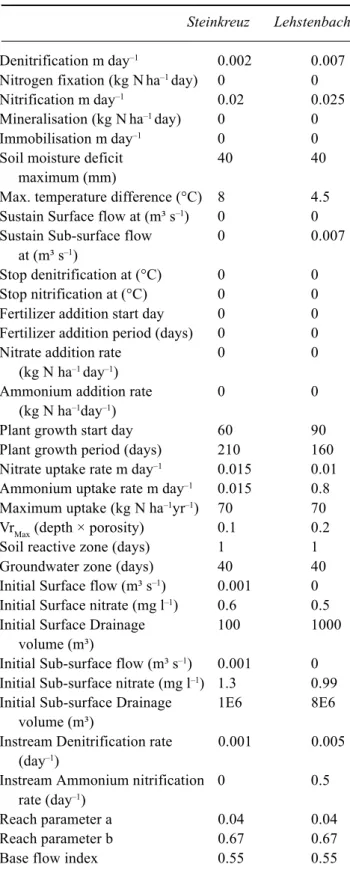
The parameterisation of the model was simplified to reduce the complexity. The soil N pools were assumed to be in steady state (Table 2) and, subsequently, the rates of NH4 mineralisation, NH4 immobilisation and the NO3 fixation were set to zero. Only one land-use type was postulated. Plant uptake was adjusted to give the N demand for net increment of the trees. To account for the larger area of hydromorphic sites, the denitrification rate for the Lehstenbach was set higher than for the Steinkreuz catchment. The greater size of the Lehstenbach leads to higher initial surface and sub-surface drainage volumes. Because of the higher elevation, the plant growth period at Lehstenbach is shorter than at Steinkreuz.
The NH4 uptake is assumed to be higher in spruce stands than in beech stands (Berger, 1995).
Results
HYDROLOGY
The distribution of throughfall is rather homogenous throughout the year in both catchments (Fig. 1). Maximum
Table 2. Parameters of the INCA model used for the
modelling.
Steinkreuz Lehstenbach
Denitrification m day–1 0.002 0.007
Nitrogen fixation (kg N ha–1day) 0 0
Nitrification m day–1 0.02 0.025
Mineralisation (kg Nha–1day) 0 0
Immobilisation m day–1 0 0
Soil moisture deficit 40 40
maximum (mm)
Max. temperature difference (°C) 8 4.5 Sustain Surface flow at (m³ s–1) 0 0
Sustain Sub-surface flow 0 0.007
at (m³ s–1)
Stop denitrification at (°C) 0 0
Stop nitrification at (°C) 0 0
Fertilizer addition start day 0 0
Fertilizer addition period (days) 0 0
Nitrate addition rate 0 0
(kg N ha–1day–1)
Ammonium addition rate 0 0
(kg N ha–1day–1)
Plant growth start day 60 90
Plant growth period (days) 210 160
Nitrate uptake rate m day–1 0.015 0.01
Ammonium uptake rate m day–1 0.015 0.8
Maximum uptake (kg N ha–1yr–1) 70 70
VrMax (depth × porosity) 0.1 0.2
Soil reactive zone (days) 1 1
Groundwater zone (days) 40 40
Initial Surface flow (m³ s–1) 0.001 0
Initial Surface nitrate (mg l–1) 0.6 0.5
Initial Surface Drainage 100 1000
volume (m³)
Initial Sub-surface flow (m³ s–1) 0.001 0
Initial Sub-surface nitrate (mg l–1) 1.3 0.99
Initial Sub-surface Drainage 1E6 8E6
volume (m³)
Instream Denitrification rate 0.001 0.005 (day–1)
Instream Ammonium nitrification 0 0.5
rate (day–1)
Reach parameter a 0.04 0.04
Reach parameter b 0.67 0.67
Base flow index 0.55 0.55
0 20 40 60 80 100 120 140
Jan-95 Jan-96 Jan-97 Jan-98 Jan-99
mm a 0 2 4 6 8 10 12 14 16 18
Jan-95 Jan-96 Jan-97 Jan-98 Jan-99
mm
Steinkreuz Lehstenbach
Table 3. Annual water fluxes with throughfall and discharge (in mm) at both catchments.
Year Steinkreuz Lehstenbach
TF+SF Runoffa Runoffb TF Runoffa
1995 723.8 251.4 318.8 836.1 689.4 1996 576.2 156.3 243.5 690.5 490.0 1997 483.7 132.0 183.5 645.5 416.6 1998 615.3 149.0 301.4 951.5 614.8 1999 589.5 191.5 239.4 745.3c 482.5c Mean: 597.7 176.0 257.3 773.8 538.7
a= Measured at the weir b= Runoff according to Cl-budget
c= 01/99-10/99: observed values; 11/99-12/99: estimated from long term average TF = Throughfall
SF = Stemflow
rates of throughfall observed at the bi-weekly scale were about 80 mm at Steinkreuz and 120 mm at Lehstenbach. Runoff is at a minimum in summer in both catchments. Maximum daily discharge rates were 6 mm at Steinkreuz and 16 mm at Lehstenbach. The creek at Steinkreuz is almost dry during the late summer while, at the Lehstenbach creek, there was a baseflow of about 0.25 mm d–1 in summer. At
the Lehstenbach, snow cover and snow melt have a substantial effect on winter and spring hydrology, which is not the case for the Steinkreuz. The mean discharge from 1995–1999 was 539 mm at Lehstenbach, while in Steinkreuz only 176 mm (Table 3) was measured at the weir. The annual discharge rates from 1995 to 1999 varied by about 270 mm at the Lehstenbach but only by about 120 mm at Steinkreuz. N-CONCENTRATIONS
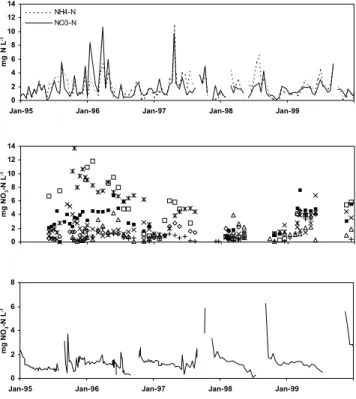
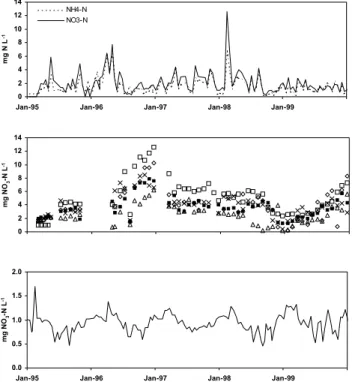
Mineral N concentrations in throughfall were similar in both catchments (Fig. 2a, b and Table 5a, b). Furthermore, the concentrations of NH4 and NO3 in throughfall were almost equal. The concentrations of dissolved organic nitrogen (DON) in throughfall were substantial and reached about 29.2% of the mineral N at the Steinkreuz and 15.4% at the Lehstenbach. In contrast to throughfall, mineral N in soil solutions and runoff is almost completely represented by NO3. The concentrations of DON in soil solutions and runoff are generally low and close to detection (< 0.2 mg N l-1).
Concentrations of N in throughfall are highly variable with time while those in soil solutions had less short term variation. Soil solution concentrations of NO3 showed a large spatial variation and some long term patterns in both plots: at Steinkreuz, the concentrations were generally low in 1998
0 2 4 6 8 10 12 14
Jan-95 Jan-96 Jan-97 Jan-98 Jan-99
mg N L -1 NH4-N NO3-N 0 2 4 6 8 10 12 14 mg NO 3 -N L -1 0 2 4 6 8
Jan-95 Jan-96 Jan-97 Jan-98 Jan-99
mg NO
3
-N L
-1
Fig. 2a. Nitrogen concentrations in throughfall, soil solutions and runoff at the Steinkreuz catchment
and 1999 while at Lehstenbach, low concentrations were found in 1995 and 1999. The concentrations observed in runoff in both catchments are lower than average soil solution concentrations. In both catchments, the concentrations in runoff were similar with annual means between 0.7 and 1.4 mg NO3-N l–1. The temporal patterns
the runoff from the Lehstenbach, there was a seasonal pattern with lower concentrations in summer and autumn followed by higher concentrations in winter and spring. At Steinkreuz, peaks of NO3 concentrations in runoff ocurred shortly after rewetting in late autumn. No long term trend of NO3 in runoff was observed in either catchment and the concentrations of NO3 were not related to discharge volume (Fig. 3). N FLUXES
The fluxes of mineral N with throughfall were on average higher at Lehstenbach (21 kg N ha–1 yr–1) than at Steinkreuz
(15.7 kg N ha–1 yr–1; Table 4a, b). The fluxes of DON in
throughfall were remarkable with slightly higher fluxes at Steinkreuz. The annual variation in throughfall fluxes was low except for DON at Steinkreuz where fluxes varied between 3.7 to 5.6 kg N ha–1 yr–1.
The N fluxes with soil solution were clearly dominated by NO3 in both catchments, but the fluxes differed between the catchments. At Lehstenbach, the seepage output of about 21 kg N ha–1 yr–1 was almost equal to the NH
4 + NO3 flux in
throughfall, while at Steinkreuz seepage was about 6 kg N ha–1 yr–1 (Table 4a). The annual variation of the NO
3 fluxes
with seepage was high at Steinkreuz with a range of 3.8 to 9.4 kg N ha–1 yr–1. In contrast, the annual variation at the
Coulissenhieb plot was low.
The NO3 fluxes with runoff from both catchments had only small annual variations and no trend was visible. Fluxes of DON in seepage and runoff were negligible. On average, the runoff flux was about 4.9 kg N ha–1 yr–1 at Lehstenbach
and 3.3 kg N ha–1 yr–1 at Steinkreuz. Thus, in both catchments
the seepage flux of NO3 was higher than with runoff. This observation was most pronounced at the Lehstenbach.
Taking the throughfall fluxes of N (including DON) as deposition input and runoff as output, both catchments retained (including gaseous emissions) large amounts of N. In case of the Steinkreuz, a retention of 17 kg N ha–1 yr–1
was found on average (Table 4a). At Lehstenbach, the N retention was about 19 kg N ha–1 yr–1 (Table 4b).
The N budgets for the plots, calculated as throughfall–N (incl. DON) minus seepage, revealed differences: The average N retention at the Steinkreuz plot was about 14 kg N ha–1 yr–1 which is similar to the retention at the catchment
scale while only 3 kg N ha–1 yr–1 were retained at the
Coulissenhieb plot which is far less than the retention observed at the catchment scale.
INCA APPLICATION 0 2 4 6 8 10 12 14
Jan-95 Jan-96 Jan-97 Jan-98 Jan-99
mg N L -1 NH4-N NO3-N 0 2 4 6 8 10 12 14 mg NO 3 -N L -1 0.0 0.5 1.0 1.5 2.0
Jan-95 Jan-96 Jan-97 Jan-98 Jan-99
mg NO
3
-N L
-1
Fig. 2b. Nitrogen concentrations in throughfall, soil solutions and runoff at the Lehstenbach catchment
m³/s mg NO 3 -N L -1 0 1 2 3 4 5 6 0.0 0.1 0.2 0.3 0.4 0.5 0.6 0.7 Steinkreuz Lehstenbach
Fig. 3. Simulated nitrate concentrations in runoff as related to discharge m³/s mg NO 3 -N L -1 0 1 2 3 4 5 6 0.0 0.1 0.2 0.3 0.4 0.5 0.6 0.7 Steinkreuz Lehstenbach
Fig. 4. Observed nitrate concentrations in runoff as related to discharge
Table 4a. Annual nitrogen fluxes (kg N ha–1 yr–1) with throughfall (TF), seepage
in 60 cm soil depth (SP) and runoff (R) in the Steinkreuz catchment.
1995 1996 1997 1998 1999 Mean TF NO3-N 7.33 7.30 7.25 6.46 7.40 7.15 NH4-N 10.31 7.45 8.80 8.46 8.09 8.62 DON - 4.01 5.58 5.10 3.74 4.61 SP NO3-N - 7.45 3.87 3.88 9.36 6.14 NH4-N - 0.45 0.09 0.11 0.14 0.20 DON - n.d. n.d. n.d. n.d. n.d. Ra NO 3-N 3.39 3.89 2.28 3.95 3.28 3.36 NH4-N 0.06 0.11 0.04 0.06 0.05 0.06 DON n.d. n.d. n.d. n.d. n.d. n.d.
a = Runoff volume adjusted to Cl-budget (see Table 3) n.d. = not detectable
- = not measured
Table 4b. Annual nitrogen fluxes (kg N ha–1 yr–1) with throughfall (TF), seepage
in 90 cm soil depth (SP) and runoff (R) in the Lehstenbach catchment.
1995 1996 1997 1998 1999a Mean TF NO3-N 14.85 10.89 12.01 12.73 9.76 12.05 NH4-N 11.02 9.21 9.25 9.07 7.87 9.28 DON 2.23 3.02 4.26 3.68 3.23 3.28 SP NO3-N 21.36 24.49 20.03 20.25 18.09 20.84 NH4-N 0.39 0.49 0.28 0.30 0.30 0.35 DON n.d. n.d. n.d. n.d. n.d n.d. R NO3-N 5.94 5.20 4.14 4.27 5.09 4.93 NH4-N 0.21 0.29 0.17 0.22 0.23 0.22 DON n.d. n.d. n.d. n.d. n.d. n.d.
a = 01/99-10/99: observed values; 11/99-12/99: estimated
Figure 3 shows the relation of the simulated daily NO3-N concentration to the simulated daily discharge. As is observed in practice (Fig. 4) the simulated runoff NO3 concentrations for both catchments were not related to the volume of discharge.
The simulated discharge for the Steinkreuz catchment was much higher than that observed since the seepage water fluxes at the catchment scale were input as hydrologically
effective rainfall. Thus, the simulated discharge in INCA did not correspond well with the measurements (Fig. 5a).
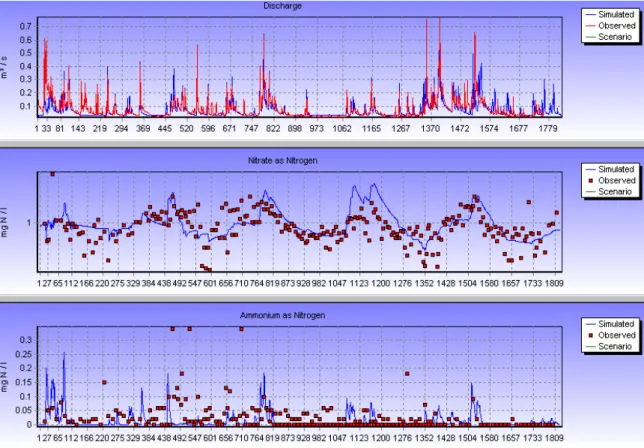
The observed NO3 concentrations in runoff in the Steinkreuz were generally matched well by the model (Fig. 5a). The measured annual average concentration of NO3 -N is 1.32 mg l–1 while the model calculated an average
concentration of 1.12 mg l–1; INCA underestimated the NO 3
Fig. 5a. Simulated discharge and nitrogen concentrations in runoff of the Steinkreuz catchment
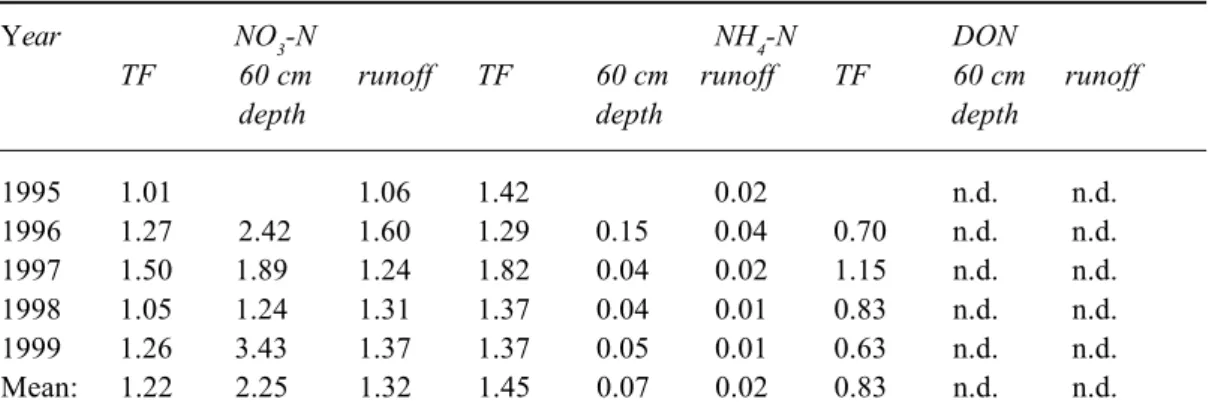
Table 5a. Average concentrations of nitrogen (mg N l–1) in solutions of the Steinkreuz catchment
Year NO3-N NH4-N DON
TF 60 cm runoff TF 60 cm runoff TF 60 cm runoff depth depth depth
1995 1.01 1.06 1.42 0.02 n.d. n.d. 1996 1.27 2.42 1.60 1.29 0.15 0.04 0.70 n.d. n.d. 1997 1.50 1.89 1.24 1.82 0.04 0.02 1.15 n.d. n.d. 1998 1.05 1.24 1.31 1.37 0.04 0.01 0.83 n.d. n.d. 1999 1.26 3.43 1.37 1.37 0.05 0.01 0.63 n.d. n.d. Mean: 1.22 2.25 1.32 1.45 0.07 0.02 0.83 n.d. n.d.
Table 5b. Average concentrations of nitrogen (mg N l–1) in solutions of the Lehstenbach catchment
Year NO3-N NH4-N DON
TF 90 cm runoff TF 90 cm runoff TF 90 cm runoff depth depth depth
1995 1.78 4.15 0.86 1.32 0.08 0.03 0.27 n.d. n.d. 1996 1.58 5.02 1.06 1.33 0.10 0.06 0.44 n.d. n.d. 1997 1.86 4.48 0.99 1.43 0.06 0.04 0.66 n.d. n.d. 1998 1.34 3.82 0.69 0.95 0.06 0.04 0.39 n.d. n.d. 1999a 1.31 3.74 1.05 1.06 0.06 0.05 0.43 n.d. n.d. Mean: 1.57 4.24 0.93 1.22 0.07 0.04 0.44 n.d. n.d.
a= 01/99-10/99: observed values; 11/99-12/99: estimated
Table 6. Simulated N fluxes
Steinkreuz Lehstenbach Σ 95–99 Σ 95–99 kg N ha–1 kg N ha–1 Nitrate-N total 35.81 60.15 Ammonium-N total 43.11 46.29 Nitrate-N leaching 16.79 26.90 Observed values 16.79a 24.64b Ammonium-N leaching 2.79 2.77 Observed values 0.32a 1.12b Nitrate-N Uptake 32.06 19.29 Ammonium-N uptake 12.01 24.67 Ammonium-N nitrification 26.39 15.77 Nitrate-N denitrification 12.85 31.34 ∆ Store +2.42 +1.47
a = corrected according to Cl-budget
b = 01/99-10/99: observed values; 11/99-12/99: estimated
In forested catchments the NH4 concentration level in freshwaters is generally low. The model slightly overestimated the runoff NH4 concentrations and the NH4 leaching with the present parameterisation (Fig. 5a and Table 6).
For the period 1995–1999, the mass balance for N was close to zero. INCA calculated a change of the N store of the catchment of 2.42 kg N ha–1 over the whole period (Table
6). The measured NO3 leaching of 16.8 kg ha–1 for the five
years (calculated with the discharge volumes adjusted to the Cl- budget), was matched by the model.
The mean annual denitrification of 2.6 kg N ha–1,
calculated by INCA in the case of the Steinkreuz catchment with a given denitrification rate of 0.002 d–1, corresponds
to measurements in other beech forests (Borken and Brumme, 1997; Butterbach-Bahl et al., 2001). Also the model parameterisation resulted in annual average plant uptake rates of 6.4 kg ha–1 NO
3-N and of 2.4 kg ha–1 NH4
-N, which corresponds to the total N demand for increment at older beech sites (Matzner, 1988).
pattern of discharge simulation corresponded in most cases to the observed changes (Fig. 5b). Deviations occurred in 1995 (between day number 145 and 230), where INCA failed to observe increases in discharge, and the simulated runoff exceeded the observed values in 1999.
The general concentration level for NO3 in runoff is well matched. The measured annual average concentration of NO3-N was 0.92 mg l–1 while the model calculated 0.99 mg
l–1. Furthermore, the seasonality of the runoff NO 3
concentration, which is characterised by higher values in the winter and lower in summer, is reproduced well by the model.
As with the Steinkreuz, the model slightly overestimated the NH4 concentrations in runoff and the NH4 leaching with the present parameterisation. The model calculated a NO3 flux with runoff of 26.9 kg N ha–1 for the five years period,
which is close to the observation (24.6 kg ha–1).
For the period 1995–1999, INCA calculated a change of N store in the catchment of only + 1.47 kg N ha–1 (Table 6)
indicating that the mass balance of N was close to zero. The model parameterisation resulted in a mean annual denitrification of 6.3 kg N ha–1 for the Lehstenbach. This
reflects the obviously high N outputs by denitrification from the large wetland areas of the Lehstenbach catchment. High rates of denitrification were also postulated from comparing NO3 in soil solution, groundwater and runoff in the Lehstenbach (Matzner et al., 2001).
Given the present parameterisation, INCA calculated mean annual plant uptake rates of 3.9 kg ha–1 NO
3-N and of
4.9 kg ha–1 NH
4-N. The overall rates of N uptake correspond
to those estimated for comparable Norway spruce sites (Matzner, 1988).
Discussion
GENERAL
Both catchments studied receive high rates of N deposition as indicated by the observed N fluxes in throughfall which are typical for Central European conditions (Dise et al., 1998a, b; Armbruster et al., 2001). The N fluxes with throughfall underestimate the actual N input because of above ground uptake of N by needles and leaves. The extent of underestimation is difficult to assess (Harrison et al., 2000). Beside deposition rates, both catchments have further similarities in their N turnover. The average annual NO3 concentrations in runoff were between 0.7–1.4 mg l–1 in both
catchments, leading to average losses with runoff of 3.3 (Steinkreuz) to 4.9 (Lehstenbach) kg N ha–1 yr–1. Nitrate
was the dominant N form in soil solutions and in runoff from both catchments. There was some seasonal variation
of NO3 in runoff in both but no overall trend in NO3 was found. In the case of the Lehstenbach, the lack of long term trend in runoff can be extended back to 1987 (Matzner et
al., 2001). Small seasonal variations of NO3 concentrations in the runoff from forested catchments and the lack of long term trends were also reported from other European forested catchments (Wright et al., 2002).
At the plot scale, however, the N turnover is significantly different at the spruce dominated Coulissenhieb plot compared with the beech dominated Steinkreuz plot. N retention was very low at the Coulissenhieb plot, indicating severe N saturation. Losses of N with seepage almost equalled N fluxes in throughfall. In contrast, the N retention at the Steinkreuz plot was much higher. There was no general difference in N retention between coniferous and deciduous tree species when a large number of plots and catchments in Europe were compared (Dise et al., 1998a). The C/N ratios of the forest floor were rather low in both plots and, while not indicating differences in immobilization capacity of the soil, suggest a high risk of NO3 leaching (Gundersen
et al., 1998). It is only possible to speculate on the retention
mechanisms responsible for the N retention at the plot scale. Brumme et al. (1999) reported higher rates of N2O emissions from beech sites compared to spruce sites, but the rates cannot account fully for the difference. The stand at the Coulissenhieb plot is older and less dense than that at the Steinkreuz plot which might result in higher plant uptake rates of N at Steinkreuz. However, the calculation of N retention is based on throughfall N fluxes which underestimate deposition rates. At the Coulissenhieb plot, the unknown N uptake by the canopy might be higher as compared to Steinkreuz because of the high fog frequency at these elevations (Klemm et al., 2001).
The difference between N fluxes with seepage at the plot scale compared to runoff from the catchment were minor at Steinkreuz. At the Lehstenbach, however, the large difference between N fluxes with seepage from the terrestrial site and the N flux in runoff are influenced by the riparian zones which cover about 35% of the catchment. Denitrification is likely to play a significant role in regulating the N budget of the Lehstenbach catchment. There are no field measurements of denitrification available for the catchment studied here but a reduction in sulphate was reported in the riparian zones of the Lehstenbach catchment (Alewell and Giesemann, 1996; Alewell and Novak, 2001), indicating severe anoxic conditions in these areas.
Overall, the N budget of both catchments seems to be in a steady state where N sinks in the ecosystem (biomass and soil organic matter) and losses by denitrification match the present N input by deposition.
INCA APPLICATION
With a simplified parameter set, INCA matched the general level of NO3 concentrations and fluxes in runoff at the Steinkreuz and the Lehstenbach catchments. The calculated annual loads for the single processes of the N-cycle, were realistic. The parameter settings resulted in a good representation of the seasonal patterns in NO3 of the runoff from the Lehstenbach. However, the model was not able to follow the NO3 concentrations in runoff at the Steinkreuz catchment during rewetting. This is an exceptional case since, in this very small catchment, the creek becomes dry in summer. The water fluxes at these particular periods were small and this had little effect on the annual runoff fluxes calculated by the model.
INCA estimated NH4 leaching rates which are about 0.3– 0.5 kg ha–1 yr–1 higher than those observed. The calibration
of the model to realistic NH4 leaching rates was difficult because the NH4 plant uptake is zero in winter and nitrification is low in the model while leaching takes place during the whole year.
Papen and Butterbach-Bahl (1999) as well as Teepe et al. (2000) observed the highest N2O emissions from forest soils during thawing periods in winter. This is not accounted for in the model since denitrification is inhibited in winter by low temperatures. However, this had no apparent influence on the model predictions of nitrate in runoff.
From the viewpoint of the N turnover in small homogeneous forested catchments, there are general shortcomings of the model. All parameters and rates are kept constant throughout the simulation and there is no dynamic feedback between inputs, environmental conditions and process rates. Those are, in fact, often not even known today in the case of forested catchments. For the parameterisation of the model, the rates of N transforming processes need to be known in advance or must be calibrated. Thus, most of the model results in terms of uptake, mineralisation, and denitrification and runoff losses are given as input and the predictive capability on N turnover and fluxes under changing conditions is limited.
The big advantage of the INCA model in application to forested catchments is that the prediction of NO3 output is based on hydrological conditions allowing an analysis of NO3 concentrations patterns in runoff throughout the year and under varying hydrological conditions. There is a clear and substantial use of the model in the calculation of critical loads of N deposition for forests. Models used presently are based on steady state mass balance using annual fluxes and without taking hydrological conditions into account (Werner et al., 1999; van der Salm and de Vries, 2001). INCA seems to be an excellent tool to calculate NO3
concentrations and NO3 fluxes under a variety of deposition backgrounds and hydrological conditions with seasonal to daily resolution. This needs to be tested in future work.
Acknowledgement
This work was funded by the EU under grant No. EVK1-CT1999-00011 and by the German Ministry of Education, Science and Technology (BMBF) grant No. BEO 0339476D. The authors thank Bernhard Manderscheid, Christine Alewell and Gunnar Lischeid for providing data on N fluxes and Karsten Kalbitz for soil data as well as Uwe Hell, Andreas Kolb, Jan Irmler and the members of the Central Analytic Department of BITÖK (Bettina Popp, Petra Dietrich and Kerstin Moser) for their long lasting help in field sampling and chemical analysis of soil and water samples.
References
Aber, J.D., Nadelhoffer, K.J., Steuder, P. and Melillo, J.M., 1989. Nitrogen Saturation in Northern Forest Ecosystems. BioScience,
39, 378–386.
Alewell, C. and Giesemann, A., 1996. Sulfate reduction in a forested catchment as indicated by 34S values of sulfate in soil solutions and runoff. Isot. Environ. Health Stud., 32, 203–210. Alewell, C. and Novak, M., 2001. Spotting zones of dissimilatory sulfate reduction in a forested catchment: the 34S - 35S approach.
Environ. Pollut., 112, 369–377.
Armbruster, M., Matzner, E. and Langusch, J., 2001. Indikatoren des Stoffhaushaltes von Waldökosystemen. Bayreuther Forum
Ökologie, 84, 189–204.
Berger, A., 1995. Wirkungen von Angebot und Bedarf auf den Stickstoff- und Magnesiumhaushalt von Fichtenkeimlingen (Picea abies (L.) KARST.). Bayreuther Forum Ökologie, 23. Borken, W. and Brumme, R., 1997. Liming practice in temperate
forest ecosystems and effects on CO2, N2O and CH4 fluxes. Soil
Use Manage., 13, 251–257.
Brumme, R., Borken, W. and Finke, S., 1999. Hierarchical control on nitrous oxide emission in forest ecosystems. Global
Biogeochem. Cycles, 13, 1137–1148.
Butterbach-Bahl, K., Rothe, A. and Papen, H., 2001. Effect of tree distance on N2O and CH4 fluxes from soils in temperate forest ecosystems. Plant Soil.
Dise, N.B., Matzner, E. and Gundersen, P., 1998a. Synthesis of nitrogen pools and fluxes from European forest ecosystems.
Water Air Soil Pollut., 105, 143–154.
Dise, N.B., Matzner, E. and Forsius, M., 1998b. Evaluation of organic horizon C:N ratio as an indicator of nitrate leaching in conifer forests across Europe. Environ. Pollut., 102, 453–456. Dise, N.B., Matzner, E., Armbruster, M. and MacDonald, J., 2001. Aluminium output fluxes from forest ecosystems in Europe: A regional assessment. J. Environ. Qual.
Gerstberger, P. (Ed.), 2001. Waldökosystemforschung in Nordbayern: Die BITÖK-Untersuchungsflächen im Fichtelgebirge und Steigerwald. Bayreuther Forum Ökologie,
90, 193pp.
Gundersen, P., Callesen, I. and de Vries, W., 1998. Nitrate leaching in forest ecosystems is related to forest floor C/N ratios. Environ.
Harrison, A.F., Schulze, E.-D., Gebauer, G. and Bruckner, G., 2000. Canopy uptake and utilization of atmospheric pollutant nitrogen. In: Carbon and Nitrogen Cycling in European Forest
Ecosystems. E.-D. Schulze (Ed.). Springer Berlin. Ecol. Stud., 142, 171–188.
Jones, C.A., Dyke, P.T., Williams, J.R., Kiniry, J.R., Benson, V.W. and Griggs, R.H., 1991. EPIC: An operational model for the evaluation of agricultural sustainability. Agr. Syst., 37, 341–350. Klemm, O., Milford, C., Sutton, M.A., van Putten, E. and Spindler, G., 2001. A climatology of leaf surface wetness. Theor. Appl.
Climatol.
Lunn, R.J., Adams, R., Mackay, R. and Dunn, S.M., 1996. Development and application of a nitrogen modelling system for large catchments, J. Hydrol., 174, 285–304.
Magill, A.H., Aber, J.D., Hendricks, J.J., Bowden, R.D., Melillo, J.M. and Steudler, P.A., 1997. Biogeochemical response of forest ecosystem to simulated chronic nitrogen deposition. Ecol. Appl.,
7, 402–415.
Manderscheid, B., 1995. Modelldokumentation Wasserhaushaltsmodell SIMULA 18, Ber. d.
Forschungszentrums Waldökosysteme Göttingen, Reihe B, 42,
41–48.
Matzner, E., 1988. Der Umsatz zweier Waldökosysteme im Solling. Ber. d. Forschungszentrums
Waldökosysteme/Wald-sterben d. Univ. Göttingen, Reihe A, 40, 217 pp.
Matzner, E. and Grosholz, C., 1997. Beziehung zwischen NO3 -Austrägen, C/N-Verhältnissen der Auflage und N-Einträgen in Fichtenwald (Picea abies Karst.) - Ökosystemen Mitteleuropas.
Forstwissenschaftliches Centralblatt, 116, 39–44.
Matzner, E., Alewell, C., Bittersohl, J., Lischeid, G., Kammerer, G., Manderscheid, B., Matschonat, G., Moritz, K., Tenhunen, J.D. and Totsche, K., 2001. Biogeochemistry of a spruce forest catchment of the Fichtelgebirge in response to changing atmospheric deposition. In: Ecosystem Approaches to Landscape
Management in Central Europe, J.D. Tenhunen, R. Lenz and
R. Hantschel, (Eds.). Springer-Heidelberg, Ecol. Stud., 147, 463–504.
Papen, H. and Butterbach-Bahl, K., 1999. A 3-year continuous record of nitrogen trace gas fluxes from untreated and limed soil of a N-saturated spruce and beech forest ecosystem in Germany 1. N2O emissions, J. Geophys. Res., 104, D15, 487– 503.
Simúnek, J., Sejna, M. and van Genuchten, T., 1996. HYDRUS-2D simulating water flow and solute transport in two-dimensional variably saturated media. Int. Ground Water Model.
Center, Golden Colorado, 167 pp.
Tenhunen, J.D., Falge, E., Köstner, B. and Schmidt, M., 2001. Bedeutung des Lichtklimas und Blattflächenentwicklung für die Wasser und CO2-Flüsse des Kronendachs entlang eines Baumarten Gradienten im Steigerwald. Bayreuther Forum für
Ökologie, 84, 45–60.
Teepe, R., Brumme, R. and Beese, F., 2000. Nitrous oxide emissions from frozen soils under agricultural, fallow and forest land. Soil Biol. Biochem., 32, 1807–1810.
van der Salm, C. and de Vries, W., 2001. A review of the calculation procedure for critical acid loads for terrestrial ecosystems. Sci. Tot. Environ., 271, 11–25.
Werner, B., Henze, C.-H. and Nagel, H.-D., 1999. Critical loads für den Stickstoffeintrag, In: Ökologische Belastungsgrenzen
Critical loads & Levels, H.-D. Nagel and H.-D. Gregor (Eds.)
Springer, Berlin, 80–110.
Whitehead, P.G., 1990. Modelling nitrate from agriculture to public water supplies. Phil. Trans. Roy. Soc. London, B329, 403–410. Whitehead, P.G., Wilson, E.J. and Butterfield, D., 1998a. A semi-distributed Integrated Nitrogen model for multiple source assessment in Catchments (INCA): Part I - model structure and process equations. Sci. Tot. Environ., 210/211, 547-558. Whitehead, P.G., Wilson, E.J., Butterfield, D. and Seed, K., 1998b.
A semi-distributed integrated flow and nitrogen model for multiple source assessment in catchments (INCA): Part II -application to large river basins in south Wales and eastern England. Sci. Tot. Environ., 210/211, 559–583.
Wright R.F., Alewell C., Cullen J., Evans C., Marchetto A., Moldan, F., Prechtel, A. and Rogora.M., 2001. Trends in nitrogen deposition and leaching in acid-sensitive streams in Europe. Hydrol. Earth Syst. Sci., 5, 299–310.