HAL Id: hal-00303971
https://hal.archives-ouvertes.fr/hal-00303971
Submitted on 13 Feb 2008HAL is a multi-disciplinary open access
archive for the deposit and dissemination of sci-entific research documents, whether they are pub-lished or not. The documents may come from teaching and research institutions in France or abroad, or from public or private research centers.
L’archive ouverte pluridisciplinaire HAL, est destinée au dépôt et à la diffusion de documents scientifiques de niveau recherche, publiés ou non, émanant des établissements d’enseignement et de recherche français ou étrangers, des laboratoires publics ou privés.
Synergetic aerosol retrieval from SCIAMACHY and
AATSR onboard ENVISAT
T. Holzer-Popp, M. Schroedter-Homscheidt, H. Breitkreuz, D. Martynenko, L.
Klüser
To cite this version:
T. Holzer-Popp, M. Schroedter-Homscheidt, H. Breitkreuz, D. Martynenko, L. Klüser. Synergetic aerosol retrieval from SCIAMACHY and AATSR onboard ENVISAT. Atmospheric Chemistry and Physics Discussions, European Geosciences Union, 2008, 8 (1), pp.2903-2951. �hal-00303971�
ACPD
8, 2903–2951, 2008 SYNAER-ENVISAT T. Holzer-Popp et al. Title Page Abstract Introduction Conclusions References Tables Figures ◭ ◮ ◭ ◮ Back CloseFull Screen / Esc
Printer-friendly Version
Interactive Discussion Atmos. Chem. Phys. Discuss., 8, 2903–2951, 2008
www.atmos-chem-phys-discuss.net/8/2903/2008/ © Author(s) 2008. This work is distributed under the Creative Commons Attribution 3.0 License.
Atmospheric Chemistry and Physics Discussions
Synergetic aerosol retrieval from
SCIAMACHY and AATSR onboard
ENVISAT
T. Holzer-Popp1, M. Schroedter-Homscheidt1, H. Breitkreuz2, D. Martynenko1, and L. Kl ¨user1,3
1
German Aerospace Center (DLR), German Remote Sensing Data Center (DFD), Oberpfaffenhofen, Germany
2
Julius-Maximilians-University of W ¨urzburg, Department of Geography, W ¨urzburg, Germany
3
University of Augsburg, Institute of Physics, Augsburg, Germany
Received: 3 January 2008 – Accepted: 8 January 2008 – Published: 13 February 2008 Correspondence to: T. Holzer-Popp ([email protected])
ACPD
8, 2903–2951, 2008 SYNAER-ENVISAT T. Holzer-Popp et al. Title Page Abstract Introduction Conclusions References Tables Figures ◭ ◮ ◭ ◮ Back CloseFull Screen / Esc
Printer-friendly Version
Interactive Discussion
Abstract
The synergetic aerosol retrieval method SYNAER (Holzer-Popp et al., 2002a) has been extended to the use of ENVISAT measurements. It exploits the complementary infor-mation of a radiometer and a spectrometer onboard one satellite platform to extract aerosol optical depth (AOD) and speciation (as choice from a representative set of
5
pre-defined mixtures of water-soluble, soot, mineral dust, and sea salt components). SYNAER consists of two retrieval steps. In the first step the radiometer is used to do accurate cloud screening, and subsequently to quantify the aerosol optical depth (AOD) at 550 nm and spectral surface brightness through a dark field technique. In the second step the spectrometer is applied to choose the most plausible aerosol type through a
10
least square fit of the measured spectrum with simulated spectra using the AOD and surface brightness retrieved in the first step. This method was developed and a first case study evaluation against few (15) multi-spectral ground-based AERONET sun photometer observations was conducted with a sensor pair (ATSR-2 and GOME) on-board ERS-2. However, due to instrumental limitations the coverage of
SYNAER/ERS-15
2 and the AERONET network in 1997/98 is very sparse and thus only few coincidences with AERONET were found. Therefore, SYNAER was transferred to similar sensors AATSR and SCIAMACHY onboard ENVISAT. While transferring to the new sensor pair a thorough evaluation of the synergetic methodology and its information content has been conducted, which led to significant improvements in the methodology: an update
20
of the aerosol model, an improved cloud detection, and an enhanced dark field albedo characterization. This paper describes the information content analysis and these im-provements in detail and presents first results of applying the SYNAER methodology to AATSR and SCIAMACHY.
ACPD
8, 2903–2951, 2008 SYNAER-ENVISAT T. Holzer-Popp et al. Title Page Abstract Introduction Conclusions References Tables Figures ◭ ◮ ◭ ◮ Back CloseFull Screen / Esc
Printer-friendly Version
Interactive Discussion
1 Introduction
Air pollution by solid and liquid particles suspended in the air, so-called aerosols is one of the major concerns in many countries on the globe. One focus of concern is related to aerosols from anthropogenic origin mainly by combustion processes (industry, vehi-cle transport, heating, biomass burning). In developed countries improved combustion
5
and filtering methods have led to a general decrease of particle concentrations in total suspended matter but new concern arises from potential health impact of increasing numbers of smaller aerosols, so-called nano-particles in particular from diesel engines (Pope et al., 2002). Stedman (2004) reports that 21–38% of total excess deaths in the UK during the summer heatwave of 2003 are attributable to elevated ozone and
10
particle concentrations. On the other hand developing countries suffer still from high total particle loads in the air. Furthermore, natural aerosols (mainly dust and sea salt) also contribute significantly to background and episodically severely increased parti-cle concentrations. Dust can also act as carrier for long-range transport of diseases, e.g. from the Sahara to the Caribics or Western Europe (Pohl, 2003), or even once
15
around the globe (Prospero et al., 2002), as Chinese yellow sand was detected as far as the Swiss Alps. Also well known in principle are direct (by reflecting light back to space) and several indirect (e.g. by acting as cloud condensation nuclei) climate ef-fects of aerosols, although large uncertainties exist in the exact values of the forcing. Kaufman et al. (2002) point out that the absorption behaviour of particles (mainly soot
20
and minerals) needs to be known to assess their total direct and indirect climate effects (strongly absorbing particles can regionally reverse the sign of the aerosol direct forcing from cooling to heating or suppress cloud formation). Finally, the highly variable atmo-spheric aerosol load has a major impact on satellite observations of the Earth surface (thus requiring atmospheric correction of their blurring effect) and the solar irradiance
25
which is exploited in solar energy applications (aerosols are the determining factor in clear-sky conditions).
monitor-ACPD
8, 2903–2951, 2008 SYNAER-ENVISAT T. Holzer-Popp et al. Title Page Abstract Introduction Conclusions References Tables Figures ◭ ◮ ◭ ◮ Back CloseFull Screen / Esc
Printer-friendly Version
Interactive Discussion ing as well as short term forecast of pollution levels need to take into account
inter-continental transport processes and the composition of the atmospheric particle load. Satellite observations of the total aerosol mass have experienced significant improve-ments in the last few years thanks to improved instrumentation and enhanced retrieval algorithms. Thus they offer the potential to regularly monitor the global aerosol
dis-5
tribution and by assimilating these measurements into chemistry-transport-models to enhance particle forecasts especially for episodic severe pollution events, which are not covered by the underlying emission inventories. Furthermore, satellite data can contribute to deduce background and long-range transport patterns of aerosols. As SYNAER focuses on characterizing the aerosol type, the following summary of the
10
state of the art is restricted to recent developments which allow characterizing aerosol properties beyond aerosol optical depth. A good overview of different satellite retrieval principles to derive AOD is presented in Kaufman et al. (1997).
A comprehensive optical retrieval of the atmospheric aerosol load properties would comprise of spectral AOD (or AOD at 550 nm and the Angstrom coefficient) and
sin-15
gle scattering absorption plus phase function together with relative AOD fractions of various size classes and of non-spherical particles. On the micro-physical level the respective information would translate to the number or mass densities, spectral com-plex refractive indeces, size distributions and particle shapes of several components. As the atmospheric retrieval problem generally is an ill-posed problem with only few
20
observables, many if not most of these parameters need to be estimated. And thus the retrieval of additional aerosol properties beyond AOD is still in its infancy. Also the validation of such derived parameters is very complex due to lack of sufficient and appropriate data for inter-comparison.
A best fit between measured top-of-atmosphere and pre-calculated reflectances of
25
the dual view Advanced Along Track Scanning Radiometer (AATSR) near-infrared and visible bands provides the ˚Angstr ¨om coefficient and the dominant aerosol types that have been determined for a variety of aerosol mixtures (Veefkind et al., 1998). The aerosol types considered over Europe are marine and anthropogenic aerosols, which
ACPD
8, 2903–2951, 2008 SYNAER-ENVISAT T. Holzer-Popp et al. Title Page Abstract Introduction Conclusions References Tables Figures ◭ ◮ ◭ ◮ Back CloseFull Screen / Esc
Printer-friendly Version
Interactive Discussion are externally mixed. Comparisons of the retrieved ˚Angstr ¨om exponent against aircraft
sun-photometer measurements have shown good agreement (Veefkind et al., 1999). The Oxford RAL Aerosol and Cloud (ORAC) retrieval scheme (Marsh et al., 2004) has been applied to AATSR and Spinning Enhanced Visible and Infrared Imager (SE-VIRI) data. The approach uses assumed aerosol optical properties based on the
Op-5
tical Properties of Aerosols and Clouds database (OPAC, Hess et al., 1998). A fit to the observed top of atmosphere radiances is produced by varying the aerosol optical depth and effective radius, as well as the reflectance of the underlying surface.
The NASA-operated Multi-angle Imaging SpectroRadiometer (MISR) instrument on the Terra satellite provides a retrieval of one or more climatological aerosol models,
10
each of which is characterized as a mixture of up to three previously chosen pure particle types (Kahn et al., 2005). The climatological models are defined by total optical depth and the percentage optical depths of the pure particle classes.
The MODerate resolution Imaging Spectro-radiometer (MODIS) instrument aboard NASA’s Terra and Aqua satellites has been providing AOD data since the year 2000
15
for many applications in atmospheric, land-based and oceanic research. By summer 2007, a reprocessing campaign with improved versions of Level 1 science algorithms called Collection 5 (C005) has been completed for seven years of MODIS/Terra and five years of MODIS/Aqua data (Levy et al., 2007). A new parameter at MODIS collection 5 is the AOD attributed to small particles, “fine AOD”. It is calculated by multiplication
20
of the total AOD with the fractional contribution of fine (small sized) aerosol to the total AOD. As in the case of the ˚Angstr ¨om exponent, correlation with retrieved parameters against ground based measurements is still not satisfying, even after the algorithm changes of the collection 5 reprocessing. This little improvement is partly due to the fact that MODIS still derives too much fine-dominated aerosol over land (Remer et al.,
25
2006).
Another approach to improve MODIS collection 4 aerosol retrieval is the Deep Blue Algorithm, which adds the 412 nm channel to the channels at 470 and 670 nm to re-trieve AOD and single scattering albedo. Reprocessing of five years of MODIS aerosol
ACPD
8, 2903–2951, 2008 SYNAER-ENVISAT T. Holzer-Popp et al. Title Page Abstract Introduction Conclusions References Tables Figures ◭ ◮ ◭ ◮ Back CloseFull Screen / Esc
Printer-friendly Version
Interactive Discussion data of the Aqua platform with this algorithm has been completed simultaneously with
the MODIS collection 5 reprocessing effort. The Deep Blue approach is not very sensi-tive to the height of aerosol layers and can be applied for aerosol retrieval over different surfaces including bright desert areas (Hsu et al., 2004). Validation efforts for several sites and episodes have shown that level-2 AOD from the MODIS Deep Blue algorithm
5
is generally within 25% of AOD measured by the sites of the AERONET network. Com-parisons of retrieved ˚Angstr ¨om exponent values with those computed from the direct sun measurements also show that this approach is able to seperate small from coarse mode particles, even for very heterogenously mixed aerosol environments (Hsu et al., 2006).
10
A technique to derive the aerosol mass load and particle number concentration from nadir scanning multi-spectral radiometers, like Medium Resolution Imaging Spectrom-eter (MERIS), is described in Kokhanovsky et al. (2006). Information on surface re-flectivity is determined by a linear mixing model of spectra for vegetated and bare soil, following the Bremen Aerosol Retrieval (BAER) approach described by von
Hoyningen-15
Huene et al. (2003). AOD is then retrieved for several channels at less than 670 nm of the measured spectrum of top-of-atmosphere reflectance, using pre-calculated ra-diative transfer values with fixed aerosol phase functions and single scattering albedo either from aerosol models, given by OPAC (Hess et al., 1998) or from experimen-tal campaigns. This multispectral approach also allows for the determination of the
20
˚
Angstr ¨om exponent. A parameterization described in Kokhanovsky et al. (2006) is used to calculate effective particle radius and their columnar concentration from spec-tral AOD values, thus deriving information about ground particulate matter (PM10) from space-borne retrievals of AOD. Despite common problems with ground truthing due to the mismatch of point surface observations against space-averaging satellite retrievals,
25
the aerosol characteristics derived within a case study are within reasonable values for atmospheric aerosol characteristics (Kokhanovsky et al., 2006).
The third POLDER (POLarization and Directionality of the Earth Reflectance) in-strument onboard the PARASOL (Polarization & Anisotropy of Reflectances for
Atmo-ACPD
8, 2903–2951, 2008 SYNAER-ENVISAT T. Holzer-Popp et al. Title Page Abstract Introduction Conclusions References Tables Figures ◭ ◮ ◭ ◮ Back CloseFull Screen / Esc
Printer-friendly Version
Interactive Discussion spheric Sciences coupled with Observations from a Lidar) platform matches aerosol
polarization measurements against pre-calculated radiative transfer values for a set of aerosol models, leading to AOD values at various wavelengths as well as the ˚Angstr ¨om exponent (Deuz ´e et al., 2001). PARASOL retrieval over land is mainly sensitive to small particles such as the aerosols created by anthropogenic pollution or biomass burning.
5
Larger aerosol particles, like desert dust, do not polarize sunlight and therefore can not be retrieved quantitatively. This means that only the fine fraction contribution and not the total AOD can be derived. Valdiation studies over northeastern China have shown that there is a good general agreement between the AERONET fine-mode AOD and the PARASOL level 2 AOD, whereas the ˚Angstr ¨om exponent seems to be overestimated
10
(Fan et al., 2008).
Due to the differences in cloud screening and spatial-temporal sampling as well as the different underlying aerosol models the various aerosol datasets exhibit significant differences (e.g. Myhre et al., 2005). The next logical step in aerosol retrieval relies on exploiting synergies of different instruments to advance on the retrieval of a
multi-15
parameter description of the atmospheric aerosol loading. This is the general aim of the NASA/CNES A-train aerosol satellite constellation consisting of MODIS, MISR, OMI, CALIPSO, PARASOL, each of which independently retrieves different aerosol proper-ties. Another approach in this direction is the SYNAER (SYNergetic AErosol Retrieval) method which was developed to exploit a combination of a radiometer (ATSR-2, Along
20
Track Scanning Radiometer 2) and a spectrometer (GOME, Global Ozone Monitoring Experiment) onboard one platform (ERS-2, European Remote Sensing Satellite 2) to provide one multi-spectral retrieval ranging from deep blue to red bands with two dif-ferent scales (Holzer-Popp et al., 2002a). A first case study validation and retrieval of 15 coincidences of these ERS-2 data with AERONET observations showed an AOD
25
accuracy of 0.1 at 3 visible wavelengths (Holzer-Popp et al., 2002b).
After this introduction, Sect. 2 gives an overview on the SYNAER principles and sen-sors (Sect. 2.1) and analyses its information content with regard to the aerosol type including realistic noise in the retrieval (Sect. 2.2). The paper describes then the three
ACPD
8, 2903–2951, 2008 SYNAER-ENVISAT T. Holzer-Popp et al. Title Page Abstract Introduction Conclusions References Tables Figures ◭ ◮ ◭ ◮ Back CloseFull Screen / Esc
Printer-friendly Version
Interactive Discussion major advances of the new SYNAER methodology version 2.0 during the transfer to
ENVISAT in Sect. 3. Section 3.1 deals with an extension of the aerosol component database to include higher values of the single scattering albedo for soot and min-eral dust based on more recent ground-based observations; Sect. 3.2 presents two additions to the cloud screening which make sure that desert dust outbreaks over
sub-5
tropical ocean are not masked out as clouds and that convective warm-top clouds are not missed. An improved dark field method, which takes into account the dependence of the correlation between the mid-infrared and visible channel on vegetation amount is described in Sect. 3.3. Including all these changes validation of SYNAER results at 440, 550 and 670 nm for 39 orbits of summer 2005 against AERONET
measure-10
ments and a first 4-month dataset derived with the SYNAER method from ENVISAT sensors AATSR and SCIAMACHY are presented in Sect. 4. The paper concludes with a discussion and outlook in Sect. 5.
2 The retrieval method and its information content
2.1 Overview of the SYNAER principles and sensors
15
The synergetic aerosol retrieval method SYNAER delivers aerosol optical depth (AOD) and an estimation of the type of aerosols in the lower troposphere over both land and ocean. In retrieving AOD the free tropospheric (AOD=0.03 free tropospheric above the boundary layer and a possible additional dust layer) and stratospheric (AOD=0.01 stratospheric background; valid since 1995 up to now) aerosol loading are kept
con-20
stant at background conditions, whereas the boundary layer aerosol load and type and a possible dust layer are varied. The type of aerosol is estimated as percentage contribution of representative components from an extension of the OPAC (Optical Pa-rameters of Aerosols and Clouds, Heß et al., 1998) dataset to AOD in the boundary layer. The high spatial resolution of the radiometer instrument permits accurate cloud
25
ACPD
8, 2903–2951, 2008 SYNAER-ENVISAT T. Holzer-Popp et al. Title Page Abstract Introduction Conclusions References Tables Figures ◭ ◮ ◭ ◮ Back CloseFull Screen / Esc
Printer-friendly Version
Interactive Discussion tests (Kriebel et al., 1989, 2003). The SYNAER aerosol retrieval algorithm comprises
then of two major parts: A dark field method exploiting single wavelength radiometer reflectances (670 nm over land, 870 nm over ocean) and a least square fit of visible top-of atmosphere reflectance spectra at 10 wavelengths (415, 428, 460, 485, 500, 516, 523, 554, 615, and 675 nm) with the spectrometer. AOD calculation over
auto-5
matically selected and characterized dark pixels and surface albedo correction at 550, 670, and 870 nm for a set of 40 different pre-defined boundary layer aerosol mixtures is done with the radiometer. After spatial integration to the larger pixels of the spec-trometer these parameters are used to simulate spectra for the same set of 40 different aerosol mixtures with the same radiative transfer code. A least square fit of these
cal-10
culated spectra to the measured spectrum delivers the correct AOD value and – if a uniqueness test is passed – the plausible aerosol mixture. The entire method uses the same aerosol model of basic aerosol components, each of them representing optically similar aerosol species. These basic components are externally mixed into 40 different aerosol types meant to cover a realistic range of atmospheric aerosol masses. For
15
humidity dependent components two models with 50% and 80% relative humidity have been included. In the case of desert dust outbreaks, an elevated dust layer is added in the free troposphere. Also the underlying radiative transfer code is consistently used throughout all retrieval steps.
For clearer reference we name the original SYNAER version 1.0. However, the very
20
weak sampling of these two sensors provided serious limitations for a systematic val-idation and application. This method has therefore now been transferred to a new sensor combination onboard ENVISAT together with a thorough assessment and im-provement of individual retrieval steps with a significantly larger dataset.
SYNAER/ENVISAT exploits the combination of the radiometer AATSR and the
spec-25
trometer SCIAMACHY. The Advanced Along Track Scanning Radiometer (AATSR) and the Scanning Imaging Absorption Spectrometer for Atmospheric Cartography (SCIA-MACHY) have been active onboard the European Environmental Satellite ENVISAT since March 2002 and simultaneously observe the same area on the globe. AATSR
ACPD
8, 2903–2951, 2008 SYNAER-ENVISAT T. Holzer-Popp et al. Title Page Abstract Introduction Conclusions References Tables Figures ◭ ◮ ◭ ◮ Back CloseFull Screen / Esc
Printer-friendly Version
Interactive Discussion measures earth reflected radiances in 5 spectral bands centered at 0.55, 0.67, 0.87,
1.6, 3.7µm (with some additional thermal signal at 3.7 µm) with bandwidths of 25 to
66 nm and brightness temperatures in 2 thermal channels at 11 and 12µm. All
ob-servations are taken under two viewing angels (nadir and 52◦ forward) with a ground resolution of approximately 1.1 km2at nadir. The main target of AATSR is the
observa-5
tion of sea surface temperature with high accuracy. SCIAMACHY observes near-nadir and limb reflection from the Earth in the range from 240 to 790 nm with a spectral res-olution of 0.2 nm to 0.4 nm and in selected bands between 800 and 2400 nm with a resolution of few nm and a pixel size of either 60×30 km2 in nadir view. Its principal goal is the monitoring of stratospheric ozone but further stratospheric and tropospheric
10
trace gases can be also measured. Because both instruments measure the solar il-lumination regularly, earth reflectances can be calculated with significantly reduced calibration errors as compared to the use of calibrated radiances. In the latest cali-bration version the cross-correlation of spectrally and spatially integrated reflectances measured by both instruments (and against another radiometer MERIS onboard
EN-15
VISAT) was found to satisfy high accuracy requirements with deviations on the order of 1%. To assure consistent retrieval (also for the earlier SCIAMACHY product ver-sion 5.4 with significantly larger absolute calibration errors) the SCIAMACHY absolute reflectance values are corrected against the coincident AATSR values for each pixel. In this paper no use is made of dark fields which are selected with the 3.8µm chan-20
nel (as in version 1.0) as their inclusion provides no additional coverage whereas their albedo estimation seems more inaccurate due to the thermal signal contribution. Also the variance test of version 1.0 for each entire 512×512 km2frame, which was needed for the ERS-2 data due to the small GOME pixel number, has no longer been applied. Finally, the different retrieval scheme over ocean, which has some impact on coastal
25
zone validation stations, has not been further investigated in this paper. All other parts of the methodology as described in Holzer-Popp et al. (2002a) are not changed and therefore not described here in further detail.
ACPD
8, 2903–2951, 2008 SYNAER-ENVISAT T. Holzer-Popp et al. Title Page Abstract Introduction Conclusions References Tables Figures ◭ ◮ ◭ ◮ Back CloseFull Screen / Esc
Printer-friendly Version
Interactive Discussion 2.2 Analysis of the information content for aerosol types
In this section the information content with regard to aerosol composition is considered. Therefore the focus of analysis is on the second retrieval step exploiting the spectrome-ter measurements and using the results of the first retrieval step, namely aerosol optical depth at 550 nm and surface reflectance at 550, 670 and 870 nm for each aerosol
mix-5
ture. In the analysis of the information content 7 basic components (water soluble, water insoluble, sea salt accumulation and coarse mode, anthropogenic soot, biogenic soot and mineral transported) were used to define the set of 40 mixtures, which was then been applied to radiative transfer calculations of simulated SCIAMACHY spectra using the same radiative transfer code.
10
Information theory or communication theory is concerned with what is known as the information content of a measurement, which is the amount of useful information con-tained within a measurement. Information theory was first used by electrical engineers to design better telecommunications systems, but now has a wide variety of applica-tions. In particular, concepts from information theory have been applied to satellite
15
retrieval studies (e.g. Rodgers, 2000). In satellite retrieval studies, it is useful to obtain a single number as a quantitative measure of the information content.
It is important to understand the information content of remotely sensed observations and therefore, how different observations contribute to a retrieval algorithm. By observ-ing reflectances at different wavelengths (channels), the size and quality of
measure-20
ments can be improved. However, there is a point where adding further observations has a negligible effect. Further, with the vast increase in satellite data, it is not possible to include all available observations in retrievals. Therefore, it is necessary to select an optimal subset of the observations such that the important information is retained. In the case of satellite retrievals, there is a complicated relationship between observed
25
and retrieved variables. The information content determines how many linearly inde-pendent pieces of information are contained in a set of observations. This not only depends on the observations, but on the algorithm in which they are used, for example
ACPD
8, 2903–2951, 2008 SYNAER-ENVISAT T. Holzer-Popp et al. Title Page Abstract Introduction Conclusions References Tables Figures ◭ ◮ ◭ ◮ Back CloseFull Screen / Esc
Printer-friendly Version
Interactive Discussion on the radiative transfer model and on the errors in the observations.
One of the methods used to examine information content is the singular value de-composition (SVD). SVD is a useful tool to identify the dominant or important part of the observation. This allows then to identify the variables which can be determined from the observations. For any remote measurement, the measured quantity, y, is
5
some vector-valued function F of the unknown state vector x, and of some other set of parameters b excluded from the state vector, considering also the experimental error termε:
y = F (x, b) + ε (1)
where y∈Rm is the measurements vector of dimension m, x∈Rn is the state vector of
10
dimension n, b is the vector containing all the other parameters necessary to define the radiative transfer from the atmosphere to the spacecraft, F:Rn→Rm is the forward model that describes the physics of the measurements that map from the state space to the measurements space andε∈Rm is the measurement error vector.
The measurement vector for SYNAER retrieval consists of simulated spectra for 40
15
different aerosol mixtures for one surface type. The state vector consists of 40 ele-ments corresponding to the different aerosol mixtures and 12 eleele-ments corresponding to predefined SYNAER surface types. For the purpose of information content, error analysis and inversion procedure it is necessary to linearize the forward model around a reference state x0:
20
y − F (x0) = ∂F
∂x(x − x0) + ε = K · (x − x0) + ε (2)
where K is the weighting function matrix of dimension m×n. Each element of K is the partial derivative of a forward model element with respect to a state vector element:
kij = ∂F (x)i
ACPD
8, 2903–2951, 2008 SYNAER-ENVISAT T. Holzer-Popp et al. Title Page Abstract Introduction Conclusions References Tables Figures ◭ ◮ ◭ ◮ Back CloseFull Screen / Esc
Printer-friendly Version
Interactive Discussion As described before, the act of measurement maps the state space into the
measure-ment space according to the Forward Model. Conversely, a given measuremeasure-ment could be the result of a mapping from anywhere in the state space. For this reason it is nec-essary to have some prior information about the state, which can be used to constrain the solution.
5
The information content is condensed into the Degrees of Freedom for Signal (DFS). DFS can be interpreted as the number of independent linear combinations of the state vector that can be independently retrieved from the measurements. It is given by:
DFS =X λ
2
i
1 + λ2i (4)
whereλi are the singular values of K′=(Sε)
−1/2
K (Sa)1/. Sε and Sa correspond to
10
measurement covariance and a priory covariance matrices. The measurement covari-ance matrix Sε has a diagonal form, with diagonal elementσε2=1e10−6 (relative error
is about 1% of reflectance spectrum values around 0.1 from vector y). The a-priory covariance matrix Sa has a block diagonal form, because there is no correlation in retrieval of surface type and retrieval of aerosol type. The first non-diagonal part of
15
Sa is the explicitly calculated covariance between percent contributions for 40 aerosol mixtures from Table 2. The second part of the block diagonal matrix Sa (albedo part) is diagonal, since there is no correlation between different channels for the pre-defined 12 SYNAER albedo spectra. The diagonal values for all albedo surfaces, except for the “snow” case, are equal to 1e-4 (σA=0.01). For the much brighter “snow” type σA2
=1.6e-20
3 is chosen (σA=0.04). These values are taken in correspondence with the albedo
values for the different surface types.
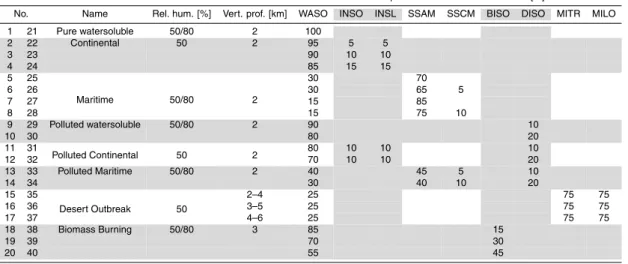
DFS as a function of AOD is shown in Fig. 1. With growing AOD, the growth of the DFS values is relative fast. This means that the SYNAER aerosol type retrieval shows meaningful results also for small values of AOD. Already at AOD=0.2 the curve
25
in Fig. 1 approaches the saturation at about DSF=4. The offset value of the DFS of 2 at AOD=0 (i.e. no aerosol content and thus no aerosol signal) is supposed to correspond
ACPD
8, 2903–2951, 2008 SYNAER-ENVISAT T. Holzer-Popp et al. Title Page Abstract Introduction Conclusions References Tables Figures ◭ ◮ ◭ ◮ Back CloseFull Screen / Esc
Printer-friendly Version
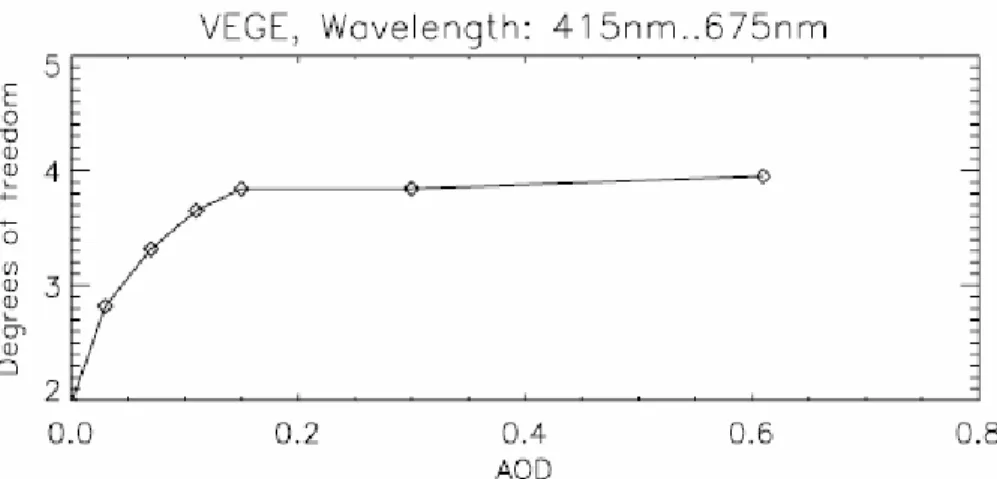
Interactive Discussion to the surface brightness and AOD (which are provided from the first SYNAER step).
DFS also depend on other parameters as sun elevation angle and surface type. Fig-ure 2 describes the combined DFS dependence on sun elevation angle and AOD. The non-monotone growth of DFS regarding to sun elevation angle is supposed to be due to the combination of the various phase functions of the basic aerosol components.
5
The results of the SYNAER retrieval are obviously also dependant on the surface type over which the retrieval was made (Fig. 3). An analysis was made for six different sur-face types: “vegetation”, “snow”, “forest”, “water”, “soil” and, as a special case, for “no albedo” type, which corresponds to a numerical model of absolutely black surface. Ob-voiusly, the retrieval doesn’t work properly over bright surfaces, such as snow or desert
10
(DFS approximately 2; i.e. no additional information content for the aerosol type). The maximum values of DFS are over vegetation and water pixels, which corresponds well with the choice of surface type for the dark filed method. But also for sparsely veg-etated surfaces (see the soil example) the information content for the aerosol type is weaker but not negligible.
15
In summary this analysis shows that DFS (after eliminating the offset of 2 due to surface brightness and AOD) exhibits a variation from 0.5 to 2.5 DFS. These val-ues correspond only to the determination of the aerosol type. It is thus theoretically proven that SYNAER can determine more than 2 independent aerosol properties in addition to AOD and surface brightness. Also this analysis provides a deeper insight
20
into favourable conditions and limitations of the aerosol type retrieval with SYNAER (surface, sun elevation, AOD).
3 Improvements of the SYNAER retrieval algorithm
3.1 Extension of the aerosol model
As described in Holzer-Popp et al. (2002a) basic aerosol components, their optical
25
ACPD
8, 2903–2951, 2008 SYNAER-ENVISAT T. Holzer-Popp et al. Title Page Abstract Introduction Conclusions References Tables Figures ◭ ◮ ◭ ◮ Back CloseFull Screen / Esc
Printer-friendly Version
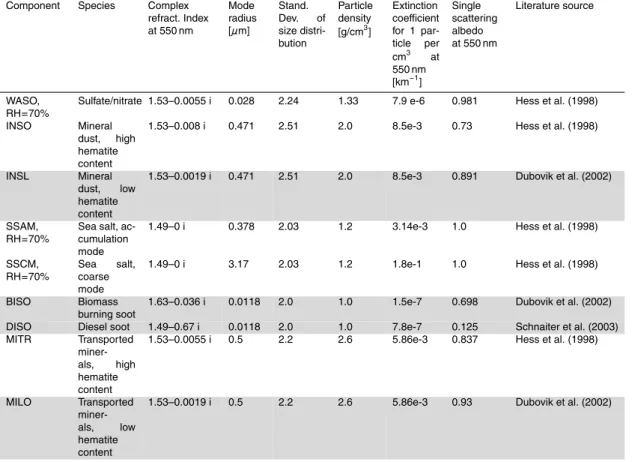
Interactive Discussion et al., 1998). Table 1 summarizes their relevant microphysical properties and optical
characteristics derived from Mie calculations. However, on the basis of more recent campaigns and AERONET data exploitations some specific items have been updated against version 1.0.
The original soot component was split into two components for strongly
absorb-5
ing diesel soot (DISO) more representative for industrial areas and weakly absorbing biomass burning soot (BISO). The optical properties of strongly absorbing diesel soot were taken from Schnaiter et al. (2003), while optical properties for soot from biomass burning cases as e.g. in Amazonian, South American cerrado, African savannah and boreal regions were adopted from Dubovik et al. (2002). As size distributions
mea-10
sured in Schnaiter et al. (2003) were similar to the OPAC database, the size distribution described in the OPAC database are used also for the DISO and BISO components replacing now the original OPAC SOOT component.
For mineral dust a new, additional component (MILO, mineral dust with low ab-sorption) was introduced in order to take dust sources with lower hematite content
15
into account. Moulin et al. (2001) discuss that earlier measurements (Patterson et al., 1997, used e.g. in OPAC) were conducted in regions with a large hematite con-tent. As hematite is a strongly absorbing material, already small amounts can change the optical properties of atmospheric dust significantly. Recent measurements as e.g. Schnaiter et al. (2003), Moulin et al. (2001), and Sinyuk et al. (2003) in Bahrain, Cape
20
Verde, Sahara and Saudi Arabia as regions with low hematite content show a reduced imaginary part of the refractive index between 0.001 and 0.002 compared to the OPAC value of 0.0055. Larger hematite concentrations can be found only in restricted ar-eas as the Sahel area, Northern India and East Australia (Claquin et al., 1999). Also, measurements from the GOES-8 satellite optimally reproduce ground measurements
25
of mineral dust concentrations if an imaginery part of 0.0015 is assumed (Wang et al., 2003).
As the insoluble component in OPAC (INSO) is modelled with the identical refractive index as the mineral transported component MITR, also an insoluble component with
ACPD
8, 2903–2951, 2008 SYNAER-ENVISAT T. Holzer-Popp et al. Title Page Abstract Introduction Conclusions References Tables Figures ◭ ◮ ◭ ◮ Back CloseFull Screen / Esc
Printer-friendly Version
Interactive Discussion low absorption (INSL) was introduced. Both, MILO and INSL have the same size
distri-butions as the OPAC components MITR and INSO, respectively. In the case of a desert dust outbreak of transported minerals, the lowest aerosol layer of 4–6 km is modeled as two distinct sub-layers representing a dust layer above background aerosols, as they occur in nature.
5
Table 2 shows the updated definition of the 40 mixtures used in the SYNAER retrieval method. The set of 40 mixtures is meant to model all principally existing aerosol types and allow for some variability in the composition of each type. This set of mixtures has proven to provide a fit in the GOME spectra retrieval which is in many cases at a 1% noise level. Values in the table show the vertical profile, relative humidity in the
10
boundary layer and the percentage contribution to the optical depth at 550 nm of the respective components. Two groups of 20 mixtures, each are applied where either relative humidity or the absorption of the mineral component are altered. Alternative values are marked with grey boxes: For example, mixture number 1 has 50% relative humidity and mixture number 21 has 80% relative humidity; mixture number 2 has a
15
5% insoluble (large absorption) component, whereas mixture number 22 has a 5% insoluble (low absorption) contribution to the optical thickness at 550 nm.
3.2 Improved cloud screening
Cloud Screening in SYNAER is achieved through an adaption of the Advanced Very High Resolution Radiometer (AVHRR) Processing scheme Over cLouds, Land and
20
Ocean (APOLLO), described in Saunders and Kriebel (1988), Kriebel et al. (1989, 2003) to AATSR. Unfortunately, this cloud screening scheme adaption to AATSR has two shortcomings, which have to be accounted for in order to derive an accurate cloud mask for aerosol retrievals.
First, heavy aerosol load over oceans (mainly mineral dust, to minor parts smoke
25
plumes from wildfires) is classified as “cloudy” by APOLLO and these AATSR pixels are then not used for the retrieval of AOD in SYNAER, leading to somewhat too small AOD values in the dust belts. The second shortcoming is an improper detection of
ACPD
8, 2903–2951, 2008 SYNAER-ENVISAT T. Holzer-Popp et al. Title Page Abstract Introduction Conclusions References Tables Figures ◭ ◮ ◭ ◮ Back CloseFull Screen / Esc
Printer-friendly Version
Interactive Discussion shallow cumulus cloud cover over land due to a simple temperature threshold test for
the rejection of cloudy pixels in order to not classify desert surfaces as low clouds. Thus, in some obviously cloudy AATSR scenes no clouds are detected, and those much too bright pixels are used for the AOD derivation, leading to biased AOD over land. Both these shortcomings of the APOLLO cloud detection scheme essentially
5
require corrections to the cloud screening procedure, which are described below. 3.2.1 Mineral dust over ocean
APOLLO was developed to detect clouds from AVHRR data (Saunders and Kriebel, 1988) and not for remote sensing of atmospheric aerosols. Thus, in cases of heavy aerosol loads from North Africa getting transported across the Atlantic Ocean, the
10
dust plumes are misclassified as “cloudy” by APOLLO due to their high shortwave-reflectance. With these heavy aerosol loads not being included in the SYNAER analy-sis, the resulting AOD in the dust plume area is surely underestimated. This exclusion of heavy dust plumes from the SYNAER process can be accounted for as follows.
Heavy dust plumes in the Atlantic region are usually embedded in an air layer
of-15
ten called Saharan Air Layer (SAL), which is described in detail e.g. by Wong and Dessler (2005). The main characteristic properties of this SAL are being warm, dry and well mixed. Thus 11µm brightness temperatures of dust-loaden pixels are well
above 273 K. So this brightness temperature value is chosen as a first threshold, which prevents cool mixed-phase or ice clouds from being taken into account for the further
20
analysis, together with scenes in the polar regions. This condition can also be met by thin cirrus or semi-transparent clouds, so another criterion for the following dust dis-crimination scheme is the cloud type “low cloud” determined by the original APOLLO tests.
Dunion and Velden (2004) use images of the Geostationary Operational
Environ-25
mental Satellites (GOES) to track the SAL across the Atlantic Ocean. They discriminate the “SAL-strength” by means of the brightness temperature difference (BTD) between 11µm and 12 µm, arguing that non-SAL BTD values are well above +5K. The
SAL-ACPD
8, 2903–2951, 2008 SYNAER-ENVISAT T. Holzer-Popp et al. Title Page Abstract Introduction Conclusions References Tables Figures ◭ ◮ ◭ ◮ Back CloseFull Screen / Esc
Printer-friendly Version
Interactive Discussion strength analysed by Dunion and Velden (2004) does not directly represent the aerosol
load or optical depth and also is sensitive to cloud screening.
The BTD alone does not seem to be an appropriate measure to discriminate miss-classified clouds (not shown), but it is a good method to select AATSR pixels which have to undergo further inspection. In this APOLLO improvement scheme a slightly
5
more conservative BTD threshold of +2 K is used, because heavy aerosol plumes can be shown to inhibit values well below this threshold (and low aerosol loads seem not to be miss-classified by APOLLO). Evan at al. (2006) use different BTD thresholds in different stadiums of their dust detection algorithm with the minimal threshold being −0.5 K and the maximum BTD value, for which dust classification remains possible,
10
being +3.5 K. For the purpose of saving computing time a single BTD threshold of +2 K has been chosen here for the initial test.
Furthermore two reflectance thresholds are applied to pre-select possible dusty misclassified pixels: they have to inhibit 1.6µm reflectance below 0.2 and 0.6 µm
reflectance below 0.3. Brighter pixels classified as cloudy by APOLLO remain
un-15
changed.
Thus the pre-selection scheme of possible miss-classified pixels consists of the fol-lowing tests:
T11µm>273 K ∧ R1.6 µm<0.2 ∧ R0.6 µm<0.3 ∧ T11µm−T12µm≤2 K (5) Pixels classified as low-cloud covered by APOLLO, for which these tests apply, can
20
still be cloud contaminated or aerosol loaden. The discrimination between clouds and mineral dust can be achieved by means of the ratio of reflectance at 1.6µm and 0.6 µm
due to the higher reflectance of water clouds at 1.6µm compared to mineral dust.
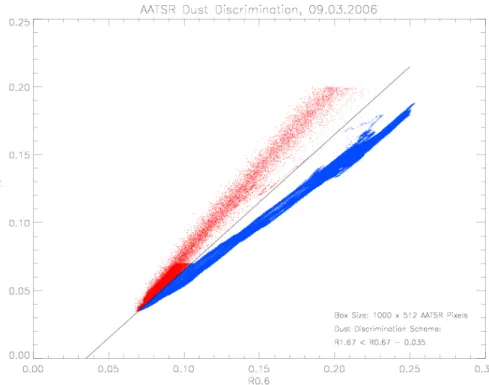
Figure 4 shows AATSR reflectance values at 1.6µm and 0.6 µm for a desert dust
outbreak scene from 9 March 2006 off the western coast of North Africa. The analysis
25
includes a box area of 1000×512 AATSR pixels. For 0.6µm reflectance greater than
about 0.1 one can clearly distinguish two different regimes in the scatter-plot. The lower branch, coloured blue in the figure, represents pixels which can be identified as
ACPD
8, 2903–2951, 2008 SYNAER-ENVISAT T. Holzer-Popp et al. Title Page Abstract Introduction Conclusions References Tables Figures ◭ ◮ ◭ ◮ Back CloseFull Screen / Esc
Printer-friendly Version
Interactive Discussion dust loaden by visual inspection (not shown). The upper branch, coloured red, can be
identified as definitely cloud covered in RGB images of the scene.
The discrimination between both branches does not exactly follow the reflectance ratio of 1. Dust discrimination requires the condition
R1.6 µm+ 0.035
R0.6 µm
< 1 (6)
5
to be met. The additional constant, being 0.035 for AATSR, originates from a best fit test and can be shown to differ slightly for other sensors than AATSR (e.g. it is 0.03 for SEVIRI onboard the MSG satellite).
Furthermore, Fig. 4 shows that discrimination between dust and cloud by means of the reflectance ratio is not possible for 0.6µm reflectance below about 0.1, values 10
corresponding to moderate to low dust load or thin low level clouds.
For pixels, which meet the conditions listed in Eq. (5) and inhibit 0.6µm reflectance
below 0.1, an even more conservative BTD threshold of 0 K is applied to discriminate misclassified pixels, as described in Huang et al. (2006) and also in Evan et al. (2006), while the reflectance ratio test is not applied for those pixels.
15
3.2.2 Shallow convection over land
Adapted to AATSR data, the APOLLO cloud detection scheme shows significant short-comings in the detection of fields of shallow convective clouds over land, which can easily be classified as being “cloudy” by visual inspection of RGB images. This miss-classification of obviously cloudy pixels leads to a retrieval of high AOD for those
20
AATSR pixels, resulting in a biased SYNAER AOD over land.
The original adaption of APOLLO to AATSR data includes a temperature thresh-old test scheme for the exclusion of very bright desert surfaces from cloud detection. In this scheme, cloudy pixels having 11µm brightness temperatures above a
scene-dependent threshold between 285 K and 305 K are rejected (from cloud detection)
25
ACPD
8, 2903–2951, 2008 SYNAER-ENVISAT T. Holzer-Popp et al. Title Page Abstract Introduction Conclusions References Tables Figures ◭ ◮ ◭ ◮ Back CloseFull Screen / Esc
Printer-friendly Version
Interactive Discussion scheme to determine whether a pixel is cloudy or shows bright desert surface. Without
this test, APOLLO classifies many desert areas as “cloudy” due to their high shortwave reflectance. On the other hand, inclusion of this test rejects pixels, which obviously show low level convective cloud fields with warm cloud top temperatures somewhere in the temperature range of the thresholds. This makes necessary the application of
5
another test over land, which accounts for these cloud fields and flags them “cloudy”. Only pixels classified as “cloud-free” by APOLLO after the temperature rejection tests within the APOLLO scheme are regarded for the additional tests described below. Fur-thermore the pixels have to inhibit 11µm brightness temperatures in the range 285 K–
305 K, which covers the range of possible thresholds for the temperature rejection test.
10
Pixels having 11µm brightness temperatures above the highest possible threshold
value of 305 K remain flagged cloud-free, following the original APOLLO strategy for desert surfaces.
As a second test, the ratio of reflectance at 1.6µm and 0.8 µm has to be above
0.65 and below 1.0. This somewhat arbitrary threshold accounts for the near-equality
15
of those reflectances for dense water clouds and desert surfaces often showing re-flectance ratios well above 1.0 (not shown).
As the described conditions alone are not enough to distinguish between desert surface and low cloud fields, pixels meeting the above conditions are re-classified as “cloudy”, if either the conditions
20
R0.8 µm > 0.25 ∧ R0.6 µm> 0.25 ∧ T11µm−T12µm≥1.25 K (7)
are met or if
R0.8 µm > 0.4 ∧ R0.6 µm > 0.4 ∧ −0.5 < T11µm−T12µm< 1.25 K (8) is true.
The threshold of 0.4 for 0.6µm and 0.8 µm reflectance is adapted from Rosenfeld 25
and Lensky (1998) for pixels with BTD lower than 1.25. This BTD test split value of 1.25 K results from the APOLLO algorithm. So, for BTD values greater than 1.25 a
ACPD
8, 2903–2951, 2008 SYNAER-ENVISAT T. Holzer-Popp et al. Title Page Abstract Introduction Conclusions References Tables Figures ◭ ◮ ◭ ◮ Back CloseFull Screen / Esc
Printer-friendly Version
Interactive Discussion slightly lower reflectance threshold of 0.25 can be chosen, which follows the cloud
de-tection method of Kaufman and Fraser (1997). Actually, those authors use a threshold 0.2 for 0.6µm reflectance, combined with a difference in brightness temperatures be-tween 3.7µm and 11 µm of greater than +8 K. A slightly higher threshold has been
chosen here because in opposition to Kaufman and Fraser (1997) pixels having 11µm 5
brightness temperatures warmer than 290 K are also included and no brightness tem-perature difference between 3.7 µm and 11 µm is used. Only the combination of both additional tests enables proper discrimination between rejected desert surfaces and low cloud fields within the APOLLO cloud detection scheme.
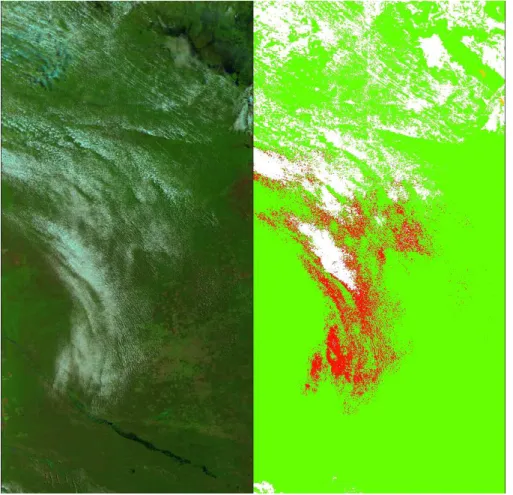
Figure 5 shows an AATSR scene with a large number of obviously misclassified
10
cloudy pixels. The left hand side of the image shows an RGB composite image, in which the low-level cloud field easily can be detected. On the right hand side the APOLLO cloud mask is shown. Green pixels show cloud free land and white pixels show clouds detected by the original APOLLO scheme. A clear disagreement between the cloud detection and the clouds seen in the composite occurs. The red pixels show
15
pixels classified as cloud-covered by the improved APOLLO scheme, while not by the original one. A great improvement of cloud detection is obvious and clearly shows its necessity.
The improved APOLLO cloud classification, extended by the tests described above, has been tested by visual inspection with 39 different AATSR orbits of the years 2006
20
and 2007 during all seasons with many scenes including low level convection and heavy dust plumes. These tests show clear improvements of the APOLLO cloud screening for SYNAER, which should clearly lead to a reduced bias in AOD both over land and over ocean.
It has to be noted, that there can still be some very warm or moderaterly bright low
25
level clouds which go on undetected by the APOLLO screening procedure. On the other hand also slightly more desert pixels, showing no clear evidence of being cloudy, are flagged cloud covered with the improved scheme, leading to slightly too high mean cloud cover in desert regions. But compared to the benefits of additional detection
ACPD
8, 2903–2951, 2008 SYNAER-ENVISAT T. Holzer-Popp et al. Title Page Abstract Introduction Conclusions References Tables Figures ◭ ◮ ◭ ◮ Back CloseFull Screen / Esc
Printer-friendly Version
Interactive Discussion of low level clouds these miss-classification of potentially cloud free desert pixels can
surely be accepted in the case of SYNAER. 3.3 Improved dark field method
As a thumb rule one can recall that in order to retrieve AOD with an accuracy of 0.1 the surface albedo of the treated dark field should be known with an accuracy of 0.01 (see
5
e.g. Holzer-Popp et al., 2002a). To achieve this accuracy in an automatic retrieval pro-cedure over land for AATSR (over ocean a different scheme is used, which is described in Holzer-Popp et al., 2002a), dark fields are selected from a combination of thresholds for the normalized vegetation index NDVI and the reflectanceR1.6 in the mid-infrared
at 1670 nm. Best values set in the retrieval are now NDVI>0.5 and R1.6<0.23. For 10
these dark field pixels the surface reflectance over land at 670 nm is then estimated by a linear regression with the reflectance at 1.6µm (since this mid-infrared reflectance is
almost not affected by aerosols, except for large desert dust outbreaks). Similar to the latest update of the MODIS retrieval algorithm collection 5 (regression between 2.2µm
and 670/490 nm becomes vegetation dependant in collection 5; Levy et al., 2007) this
15
regression showed to depend on the vegetation amount. Figure 6 shows the regres-sion of surface reflectance at 670 nm versus top of atmosphere reflectance at 1.6µm
for interwalls of 0.05 in NDVI. For this plot 2474 dark fields were analysed, where an AERONET sun photometer measurement was available within 60 min and 50 km from the respective AATSR pixel, where the AOD at 550 nm was below 0.1 and where the
20
scattering angle was between 140◦ and 160◦. The surface reflectance was derived by atmospheric correction with the SYNAER radiative transfer algorithm and the respec-tive AERONET AOD value. This analysis leads then to the following regression function between top of atmosphere reflectancesR1.6 at 1.6µm and surface reflectances R670 at 670 nm:
25
ACPD
8, 2903–2951, 2008 SYNAER-ENVISAT T. Holzer-Popp et al. Title Page Abstract Introduction Conclusions References Tables Figures ◭ ◮ ◭ ◮ Back CloseFull Screen / Esc
Printer-friendly Version Interactive Discussion with a = −1.5 · NDVI + 1.5 b = 0.1 · NDVI − 0.1 c = 0.1 · (cos ψ − cos 150◦ ), forψ < 150◦
whereψ is the scattering angle. The third term is not shown in Fig. 6 as the few extreme 5
values of the scattering angle were not included into this analysis, but it was found necessary to improve the AOD retrieval for a small number of cases with scattering angles close to 120◦. Finally, dark fields where the estimated surface reflectance at 670 nm exceeds 0.085 are not used in the retrieval.
In support of the regression function extracted by optimizing AOD agreement with
10
nearby AERONET observations, Fig. 7 shows the results of applying the regression function to dark fields with all AOD values. This histogram of retrieved AOD errors against AERONET ground-based measurements (up to 50 km away) for the real dark field pixels confirms the NDVI- and scattering angle dependant regression function. The achieved standard deviation (0.089) and bias (0.017) are quite satisfactory given
15
the miss-distance/miss-time to the AERONET station of up to 50 km and 60 min. This new regression function is used to determine the surface reflectance in the vis-ible as main pre-condition for retrieving aerosol optical depth. In the ERS-2 SYNAER methodology a constant regression function R670=0.27×R1.6+0. was used, which is
obviously not satisfactory for global application. One drawback of using a regression
20
based on NDVI is the fact, that the NDVI values themselves depend on the aerosol op-tical depth and are typically decreasing with increasing AOD. To overcome this depen-dence, a one-step iteration is conducted, where the preliminary retrieved AOD value is used to adjust the NDVI value and subsequently the same regression function is ap-plied again to calculate a corrected visible surface reflectance, which is then exploited
25
for a corrected AOD retrieval. The function derived empirically to provide optimal agree-ment of retrieved AOD after iteration against AERONET observations is:
ACPD
8, 2903–2951, 2008 SYNAER-ENVISAT T. Holzer-Popp et al. Title Page Abstract Introduction Conclusions References Tables Figures ◭ ◮ ◭ ◮ Back CloseFull Screen / Esc
Printer-friendly Version
Interactive Discussion whereµ0is the cosine of the solar zenith angle.
4 Application examples
4.1 Validation
Ground based photometer measurements are widely used to determine the accuracy of AOD satellite retrievals. However, the natural spatio-temporal variability of aerosol
5
populations is often not considered, leading to miss-interpretations of the significance of such comparisons. This is why the determination of the representativeness of single ground measurement stations – as an indicator for the local variability in AOD and their aptitude for being used as ground truthing station – is of high interest for both satellite and ground based retrieval of aerosols.
10
A possible method for quantifying the natural spatial variability of any given param-eter are variogram analyses: they express the variability of a quantity, e.g. AOD, as measured at different locations but approximately at the same time, seen as a func-tion of the distance between two locafunc-tions considered. In Fig. 8 the result of such a variogram analysis is shown, where the RMSE of AOD550 is plotted as a function
15
of the distance between the ground stations involved. Here all available AERONET ground stations in Europe (squares), the USA (triangles) and the Middle East region incl. Saudi Arabia (crosses) for 2003 to 2005 are included, allowing only high quality level-2 ground data for the analysis. All measurements within ±30 min are considered for each RMSE value and each pair of ground stations, which are then grouped into
20
bins of 50 km for legibility purposes.
It has to be pointed out that due to the regional distribution of the AERONET stations the database for the first values, at a distance of 0 to 50 km, is very small. For all regions considered the “natural variability offset” of the curve, i.e. the variability of AOD within a very small region, is around 0.05. This value of atmospheric noise should always be
25
ACPD
8, 2903–2951, 2008 SYNAER-ENVISAT T. Holzer-Popp et al. Title Page Abstract Introduction Conclusions References Tables Figures ◭ ◮ ◭ ◮ Back CloseFull Screen / Esc
Printer-friendly Version
Interactive Discussion to satellite measurements.
For larger distances the average variability generally increases with rising distance between the locations of ground measurements. However, there are differences for the various regions analyzed: the European stations reach an accuracy of 0.1 at ap-proximatelly 200 km distance between two ground measurement stations, whereas the
5
U.S. locations can be spaced apart as far as 500 km to reach the same natural variabil-ity. In the Middle East this distance accounts to approximately 100 km only, signalizing a rather small representativeness of AOD ground measurements. This means that depending on the geographic location different natural variabilities of aerosol measure-ments have to be taken into account when determining the accuracy limits of satellite
10
based AOD retrieval.
First inter-comparisons of the new SYNAER-ENVISAT version 2.0 results to ground based sun-photometer measurements of the spectral aerosol optical depth from NASA’s Aerosol Robotic Network (AERONET) at 39 locations with moderately dark surface albedo (below 0.20 at 670 nm) and a fit error better than 0.01 (which is
equiv-15
alent to a few percent noise in the spectra) show a good agreement with correlations above 0.80, bias values less than 0.02 and standard deviations of 0.10 (0.13, 0.09) at 550 (440, 670) nm as shown in Fig. 9. This indicates to a correct assessment of the amount and type (namely the spectral dependence of extinction) of aerosol. Through error propagation of the natural variability of at least 0.05 (coincident with the SYNAER
20
pixel size of 60×30 km2) from the variogram analysis of Fig. 8 a standard deviation for the SYNAER retrieval only of 0.08 at 550 nm can be deduced. This ground-based vali-dation comprised data from Europe and Africa in several climate zones distributed over 3 months in the summer season of 2005. A similar case study validation with 15 data pairs of AERONET and the predecessor satellite instruments ATSR-2/GOME onboard
25
ERS-2 showed a similar agreement (Holzer-Popp et al., 2002b). Furthermore, a com-parison of monthly mean results from SYNAER and other satellite aerosol retrievals as well as AERONET stations over ocean (Myhre et al., 2005) showed a qualitative agreement with the other datasets for a number of cases.
ACPD
8, 2903–2951, 2008 SYNAER-ENVISAT T. Holzer-Popp et al. Title Page Abstract Introduction Conclusions References Tables Figures ◭ ◮ ◭ ◮ Back CloseFull Screen / Esc
Printer-friendly Version
Interactive Discussion 4.2 A first 4-monthly dataset
Figures 11 and 12 show examples of the complete coverage of the currently available SYNAER ENVISAT dataset. These figures were obtained with SYNAER version 1.0, as reprocessing of version 2.0 has been started only recently. In these figures only SYNAER pixels with dense vegetation cover were selected (albedo at 670 nm below
5
0.08 for the large spectrometer pixels), where the estimated surface albedo of ver-sion 1.0 and verver-sion 2.0 do not differ as much as for surfaces with lower vegetation cover. Several well-known features can already be clearly seen in the images. The dataset in Fig. 11 gives the 4-month average values for the period July–October 2003 on a 5◦×5◦ grid. In this time period a reasonable coverage in this grid is achieved (as
10
opposed to the earlier ERS-2 coverage, which needed one year of data for a similar pixel number on a 5×5 degree grid). Some values towards the edges of the cov-ered region must still be used with great caution, as there the exploited pixel numbers decrease significantly, so that a single episode can determine the “average” value. Al-though validation of this aerosol composition dataset is solely based on the indirect
15
validation through spectral AOD, in the total aerosol optical depth and the aerosol com-ponent maps distinct features can be seen which are very plausible. The major ones are the tropical biomass burning regions in Africa and South America, the sub-tropical desertic regions (Sahara, Namib/Kalahari, Arabia, South America) and the biomass burning plume over the Atlantic. These are also to some extent visible in the
water-20
soluble component, since this component contributes to all predefined aerosol types in SYNAER (see Table 2). However, AOD values for the water-soluble component in the regions with mineral and soot components are clearly reduced as other compo-nents add to the total AOD. The soot component has its peaks in the biomass burning regions, whereas mineral components concentrate around the desertic areas. No
re-25
trieval is possible inside the Sahara due to the bright surface. The sea salt component seems to be erroneous as the peaks occur inland, but absolute values are small. There seems to be a correlation with the mineral components. Thus, it must be concluded,
ACPD
8, 2903–2951, 2008 SYNAER-ENVISAT T. Holzer-Popp et al. Title Page Abstract Introduction Conclusions References Tables Figures ◭ ◮ ◭ ◮ Back CloseFull Screen / Esc
Printer-friendly Version
Interactive Discussion that within the typical AOD values due to sea salt a separation of the different large
particles (mineral, sea salt) is not successfully achieved so far.
The seasonal behaviour visible in the SYNAER data is indicated in Fig. 12 for the soot component, though with very small pixel numbers contributing to each grid cell. Here, three major features can be seen: From July to September the tropical African
5
biomass burning moves South-East together with its plume over the Atlantic (which as slightly visible). The Amazonian biomass burning season mainly extends from August to October. Over large parts of Europe, no data are available in December (due to low sun, high cloudiness and snow cover). Highest European soot concentrations are detected, when observations are becoming available still in the heating season (April).
10
Additionally, wildfires in August (hot summer 2003 in Europe) contribute to elevated soot over the Iberian peninsula. These features are precluded in the total aerosol optical depth due to other emissions; the water-soluble component shows correlated features as it is also partly linked to biomass burning emissions.
5 Discussion and outlook
15
The SYNAER method provides a retrieval, which exploits the optical measurements made from two sensors in one retrieval algorithm. One significant drawback from this synergetic application is the limited spatial resolution of 60×30 km2and the weak tem-poral repetition frequency of 12 days at the equator in cloud-free conditions. On the other hand the gain lies in the joint exploitation of 10 spectrometer and 3 radiometer
20
spectral channels. Consecutively, the information content in this retrieval enables un-der favourable conditions (dark surface, high sun) the independent retrieval of not only the aerosol loading (aerosol optical depth), but also its composition. As the validation of the retrieved aerosol composition is extremely difficult due to a lack of equivalent ground-based data, only an indirect validation approach through multi-spectral AOD
25
measurements is used so far. Validation of satellite derived information with this large pixel size and low spatial-temporal coverage is further impeded due to atmospheric
ACPD
8, 2903–2951, 2008 SYNAER-ENVISAT T. Holzer-Popp et al. Title Page Abstract Introduction Conclusions References Tables Figures ◭ ◮ ◭ ◮ Back CloseFull Screen / Esc
Printer-friendly Version
Interactive Discussion noise and the limited number of ground-based stations. It is also important to
under-stand, that this type of satellite retrieval depends critically on the aerosol model chosen and its limitations or its complexity. In the end, the retrieval of aerosol composition must therefore be considered as a way of interpretation of the optical measurements. But, it is the conviction of the authors that the plausible results shown in this paper encourage
5
further work in this direction.
The validation against AERONET stations includes several cases where the repre-sentativeness of the ground-based station for the SYNAER pixel is weak. Examples are Fontainbleau (at the edge of the megacity Paris), Ispra (at the edge of an Alpine valley), Erdemli (at the coast with high mountains behind). In all these cases the
lo-10
cal AOD regime at the station differs significantly from the regional AOD. One extreme case at Teneriffe island was excluded by the ambiguity test of SYNAER. Here 2 sta-tions (Izana at 2367 m above sea level with an AOD550 of 0.39 and Santa Cruz at sea level with an AOD550 of 0.71) fall into 1 SYNAER pixel (AOD550=0.94) thus highlight-ing the possible variability inside a SYNAER pixel for an extreme case of a desert dust
15
outbreak and the subsequent limitation for the AERONET inter-comparison.
In this paper several improvements of the SYNAER method are described and their application with the new sensor pair SCIAMACHY and AATSR is demonstrated and validated. Given the pixel size the retrieval accuracy of around 0.1 at 550 nm (or 0.08 after atmospheric noise deduction) is satisfactory. The theoretical analysis of the
infor-20
mation content in the methodology yielded up to 5 degrees of freedom (1 for surface albedo, 1 for AOD and 3 for the aerosol type) and thus supports the conclusion, that an estimation of the aerosol composition is becoming feasible under favourable conditions with this method. Under typical conditions over vegetated surfaces 2 degrees of free-dom are available for information on the aerosol type. As two independent parameters
25
(e.g. spectral extinction gradient and absorption) are needed to differentiate mono-modal aerosol distributions, this would be sufficient to characterize the major aerosol types. At least one more degree of freedom is needed for bi-modal aerosol distribu-tions, which is then only feasible for the best possible conditions. Further analysis is
ACPD
8, 2903–2951, 2008 SYNAER-ENVISAT T. Holzer-Popp et al. Title Page Abstract Introduction Conclusions References Tables Figures ◭ ◮ ◭ ◮ Back CloseFull Screen / Esc
Printer-friendly Version
Interactive Discussion required to interpret the information content with regard to these different parameters.
For example the apparent absorption sensitivity in the method (being able to differen-tiate water-soluble and soot components) may also be provided by the integrating of different scales of the 2 instruments (1 km and 60/30 km) and thus by averaging dark and bright pixels, which is sensitive to the non-linearity in radiative transport.
5
The spatial patterns already visible in the first dataset (version 1.0) over Europe, Africa, the Atlantic and parts of South America are in agreement with the known sea-sonal and regional features. This demonstration has only become possible through the transfer from ERS-2 to ENVISAT, which meant a significant step in temporal sampling (with ERS-2 only 3 days in each month provided a suitable pixel size of 80×40 km2).
10
One specific feature, which has not been shown in MODIS AOD or coarse mode maps is the mineral dust AOD over the Namib/Kalahari region. This region is shown in dust mobilization models as source of mineral dust which are different from the Saharan re-gion normally not transported away from their origin due to the prevailing wind regime in this region. Further evaluation is needed to decide if this is a true retrieval result, which
15
becomes possible due to the larger acceptable surface albedo, or if this is an artefact produced by the typical (red sand) surfaces in this area. One might also ask for the missing dust plume over the Atlantic in the mineral dust component map. However, this is not to be expected in this dataset due to the season (normally desert dust outbreaks occur mostly before and after the 4-month period treated in this paper). Additionally,
20
the miss-interpretation of thick dust layers as clouds in the cloud screening algorithm (discussed in Sect. 3.2.1) may have hidden occasional dust events in the dataset.
As all satellite retrieval algorithms for aerosols SYNAER is limited by a mathemat-ically ill-posed system, which makes several assumptions and simplifications neces-sary. These are in addition to the limited sampling the limitation to spherical particles
25
(Mie scattering), the dependence on the pre-defined aerosol mixtures, the decreasing information content with brighter surfaces, and the general optical remote sensing lim-itations for low sun and high cloud fraction. One critical element in SYNAER is still the application of the theoretical analysis to each pixel geometric and surface