HAL Id: hal-01980993
https://hal.archives-ouvertes.fr/hal-01980993
Submitted on 14 Jan 2019
HAL is a multi-disciplinary open access
archive for the deposit and dissemination of
sci-entific research documents, whether they are
pub-lished or not. The documents may come from
teaching and research institutions in France or
abroad, or from public or private research centers.
L’archive ouverte pluridisciplinaire HAL, est
destinée au dépôt et à la diffusion de documents
scientifiques de niveau recherche, publiés ou non,
émanant des établissements d’enseignement et de
recherche français ou étrangers, des laboratoires
publics ou privés.
Statistics of mass diameter percentiles in tropical
convection observed during the HAIC/HIWC project.
Delphine Leroy, Emmanuel Fontaine, Alfons Schwarzenboeck, John Walter
Strapp, Alexei Korolev, Greg M. Mcfarquhar, R. Dupuy, Christophe
Gourbeyre, Lyle Lilie, Alain Protat, et al.
To cite this version:
Delphine Leroy, Emmanuel Fontaine, Alfons Schwarzenboeck, John Walter Strapp, Alexei Korolev, et
al.. Ice crystal sizes in high ice water content clouds. Part 2: Statistics of mass diameter percentiles in
tropical convection observed during the HAIC/HIWC project.. Journal of Atmospheric and Oceanic
Technology, American Meteorological Society, 2017, 34 (1), pp.117-136. �10.1175/jtech-d-15-0246.1�.
�hal-01980993�
Ice Crystal Sizes in High Ice Water Content Clouds. Part II:
Statistics of Mass Diameter Percentiles in Tropical Convection
Observed during the HAIC/HIWC Project
D. LEROY,aE. FONTAINE,aA. SCHWARZENBOECK,aJ. W. STRAPP,bA. KOROLEV,cG. MCFARQUHAR,d R. DUPUY,aC. GOURBEYRE,aL. LILIE,eA. PROTAT,fJ. DELANOE,gF. DEZITTER,hANDA. GRANDINh
aLaboratoire de Météorologie Physique, CNRS/Université Blaise Pascal, Aubière, France bMet Analytics, Inc., Toronto, Ontario, Canada
cEnvironment and Climate Change Canada, Toronto, Ontario, Canada dUniversity of Illinois at Urbana–Champaign, Urbana, Illinois eScience Engineering Associates Inc., Mansfield Center, Connecticut
fResearch and Development Branch, Bureau of Meteorology, Melbourne, Victoria, Australia gLaboratoire Atmosphère, Milieux, Observations Spatiales, Guyancourt, France
hAirbus Operation SAS, Toulouse, France
(Manuscript received 8 December 2015, in final form 12 October 2016) ABSTRACT
High ice water content (IWC) regions in mesoscale convective systems (MCSs) are a potential threat to commercial aviation, as they are suspected to cause in-service engine power-loss events and air data probe malfunctions. To investigate this, the high-altitude ice crystals (HAIC)/high ice water content (HIWC) projects set up a first field campaign in Darwin (Australia) in 2014. The airborne instrumentation was selected to provide the most accurate measurements of both the bulk total water content (TWC), using a specially developed isokinetic evaporator, and the individual ice crystals properties, using particle imaging probes.
This study focuses on determining the size ranges of ice crystals responsible for the mass in high IWC regions, defined here as cloud regions with IWC greater than 1.5 g m23. It is shown that for high IWC areas in most of the encountered MCSs, median mass diameters (MMDs) of ice crystals range from 250 to 500mm and decrease with increasing TWC and decreasing temperature. At the same time, the mass contribution of the smallest crystals (below 100mm) remains generally low (below 15%).
In contrast, data from two flight missions in a long-lasting quasi-stationary tropical storm reveal that high IWC values can also be associated with MMDs in the range 400–800mm and peak values of up to 2 mm. Ice crystal images suggest a major growth contribution by vapor deposition (columns, capped columns) even for such larger MMD values.
1 Introduction
Reports from pilots of in-service engine ice crystal icing events encountered by commercial aircraft flying close to deep convective clouds highlight the need to gather more quantitative information about ice particle properties in mesoscale convective systems (MCSs). The ingestion of large mass concentrations of ice crystals is indeed suspected to cause jet engine power-loss events (Lawson et al. 1998; Mason et al. 2006).Mason et al. (2006)also contended that supercooled liquid water was
not required for ice crystal icing, and that events oc-curred in areas dominated by small ice crystals due to the pilot’s ‘‘low’’ radar reflectivity, which was typically a ‘‘green’’ return (approximately 20–30 dBZ) or no return (less than approximately 20 dBZ) during events. How-ever, the occurrence of such areas with high concentra-tions of ice crystals, as well as the corresponding ice crystal properties and formation processes in high ice water content (IWC) cloud regions, remains poorly documented.
In situ investigation of the microphysical properties of MCSs and in particular of potential high IWC areas is a significant challenge. First, specific operational pro-cedures have to be put in place to ensure the safety of
Corresponding author e-mail: Delphine Leroy, d.leroy@opgc. univ-bpclermont.fr
DOI: 10.1175/JTECH-D-15-0246.1 Ó 2017 American Meteorological Society
the flight, as aircraft operation near convective cores could cause potential damage to the airplane. Second, in earlier research programs investigating deep convective ice clouds, the airborne instrumentation may have suf-fered from insufficiently accurate reference measure-ments of high bulk IWC values and individual ice crystal properties throughout the complete range of possible sizes. Third, focusing on regions of the highest IWC values in MCS clouds and gathering enough data for determining total water content (TWC) has not been a priority in past research programs. Indeed, during the Central Equatorial Pacific Experiment (CEPEX;
McFarquhar and Heymsfield 1996), the Tropical Rainfall Measuring Mission (TRMM; Heymsfield et al. 2002), the African Monsoon Multidisciplinary Analysis (AMMA; Bouniol et al. 2010) and the Stratospheric-Tropospheric Analyses of Regional Transport 2008 (START08; Diao et al. 2013, 2015) campaigns, bulk measurements of (high) IWC in tropical anvils were not available. IWC values were mostly estimated/derived from particle imagery. For example, Mitchell et al. (2011) also derived IWC from particle imagery with maximum values of 0.1 g m23for the few cirrus clouds sampled during the Indirect and Semi-Direct Aerosol Campaign (ISDAC). Recently, Krämer et al. (2016) gathered data from 17 different field campaigns related to cirrus clouds but obtained only a few data values close to 1 g m23.Heymsfield et al. (2002)derived IWC from TRMM data and found that most of the IWC ranged between 0.1 and 0.5 g m23.
Indeed, reports of high TWC/IWC are mainly re-lated to measurements close to active convective cells.
McFarquhar and Heymsfield (1996, p. 2409) do-cumented ‘‘extremely high IWC (1 g m23) near the convection’’ in the CEPEX database.Heymsfield et al. (2004, p. 986) reported that ‘‘exceptionally large IWCs of nearly 1 g m23were measured near the tops of the layers’’ during two spiral descents performed in con-vectively generated cirrus anvils during the Cirrus Regional Study of Tropical Anvils and Cirrus Layers– Florida-Area Cirrus Experiment (CRYSTAL-FACE). Larger values were found byMcFarquhar et al. (2007)
during the Bow Echo and Mesoscale Convective Vortex Experiment (BAMEX) field campaign, when computing the total mass content (TMC) from particle size measurements and reflectivities. Values reached 2.8 g m23 during some spiral descents at the rear of convective lines. Other observations of occasional high IWC values (1 g m23 and more) can be found (i) in
Lawson et al. (1998) during the Cooperative Convec-tive Precipitation Experiment (CCOPE) and CEPEX campaigns; (ii) in (Lawson et al. 2010) during Tropical Composition, Cloud and Climate Coupling (TC4) and
NASA African Monsoon Multidisciplinary Analysis (NAMMA) campaigns; and (iii) in Fontaine et al. (2014)for the Megha-Tropiques campaigns in Niger in 2010 and in the Maldives 2011. The IWC values of these studies were obtained by integrating particle size dis-tributions derived from optical array probe imagery, sometimes combined with radar reflectivities, and also during TC4 using a counterflow virtual impactor (CVI); however, this probe is not suitable for studying high IWC, as the CVI saturated at IWC is larger than about 0.5 g m23(Lawson et al. 2010).
The multiyear international high-altitude ice crystals (Dezitter et al. 2013)/high ice water content (Strapp et al. 2016a) (HAIC/HIWC) field project was primarily designed to collect statistics on the levels of TWC and ice crystal sizes in high IWC regions of MCS convection to support the assessment of a new ice crystal icing certification envelope for ice crystals (Federal Aviation Administration NPRM 10–10 Appendix D; European Space Agency NPA 2011–03 Appendix P) and to pro-vide data to advance scientific understanding of the high ice water content (high IWC) environment. Direct bulk IWC measurements were provided by the iso-kinetic evaporator probe (IKP2; Davison et al. 2016;
Strapp et al. 2016b) that was specially designed for high IWC measurements.
The first flight campaign was conducted out of Darwin, Australia, in 2014. The Service des Avions Français Instrumentés pour la Recherche en Envi-ronnement (SAFIRE1) Falcon 20 research aircraft
was used to make in situ and remote measurements of the properties of oceanic MCSs, mostly at high alti-tudes. High IWC values were encountered during multiple flights with a maximum 5-s averaged value of 3.7 g m23. If we define for this study high IWC as measurements of bulk IWC values larger than 1.5 g m23, then the HAIC/HIWC dataset contains 2430 data points, with a duration of 5 s (;3 h, 20 min of flight), meeting this condition, providing a unique opportunity to investigate the properties of ice crys-tals in such regions.
This article focuses on ice particle size distributions (PSDs) and median mass diameters (MMDs) com-puted from optical array probe (OAP) images collected in those high IWC regions. A brief description of the 2014 HAIC/HIWC field campaign, the instrumental payload, and the processing of OAP images is given in the next section. The scientific results are then
1French airborne environment research service, http://www.
presented insections 3and4. The main conclusions are detailed in the last section.
2. The HAIC/HIWC dataset a. The Darwin field campaign
1) OVERVIEW OF FLIGHTS AND SAMPLED CONDITIONS
The first international HAIC/HIWC field campaign took place in Darwin in 2014 during the monsoon sea-son. Flight plans followed recommendations of the Engine Harmonization Working Group (EHWG), composed of engine manufacturers, airframers, aviation regulators, and government research agencies specially tasked to investigate weather-related engine events. The flight plans were based on the analysis of an engine power-loss event database and are described in detail in
Strapp et al. (2016a). Main targets were MCSs with cloud anvils larger than 100 n mi (roughly 185 km) in horizontal extension, with a priority given to clouds forming over the ocean, but also with consideration for gathering similar data over land. Flight patterns favor long legs at constant altitude, similar to what would be flown by a commercial pilot, avoiding red echoes on the pilot’s radar at flight level but trying to match engine event conditions by flying next to but at a safe distance
from areas with overshooting tops and areas of heavy precipitation below the aircraft—and if possible, inter-cepting updrafts and active convective cells.
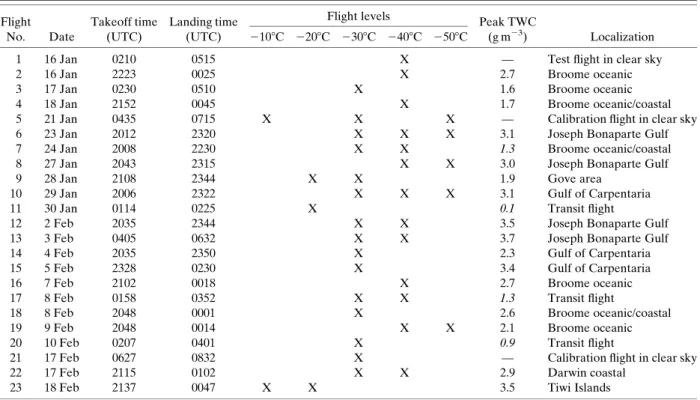
Table 1provides a quick overview of the campaign that started mid-January and lasted until the beginning of March. Twenty-three flights were performed with the French Falcon 20 aircraft. Flights 1, 5, and 21 were cal-ibration flights mostly in clear sky and flights 11, 17, and 20 were transit flights returning from a scientific mission after refueling at another airport but still operating the cloud instrumentation in case interesting conditions were found. In the remaining flights, oceanic convection was primarily sampled, off the coast of Broome or Darwin, in the Joseph Bonaparte Gulf, and in the Gulf of Carpentaria. As Darwin is UTC 1 9 h, 30 min, a 2000 UTC takeoff corresponded to 0530 local time (LT); the peak in oceanic convection is known to occur be-tween 0300 to 0600 LT in the Darwin area (Protat et al. 2014). The EHWG recommended organization of the data collection at discrete temperature intervals from2108 to 2508C. During the Darwin flight program, the Falcon 20 mainly operated at the2408 and 2308C levels and to a lesser extent at2508 and 2158C. A study of the satellite imagery (not shown here) revealed that the sampled MCSs always lasted more than 10 h.
Darwin’s monsoon is modulated by the Madden– Julian oscillation (MJO; Madden and Julian 1972),
TABLE1. Overview of the 23 flights of the HAIC/HIWC Darwin campaign. Peak TWC values stem from IKP2 measurements at a 5-s resolution. Italic values denote flights with maximum TWC below 1.5 g m23.
Flight No. Date Takeoff time (UTC) Landing time (UTC)
Flight levels Peak TWC
(g m23) Localization 2108C 2208C 2308C 2408C 2508C
1 16 Jan 0210 0515 X — Test flight in clear sky 2 16 Jan 2223 0025 X 2.7 Broome oceanic 3 17 Jan 0230 0510 X 1.6 Broome oceanic 4 18 Jan 2152 0045 X 1.7 Broome oceanic/coastal 5 21 Jan 0435 0715 X X X — Calibration flight in clear sky 6 23 Jan 2012 2320 X X X 3.1 Joseph Bonaparte Gulf 7 24 Jan 2008 2230 X X 1.3 Broome oceanic/coastal 8 27 Jan 2043 2315 X X 3.0 Joseph Bonaparte Gulf 9 28 Jan 2108 2344 X X 1.9 Gove area
10 29 Jan 2006 2322 X X X 3.1 Gulf of Carpentaria 11 30 Jan 0114 0225 X 0.1 Transit flight
12 2 Feb 2035 2344 X X 3.5 Joseph Bonaparte Gulf 13 3 Feb 0405 0632 X X 3.7 Joseph Bonaparte Gulf 14 4 Feb 2035 2350 X 2.3 Gulf of Carpentaria 15 5 Feb 2328 0230 X 3.4 Gulf of Carpentaria 16 7 Feb 2102 0018 X 2.7 Broome oceanic 17 8 Feb 0158 0352 X X 1.3 Transit flight
18 8 Feb 2048 0001 X 2.6 Broome oceanic/coastal 19 9 Feb 2048 0014 X X 2.1 Broome oceanic 20 10 Feb 0207 0401 X 0.9 Transit flight
21 17 Feb 0627 0832 X — Calibration flight in clear sky 22 17 Feb 2115 0102 X X 2.9 Darwin coastal
which is monitored by the Bureau of Meteorology (BoM) through the Real-time Multivariate MJO (RMM1 and RRM2) indices (Wheeler and Hendon 2004). The evolution of RMM1 and RRM2 indices during January and February 2014 are displayed in
Fig. 1, where red diamonds highlight days on which flights were performed (corresponding flight numbers appear in red).Figure 1shows that more than half of the Darwin flights (13 out of 23) were made in phase 5 or 6, which corresponds to favorable conditions for convec-tion over the northern part of Australia according to
Protat et al. (2014). Six flights were made during weak MJO conditions, which still favor oceanic convection close to Darwin. The last four flights during MJO phase 7 favor convection over the eastern portion of Australia but with rainfall rates and frequency in Darwin still close to their climatological averages. Overall, the 17 cloud measurement flights of the Darwin HAIC campaign sampled MCSs linked to mostly favorable convective conditions but associated with different MJO phases.
2) AVAILABLE INSTRUMENTATION
The research aircraft was equipped with a state-of-the-art in situ microphysics package, including a cloud droplet probe (CDP-2;Lance et al. 2010), a 2D-stereo probe (2D-S; Lawson et al. 2006), and a precipitation imaging probe (PIP; Baumgardner et al. 2011). The CDP-2 provides droplet size distributions in the 2–50-mm range, whereas the 2D-S and PIP capture particle
images in the range of 10–1280 and 100–6400mm, re-spectively, with resolutions of 10mm (2D-S) and 100 mm (for PIP). Bulk TWCs were provided by both a Science Engineering Associates (SEA) Robust probe (Strapp et al. 2008;Grandin et al. 2014) and an IKP2 (Davison et al. 2016; Strapp et al. 2016b). In addition to the CDP-2, SEA liquid water content (LWC) sensors and a Rosemount Ice Detector (RICE; Baumgardner and Rodi 1989;Claffey et al. 1995;Cober et al. 2001) were installed to detect supercooled liquid water areas. Finally, a sophisticated cloud research radar (a multi-beam 95-GHz Doppler radar;Protat et al. 2009) pro-vided 3D high-resolution characterization of the dynamical and retrieved microphysical properties of ice clouds. The next section gives some insights into the data postprocessing.
b. IWC measurements
1) IKP2PROBE AND DATA PROCESSING
The IKP2 probe is a downsized version of a prototype isokinetic evaporator designed especially to make measurements in the high IWC/high speed/high-altitude environment up to at least 10 g m23at 200 ms21with a target accuracy of 20% (Davison et al. 2008). The probe measures total condensed water content and is close to a first-principles method due to the simple method of operation, the lack of empirical estimation, and the di-rect measurement of humidity to provide TWC. The instrument is mounted under the wing with an inlet well ahead of the wing leading edge, and it nearly isokineti-cally samples a 7-mm-diameter stream of liquid and ice particles without significant mass loss. The probe then evaporates all condensed water (solid, liquid) and sub-sequently measures the total water vapor before the air exits the probe. The total condensed water content is then found by subtracting the background water vapor in the air from the probe total water vapor measurement.
The development of the instrument and the un-certainties on the TWC measurements are described in
Davison et al. (2016)andStrapp et al. (2016b).Davison et al. (2016)estimated from fluid dynamic simulations that capture efficiencies are larger than 99% for parti-cles larger than 24mm at sea level and larger than 15 mm at 12-km height. A large effort was expended to test the probe in wind tunnels to ensure reliable operation without saturation at high IWC, a problem that has been observed in other evaporators, such as the counterflow virtual impactor. Uncertainties in the IKP2 data pro-cessing mainly stem from estimating the background water vapor content, which leads to relatively small er-rors at colder temperatures but increasingly large erer-rors
FIG. 1. Madden–Julian oscillation phase determined from the RMM indices ofWheeler and Hendon (2004)for January (blue) and February (green) 2014, issued by the BoM. Flight days are highlighted with a red diamond, labeled with the flight number.
at warmer temperatures that currently limit the practical use of the probe in a tropical turbulent environment to about 08C or colder. The system error analysis of
Davison et al. (2016)predicts the target 20% accuracy for TWC values larger than 0.25 g m23and temperatures colder than 2108C. Errors reduce quickly with de-creasing temperature and inde-creasing IWC due to the decreasing importance of background water vapor, dropping to 3%–5% for TWC values larger than 0.5 g m23at2208C.Strapp et al. 2016bpresented com-parisons of the IKP2 LWC and IWC to tunnel reference values, which in themselves are derived from in-struments such as hot wires or bulk collectors and are thus subject to their own errors. Overall, comparisons support the IKP2 target accuracy of 20% or better, with the larger errors associated with the tunnel bulk collec-tion IWC reference, which uses an ice capture cylinder method that is not well established or documented and was highly suspected to be subject to underestimation. During the Darwin experiment, an additional uncertainty was identified. Because of contamination of the back-ground water vapor measurement by wetting in rain and by ice crystal injection, it was necessary to assume that in-cloud humidity was at ice saturation, an additional factor that is currently believed to lead to uncertainties of the order of 0.2, 0.1, and 0.05 g m23at2108, 2308, and2408C, respectively.
Table 1gives the 5-s peak TWC values recorded by the IKP2 for each flight, when the aircraft was flying at a constant level as called for in the flight plans. Excluding calibration flights in clear sky, the 1.5 g m23threshold (which will be used later in this work to focus on high IWC areas) was reached in 16 flights of the 21 remaining. Setting a maximum threshold of 1.5 g m23excludes only flight 7 and transit flights 11, 17, and 20 from the analysis. The maximum 5-s TWC value reaches 3.7 g m23 for flight 13.
2) REMOVAL OF MIXED-PHASE CLOUD AND SUPERCOOLED LIQUID WATER CASES
As supercooled liquid water is known to exist up to temperatures as cold as2408C (Sassen and Dodd 1988;
Heymsfield and Miloshevich 1993; Heymsfield et al. 2005; Rosenfeld and Woodley 2000), the presence of supercooled liquid water has to be identified and re-moved from the dataset, in order to focus on entirely glaciated cases for which the TWC from the IKP can be solely attributed to IWC.
The occurrence of liquid water in the dataset has been studied by combining the measurements from the CDP-2, RICE, and the 2D-S. Unfortunately, given the low levels of LWC observed, the SEA LWC sensor was unable to be used to estimate LWC due to the relatively
high levels of false response to ice crystals in the high IWC regions. Thus, for supercooled water droplet identification, the first stage consists of analyzing the CDP-2 number concentration, as droplet concentration is in general orders of magnitude higher than ice crystal concentration. All cases with CDP-2 total concentra-tions exceeding 10 cm23were studied, a threshold about 10 times lower than typical droplet concentrations (e.g.,
Rosenfeld and Woodley (2000)). For each of these cases, any noticeable change in the RICE frequency is con-sidered proof of liquid water. In addition, in the case of no RICE response, a comparison between the CDP-2 and 2D-S was performed. With its 10-mm resolution, even a 50-mm droplet will result only in a 503 50pixel
image and thus the shape of the 2D-S images cannot help distinguish between liquid and ice particles. How-ever, 2D-S number concentrations in the first five bins can confirm CDP-2 measurements. Good agreement in the CDP-2 and 2D-S PSDs (in terms of PSD shape and values) supports the presence of a liquid-dominated cloud, whereas a more flattened CDP-2 particle spec-trum relative to the 2D-S specspec-trum is indicative of an ice cloud with a false CDP-2 response to ice crystals. Fur-ther details are given in theappendix.
In the Darwin dataset, the CDP-2 just occasionally exceeded 1–10 cm23 in number concentration, leading to only a few possible cases to study. Combining in-formation from the RICE and the 2D-S for all those cases leads to the identification of only a few events of supercooled LWC, representing less than 3 min of the entire dataset. These events have been excluded from the analysis presented here. Thus, TWC measurements from the IKP2 are almost exclusively composed of IWC, as best as can be determined by the detection levels of the instruments.
c. PSD and MMD retrievals from OAP images 1) PARTICLE SIZE DEFINITION
Various size parameters have been defined in the lit-erature to define the size of an ice crystal OAP 2D im-age. In this study, the 2D area-equivalent diameter Deq,
defined as the diameter of a circle of the same area as the 2D particle image, has been chosen,
Deq5 ffiffiffiffiffiffi 4S p r , (1)
where S is the total area of shadowed pixels.
The 2D area-equivalent diameter was chosen due to its unambiguous definition, where other definitions, such as ‘‘maximum diameter’’ Dmax, can differ from
Heymsfield (1996) defined the Dmax as the
larg-est dimension along the main flow (lx) or the length
along the photodiode array (ly), whichever was larger.
Heymsfield et al. (2013, p. 4124) chose ‘‘the smallest diameter of a circle that fully encloses the projected 2D image.’’ The Dmax in Korolev and Isaac (2003) was
calculated as the maximum Dyamong all possible
ori-entations of the recorded 2D image, where Dy is the
particle size along the photodiode array. Wu and McFarquhar (2016) recently compared different Dmax
definitions and demonstrated that number concentra-tions can differ by up to a factor of 6 for particles smaller than 200mm or larger than 2 mm, with IWCs varying by up to a factor of 3.
Moreover, King (1986) demonstrated that the flow features around the aircraft can lead to a preferential crystal orientation of recorded images; thus, lx and ly
dimensions could be biased, especially when sampling high eccentricity images such as columns. Compared to lx and ly, the Deq definition is less impacted by a
pref-erential crystal orientation.
Finally, particle images truncated on either or both edges of the diode array have been processed according to Korolev and Sussman (2000) in order to retrieve ‘‘reconstructed’’ full-image sizes. This method applies an algorithm based on a circular image in order to reconstruct/compute the ‘‘true’’ particle dimension of truncated images. Using Deqinstead of Dmaxenhances
consistency between the retrieved size of complete and truncated images. Also, from MMDmax/MMDeq
comparisons, Leroy et al. (2016) suggested that the
Korolev and Sussman (2000)reconstruction method in general leads to a more substantial underestimation of Dmaxrelative to Deq.
2) PARTICLE SIZE DISTRIBUTION RETRIEVAL
The postprocessing applied to the HAIC/HIWC im-age dataset treats all major artifacts observed in OAP sampling. Details can be found inLeroy et al. (2016)and only the key processing steps are reviewed below.
Removal of noisy pixels has been performed accord-ing toLawson (2011), even though this phenomenon is rare in the HAIC dataset, and the sizes of out-of-focus particles are corrected according toKorolev (2007). The most recently available antishattering tips were em-ployed to greatly reduce the number of shattering and splashing events (Korolev et al. 2013). An analysis of particle interarrival times is used to further remove the remaining events (Field et al. 2006;Baker et al. 2009;
Lawson 2011;Korolev and Field 2015). The interarrival time distribution is computed every 1 s and is used to determine the cutoff time that is subsequently applied to separate natural particles from shattered ones.
The PSD computation requires both the individual bin counts and the sample volume (SV) of the probe, which is the product of the sample area (SA), true air-speed (TAS), and sample time (Heymsfield and Parrish 1978),
SV5 SA 3 TAS 3 dt. (2) Sample time excludes overload time, that is, the time when the probe is not able to record images due to the unloading particle images data. Overload times are di-rectly recorded by the 2D-S probe, whereas the PIP overload time fraction is estimated by computing the ratio of the number of recorded images to the total number of particles crossing the laser beam (the latter being an independent measurement of the PIP not subject to overload).
To compute the SA, the depth of field (DOF) and the effective beamwidth W are needed, and both are size dependent (e.g.,Brenguier et al. 2013),
SA5 DOF 3 W (3) The depth of field is computed according to each probe manufacturer’s definition (SPEC 2011; DMT 2009). When taking into account complete plus truncated im-ages, the effective array width is defined as
W5 (NPH1 Ny2 1)Dx, (4) where NPHis the number of photodiodes across the
ar-ray,Dx is the probe’s pixel size resolution, and Nyis the
number of shaded pixels along the photodiode array direction.
The PSDs from the 2D-S and the PIP are merged into a composite particle size distribution ranging from 10mm up to 12.8 mm at a 5-s time resolution. The 2D-S data are used below 800mm, the PIP above 1200 mm and complementary linear weights for both probes are ap-plied over the range of 800–1200mm.
3) MASS–SIZE RELATIONSHIP ANDMMD
COMPUTATION
To convert PSD number concentrations into mass– size distributions, mass–size relationships are commonly applied. Then, the MMDs are deduced from the mass distributions. The MMD is the size in the mass distri-bution at which 50% of the ice mass is contained in smaller particles and 50% in larger particles.
Mass–size relationships are usually represented as a power-law relationship, m5 aDb. Erfani and Mitchell (2016) recently proposed polynomial curve fits in the form of lnm5 a01 a1lnD1 a2(lnD)2, but they also
simpler power law for application in cloud microphys-ical schemes and how to compare other power-law mass–size relationships that are common in the litera-ture (Locatelli and Hobbs 1974; Brown and Francis 1995;Mitchell 1996;McFarquhar et al. 2007;Fontaine et al. 2014;Heymsfield et al. 2010;Cotton et al. 2013). Individual power-law mass relationships are often es-tablished for different crystal types (or shapes) present in the atmosphere; although in practice, single re-lationships with constant values ofa and b are com-monly used for all ice crystal data of an entire flight, regardless of crystal type.
Leroy et al. (2016)tested the sensitivity of the MMD to the chosen mass–size relationship and demonstrated that MMDs are very sensitive to the value of the b parameter. Therefore, the value of the b exponent should be determined with caution. In this regard,
Leroy et al. (2016) proposed a method to deduce b from the projected area–size and perimeter–size re-lationships that can be directly deduced from the OAP images. Theb parameter is thus no longer constant but varies in time according to the particle morphological information extracted from the OAP images. Leroy et al. (2016)illustrated that this method interestingly led to MMD values that were rather similar for various initial size definitions (Dmax, Deq, and others), which
was not necessarily the case when using constant values for b from the literature. For this reason, the time-dependent retrieval of theb exponent fromLeroy et al. (2016) was adopted for this study. Then, the TWC measurements from IKP2 are used to constrain the prefactora,
ð‘
0
N(D)aDbdD5 TWC. (5) Apart from the mass–size relationship, MMDs are mainly controlled by the PSDs themselves. Sensitivity studies demonstrate that the MMD value is relatively insensitive to even very large increases in the concen-trations of the smallest particle sizes (e.g., below 50mm). In contrast, MMDs are much more sensitive to the slope of the tail of the PSD. We estimate that the mean MMD error of this study due to the choice of the image analysis method is less than 5%, corresponding to a mean ab-solute error of roughly 30mm on average MMD values of roughly 600mm.
3. Detailed analysis of high IWC regions in two contrasting flights
From the entire HAIC/HIWC dataset, flights 13 (on 3 February) and 16 (on 7 February) were selected to first
present two contrasting examples of the first detailed analysis of the MMDs and PSDs in high IWC regions. A more statistical analysis of the whole dataset will be presented insection 4of this study.
a. Synoptic situation
Figure 2presents the analysis charts from the Aus-tralian Bureau of Meteorology describing the synoptic situations corresponding to flights 13 and 16. For both cases, two lows are present on the northern part of Australia, one close the Joseph Bonaparte Gulf (southwest of Darwin) and the other one located over the Gulf of Carpentaria (east of Darwin). Both low pressure systems have a minimum pressure close to 994 hPa; however, the horizontal pressure gradient is much higher in flight 13 than in flight 16.
The Multifunctional Transport Satellite (MTSAT) infrared brightness temperatures observed during the flight missions are shown in the lower panels ofFig. 2. From the analysis of the MTSAT images, the scale of the MCS cloud shield is estimated to be about 650 km for flight 16, which is approximately 100 km larger than for flight 13, and the convective activity appears to last almost 14 h during flight 13, which is roughly 1.75 times longer than for flight 16. In fact, the same MCS observed during flight 13 was sampled earlier in the day during flight 12. Flight 12 had been performed in the postmaturing stage and even the decaying stage of the storm, and a significant flare-up after the first landing led to the launch for flight 13.
According to flight reports, cloud passes for flights 12 and 13 were characterized by low turbulence, low lightning activity, and high IWC. Maximum 5-s aver-aged IWC reached 3.5 g m23during flight 12 (cf.Table 1) and sustained high IWC areas were sampled again during flight 13, with peak 5-s values exceeding 3.5 g m23, as can be seen in the lower-left panel of
Fig. 2, showing IKP2 TWC measurements during
flight 13.
For flight 16, continuous convection had been ob-served overnight near the low-level center, with cloud tops reaching2908C with little lightning activity. The convective area sampled during flight 16 was at a mature stage but with lightning starting to decay. The TWC showed sustained periods of high IWC with peak values larger than 2.5 g m23 (see lower-right panel of Fig. 2). Toward the end of the flight the MCS collapsed.
On the one hand, oceanic MCSs sampled during flight missions 13 and 16 have some similarities: both were associated with a low pressure system and both were made during an active stage of the cloud life cycle with high peak and sustained values in IWC. On the other
hand, synoptic conditions differ somewhat, with the MJO phase analysis classifying flight 13 as having MJO phase 7 conditions and flight 16 as having weak MJO conditions (cf.Fig. 1). However, the main difference is found in the lifetimes of the MCSs. Like most of the Darwin flights, the flight 16 MCS fits the typical early morning oceanic convective case described byProtat et al. (2014)with peak convective activity during the night and subsequent morning system decay. In con-trast, the MCS sampled during flights 12 and 13 is more unusual in the sense that convection reactivated
in the morning instead of collapsing. No other MCS sampled during the Darwin campaign exhibited such behavior.
b. Characteristics of high IWC regions
Figures 3and4illustrate the time evolution of TWC (blue line) and MMDeq(black line) for selected flight
sequences of flights 13 and 16, respectively, near the2408C level for both flights. In addition to MMDeq
and in order to investigate the relative contribu-tion of the smallest and largest ice crystals to the
FIG. 2. (top) The 0000 UTC analysis chart (issued by BoM) for (left) flight 13 and (right) flight 16. (middle) MTSAT image brightness temperature of the sampled cells overlaid onto the Falcon 20 flight track [courtesy of NASA Langley Research Center (LaRC)]. The flight track is color coded for flight time. (bottom) Time series of temperature (K) in black and 5-s TWC measurements from the IKP2 in blue. Dashed–dotted blue lines indicated the 1.5 g m23threshold.
hydrometeor mass, the Deq crystal diameters
corre-sponding to the 15th and 85th percentiles of the total water content (denoted 15%MDeq and 85%MDeq,
respectively) have been computed and are displ-ayed in both figures. The resulting gray shaded areas delineating the size range of particles between 15%MDeqand 85%MDeqthus account for 70% of the
total mass.
For both flights, two regions of sustained TWC larger than 1.5 g m23are highlighted by red rectangles.
Comparing Figs. 3 and 4, we can see that areas of sustained high TWC (all ice) beyond 1.5 g m23 are longer lasting for flight 16 (roughly 5 min, or approx-imately 55 km) than for flight 13 (roughly 3 min, or 35 km).
For flight 13 (cf. Fig. 3), MMDeq, 15%MDeq, and
85%MDeqall increase when entering a high IWC area
relative to the surrounding lower IWC areas. While typical MMDeq values are between 300 and 500mm
outside the high IWC regions, they increase to roughly
FIG. 3. Example of high IWC areas (red boxes) sampled during flight 13 close to2378C. The blue line represents the time evolution of the TWC measured with the IKP2. The MMDeq
values appear as a black line, and the gray area spans between the 15% and 85%MDeq.
FIG. 4. Example of high IWC areas (red boxes) sampled during flight 16 close to2378C. The blue line represents the time evolution of the TWC measured with the IKP2. The MMDeq
500–700mm inside. In contrast, during flight 16 (cf.
Fig. 4) within a more classical oceanic MCS, MMDeq
values are mostly greater than 500mm outside the high IWC areas and clearly decrease to less than 500mm when TWC exceeds 1.5 g m23. Moreover, the span be-tween 15% MDeq and 85%MDeq is significantly
re-duced, with a large decrease in 85%MDeqfrom greater
than 1–1.5 mm outside to roughly 700mm inside the high IWC area. Overall, high IWC areas sampled during flights 13 and 16 have clearly different micro-physical characteristics relative to their surrounding areas. These two example flights exhibit opposite be-havior of crystal sizes decreasing with increasing TWC for flight 16, while increasing for flight 13.
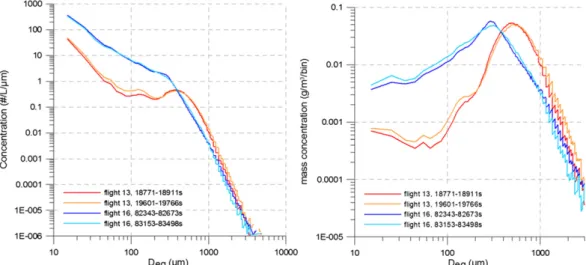
Figure 5shows the mean particle number and mass– size distributions for the four high IWC regions from
Figs. 3and4(red rectangles). Number PSDs and mass– size distributions are colored in blue for flight 16 and in orange/red for flight 13. Concentrations of particles smaller than 300mm are almost one order of magnitude smaller for flight 13 than for flight 16. Consequently, the bin mass concentrations for particles smaller than 300mm are also roughly one order of magnitude smaller. The mass size distribution also show distinct diameter modes centered around 300mm and close to 500 mm for flights 16 and 13, respectively.
This brief analysis of only four high IWC regions from the flight program demonstrates that the micro-physical characteristics of high IWC areas can be quite different from one convective system to another one. Some high IWC regions contain rather small ice crys-tals, whereas others can contain relatively large ones. The next section summarizes the overall HAIC/HIWC dataset in order to produce statistically significant
results on the ice crystal characteristics in high IWC regions with TWC larger than 1.5 g m23.
4. General analysis of high IWC regions a. Median mass diameters
Figure 6displays MMDeqas a function of TWC for
each flight of the Darwin campaign. Data were first sorted into 0.5 g m23TWC bins centered on 0.5, 1, 1.5 g m23, etc., up to 3 g m23. Then for each TWC bin, average MMDeq
and temperature values were computed only if the number of available data points (5-s average) exceeds 20. Calibration flights 1, 5, and 21 were excluded along with transit flight 11, which had a maximum 5-s TWC of only 0.1 g m23 (cf.Table 1). Transit flight 17 produced only one data point in the 0.5 g m23bin.
Flights 13 and 16, detailed in the previous section, ap-pear in black and olive green, respectively.Figure 6 re-veals that the large majority of flights follow a trend similar to flight 16: averaged MMDs tend to slightly de-crease with increasing TWC. For TWC larger than 1.75 g m23(i.e., TWC classes centered on 2 and 2.5 g m23) mean MMDeqvalues range between 325 and 475mm for
most flights, and only flights 12 and 13 contain signifi-cantly higher mean MMDeq values exceeding 600mm.
Flight 12, performed in the same MCS as flight 13, shows the same trend of increasing mean MMDeq with
in-creasing TWC. This convective storm, sampled twice during flights 12 and 13, clearly reveals different micro-physical characteristics relative to almost all other flights. If we temporarily exclude flights 12 and 13, then a temperature dependency of the MMDeqvalues is visible
inFig. 6. Samples at a mean temperature between2358C and 2458C in dark blue are associated with smaller
FIG. 5. (left) Mean particle number and (right) mass–size distributions for the high IWC areas of flight 13 (orange/red) and flight 16 (blue) defined inFigs. 3and4.
MMDeqvalues: flights 2, 8, and 14, providing
measure-ments at a mean temperature colder than 2358C, are associated with average MMDeq values lower than
450mm. In the temperature range of 2358 to 2258C, MMDeqvalues tend to increase with increasing
temper-ature, and are in the range of 400–750mm for TWC values in the 2.5 and 0.5 g m23bins. Data points at temperatures warmer than2258C are associated with MMDeqvalues
larger than 550mm. Flight 23, which is the only flight providing data close to the 2108C level (cf. Table 1), reveals the largest MMD values for all TWC ranges (excluding flights 12 and 13). Thus, for most of the dataset, the general trend is that smaller MMDeqvalues are
as-sociated with colder temperatures. b. 15th and 85th percentiles
To identify the range of sizes that contributes most to the total mass, in Fig. 7 the 15%MDeq (top) and
85%MDeq(bottom) are added. One major result from
Fig. 7(top) is that for all data points with TWC exceeding 1.5 g m23, the corresponding 15th percentile mass di-ameter (15%MDeq) is always larger than 100mm. In
other words, the contribution of ice crystals smaller than 100mm to the total ice mass is less than 15%, even for high IWC values beyond 2 g m23.
Considering the flights collectively, 15%MDeqranges
between 100 and 450mm, whereas 85%MDeq is more
widely spread with values spanning from 600mm to 2 mm. For the majority of the flights (excluding the black lines of flights 12 and 13),Fig. 7reveals that both 15%MDeqand
85%MDeq slightly decreases with increasing TWC,
indicating a progressively larger contribution of small ice crystals to IWC with increasing IWC. The figure also reveals a narrowing of the range of sizes comprising the mass with increasing IWC. For example, for a TWC close to 1 g m23, 15%MDeqand 85%MDeqspan between
ap-proximately 150–400mm and 650 mm–2 mm, respectively, whereas the corresponding spans at 2 g m23are approx-imately 175–275mm and 600 mm–1.2 mm, respectively.
In addition, the temperature (altitude) sensitivity of the mass distribution in the smaller crystal sizes is noticeable in the 15%MDeqplot (top). As inFig. 6, and again excluding
flights 12 and 13, blue points correspond to the coldest temperatures and are associated with the smallest 15%MDeqvalues, whereas the largest 15%MDeq values
are associated with the orange and red colors, correspond-ing to temperatures warmer than2258C. The correlation of the 85%MDeq with temperature is less clear: the largest values are still obtained for the2108C temperature range; however, the smallest values appear to be most frequently at temperatures close to either2308 or 2408C.
Finally,Fig. 7confirms the quite different nature of flights 12 and 13. For these two flights, the behavior of both the 15%MDeqand 85%MDeqas a function of TWC
follows the opposite trend, with increasing 15%MDeq
and 85%MDeqas TWC increases.
c. Discussion
1) MCSOF FLIGHTS12AND13
The MCS sampled twice on the same local day be-tween 2 and 3 February (during flights 12 and 13) shows
FIG. 6. Mean MMD as a function of TWC measured by the IKP2. Color lines and types (continuous and dashed) correspond to individual flights of the Darwin campaign. Symbols are colored according to the mean temperature of the respective measurements (with blue cor-responding to cold temperatures and red to warmer ones).
different ice particle microphysical properties relative to all the other MCS sampled during the first HAIC/HIWC field campaign, in spite of the fact that the large-scale synoptic conditions described insection 3awere similar. Indeed, as was shown for flights 12 and 13:
d The MCSs of flights 7 and 8 developed during MJO
phase 7 (seeFig. 1).
d The MCS of flight 16 MCS was also associated with a
low pressure system.
d Finally, the MCSs sampled during flights 6 and 8 also
developed in the Joseph Bonaparte Gulf.
As mentioned earlier insection 3a, one feature spe-cific to the MCSs of flights 12 and 13 is time duration. As reported in the mission day’s summaries and according
to satellite images, a significant reintensification oc-curred after flight 12, leading to the subsequent launch of flight 13. This is the only case in the Darwin campaign with sufficient daytime duration to permit two distinct flights in the same MCS.
Concerning the MCS microphysics,Fig. 8illustrates 2D-S images of particles larger than 300mm. Most of these particles are clearly elongated, resembling large columnar crystals and capped columns. Images showing aggregates of pristine ice particles are rare. Also images of quasi-round particles are observed, bearing in mind that 2D projections of capped columns and large col-umns may result in such images. These dominant pris-tine shapes clearly illustrate that vapor deposition is the dominant growth mechanism of these crystals.
FIG. 7. Mean (top) 15%MDeqand (bottom) 85%MDeq(mm) as a function of TWC (from
IKP2). The color code for symbols indicates the temperature: lower temperatures are in blue, and higher temperatures appear in red/orange, whereas the color code for lines refers to in-dividual flights.
Analysis of the onboard Radar System Airborne (RASTA) cloud research radar (Protat et al. 2016) has revealed that high IWC regions are mostly found in and near convective cells. In the early stage of convection, ice crystals are created and subsequently start to grow. In highly supersaturated environments, nucleation (in-cluding secondary ice production) may produce high concentrations of small particles in these high IWC convective cells, helping to explain the MMD decrease with increasing IWC that is observed for most of the flights. Then, if convection regenerates, or is maintained over longer time periods in the cloud system, such as postulated for flights 12 and 13, ice crystals that were formed during the initial stage may be lifted up by the new updraft and continue to grow by vapor deposition. An alternate possibility is that convection was less vig-orous in flight 13, allowing ice crystals that were formed close to2108C to stay longer at low levels and grow to larger sizes before being lifted to higher altitude. One may also speculate that aerosol loading might be dif-ferent, as some aerosols have been scavenged by pre-cipitation, possibly changing the number of ice nuclei (IN) available for nucleation, and thus the number and size of the ice crystal population. Thus, our main hy-pothesis to explain the increase of MMD with TWC is that this is a consequence of a longer-lasting growth of ice crystals by vapor deposition.
To summarize, flight-to-flight differences in the trends of ice crystal population MMDs in high IWC conditions at cold temperatures are potentially caused by different dynamical and microphysical histories of the sampled MCSs. Ice crystal MMDs decreasing with TWC could be very much related to updrafts with high vertical velocity and high supersaturation with respect to ice, whereas MMDs increasing with TWC could result from less in-tense updrafts that favor growth to larger sizes of ice crystals created at lower levels (e.g., close to 2108C). Formation of fewer and thus larger new ice crystals might also be postulated later in the life cycle of a storm, if fewer IN are present, possibly due to scavenging by precipitation during a previous convective cycle. Cloud simulations with detailed microphysics models studying the histories of the ice crystals in high IWC regions may provide the best means in which to understand the dif-ferences of flights 12 and 13 MMDs versus the other flights.
2) LINKS BETWEEN THE15%MD, 85%MD,AND THEMMD
Before the HAIC/HIWC campaign, there have been few reports in the literature describing the microphysical in situ properties of high IWC areas of cloud. The results of this study come from a large and unique dataset fo-cused on sampling as close as possible to such areas in
FIG. 8. Examples of 2D-S images collected in the two high IWC areas of flight 13 fromFig. 3. A random selection was performed among only the complete and valid images (shattering and splashing artifacts removed) of particles with sizes larger than 300mm.
deep convection. A statistical analysis of the median mass diameters of ice crystals in clouds is rather un-common in the literature. However,Heymsfield (2003, hereafterH03) presented a study where MMD values were deduced from a dataset of airborne OAP mea-surements, with some flights performed in anvils and stratiform regions of tropical convection, and other flights in synoptically generated cloud layers and cirrus.
H03(p. 2577) used the ‘‘diameter of a circle that com-pletely encloses the two-dimensional image of each particle’’ to characterize the size of the particle and found that the corresponding MMD values range from 100mm to values as large as 4 mm. The corresponding range of MMDeq for the HAIC/HIWC dataset, for
TWCs larger than 0.1 g m23and using the Deqsize
def-inition, is from 100mm up to 2.7 mm.
Comparing our results to those ofH03is not perfectly straightforward, as there are noticeable differences in both the OAP data processing and the MMD computa-tion. Concerning theH03PSD retrieval, the 2D probes were not equipped with antishattering tips, no filtering of the shattering artifacts was applied, and the treatment of out-of-focus particles was not detailed. Furthermore,H03
computed the ice mass using constant values for thea and
b parameters of the mass–size relationship m 5 aDb
and a ‘‘maximum’’ diameter to define the particle size.
Leroy et al. (2016)studied the MMD sensitivity with re-spect to the prefactor a, the exponent b, and also the particle size definition itself. That study demonstrated that different assumed values of b and different size definitions could lead to significant changes in the com-puted MMD values. Since in this study we are calculating time-dependent values forb, taking into account the ice crystal morphology, and since we are using the 2D area-equivalent diameter, our MMDeq values are therefore
not directly comparable to those ofH03. We can simply note that each study reveals a similar range of MMD values from 100mm up to a few millimeters in MMD.
However,H03also found that the 15%MD and 85%MD could be estimated from linear calculations of ap-proximately 0.5 and 1.5 times the MMD value, re-spectively. A similar analysis of this HAIC/HIWC dataset is summarized inFig. 9and Table 2for com-parison. Black lines inFig. 9represent 0.5 and 1.5 times the MMDeq. All data points are color coded according
to temperature and flights 12 and 13 are highlighted by using circular points with a gray perimeter, while all other flights are depicted using ‘‘x’’ and ‘‘1’’ symbols for
FIG. 9. The 15%MDeq(1) and 85%MDeq(x) as a function of MMDeq. The color code indicates different
temperatures with blue for colder conditions and orange and red for warmer conditions. (left) Includes all data points with TWC values (from the IKP2) larger than 0.1 g m23, whereas (right) contains only data points with TWC larger than 1.5 g m23. Results from flights 12 and 13 are circular symbols with a gray perimeter. The black lines represent relations of y5 0.5MMDeqand y5 1.5MMDeq, in order to compare withH03(cf.section 4c).
15%MDeq and 85%MDeq respectively. The left panel
includes all data points with TWC larger than 0.1 g m23, whereas the right panel is limited to data from high IWC regions with TWC values exceeding 1.5 g m23.
For the HAIC/HIWC dataset, the 15%MDeqvalues are
distributed along the 0.5MMDeqline. The best-fit analyses
for TWC thresholds of 0.1 and 1.5 g m23 (left and right panels, respectively) yield slopes of 0.44 and 0.56, re-spectively, and coefficients of determination (r2) of 0.92 and 0.97, respectively (cf. Table 2), whereas the H03
0.5MMDeqfit passing through the origin would have given
r2 values of 0.92 and 0.94, respectively. Thus, the H03
0.5MMDeq line seems to be a reasonable proxy for the
15%MDeq.Figure 9tends to show that this would lead to
an overestimation of the 15%MDeq for large MMDeq
when applying the fit to the 0.1 g m23 TWC threshold dataset.
For the 85%MDeq, the 1.5MMDeqline inFig. 9seems
to represent only an approximation of the lower limit of the 85%MDeq for MMDeq below 1 mm. Then, for
MMDeqgreater than 1 mm, the 1.5MMDeq line clearly
underestimates even the lower limit of the 85%MDeq.
These 85%MDeq results apply to the high IWC cloud
regions (TWC. 1.5 g m23) as well as to the whole HAIC/ HIWC dataset (TWC. 0.1 g m23). The best fit of the 85%MDeqdata for thresholds of 0.1 and 1.5 g m23yields
slopes of 2.1 and 2.0, respectively, and r2values of 0.94 and 0.91 (cf. Table 2) respectively, whereas the H03
1.5MMDeq fit would result in r2values lower than 0.8.
But, as previously mentioned, in the HAIC/HIWC dataset the 85%MDeqvalues are relatively for an average
15%MDeqand for a lower limit of the 85%MDeq, both of
which are most applicable for MMDeqlower than 1 mm
and for all cloud regions, including high IWC areas. However, overall, a relationship of 2MMDeqbetter
esti-mates the 85%MDeqfor all ranges of MMDeqand TWC.
5. Conclusions
The first HAIC/HIWC field campaign out of Darwin, Australia, provided a unique opportunity to collect
reliable microphysical data in high ice water content regions in tropical, mostly oceanic, mesoscale convec-tive systems. The total water content measured by the IKP2 provided reference measurements, particularly for higher TWC and at high altitudes, where other technologies are known to saturate, operate outside of their calibrated range, or have larger uncertainties due to collection efficiency or other shortcomings. Air-borne OAP recordings of individual ice crystal images provided detailed information on the hydrometeors in cloud. A careful analysis of the 2D-S and PIP OAP images provided composite PSDs as a function of time, from which MMDs were inferred. The analysis yielded the following series of common findings for high IWC cloud areas in most (excluding outlier flights 12 and 13) of the sampled MCSs:
d In high IWC areas, most of the 5-s (;1 km) median
mass diameter MMDeqvalues range between 250 and
500mm between 2258 and 2558C.
d MMDeq decreases with (i) decreasing temperatures
and (ii) increasing TWC, indicating a progressive increase in the contribution of smaller ice crystals below 500mm to TWC.
d Ice crystals smaller than 100mm typically account for
less than 15% of the total mass.
d The fraction of the mass contributed by large ice
crystals is more variable. The relationship 1.5MMDeq
gives roughly the lower limit of the observed 85%MDeq
when MMDeqis lower than 1 mm. For example, for an
MMDeqvalue of 400mm, the minimum 85%MDeqis
close to 600mm but maximum values were observed as large as 2 mm.
d When MMDeq is less than 1 mm, 0.5MMDeq is
generally a good proxy for the estimation of the 15%MDeq, both in high IWC areas and also outside
these areas. When MMDeq is greater than 1 mm,
0.5MMDeq overestimates the observed 15%MDeq
values outside the high IWC areas.
d The 2MMDeqis a better proxy for the 85%MDeqthan
the 1.5MMDeq proposed by H03. The 1.5MMDeq
estimate will provide the lower limit of the values of the 85%MDeq.
These findings, using data from research flights tar-geting high IWC clouds, tend to support the idea that in most cases ice crystals in high IWC areas of MCS-type young convection are significantly smaller than in other parts of the cloud, and that this effect is amplified with decreasing temperature. However, flights 12 and 13 yielded quite different results. Most of the Darwin flights were made in classical early morning oceanic MCSs with a life cycle from initial growth to decay on the order of 6–12 h.
TABLE2. Characteristics of the fits through the origin for esti-mating the 15%MDeqand 85%MDeqfrom the MMDeq. Best fits
for the HAIC/HIWC dataset are compared with the slope given by
H03for two IKP2 TWC thresholds.
TWC. 0.1 g m23
TWC. 1.5 g m23 Slope R2 Slope R2
15%MDeq HAIC/HIWC fit 0.44 0.92 0.56 0.97 Slope fromH03 0.5 0.92 0.5 0.94 85%MDeq HAIC/HIWC fit 2.1 0.94 2.0 0.91 Slope fromH03 1.5 0.77 1.5 0.80
Flights 12 and 13 were the only flights to be performed in the same long-lasting quasi-stationary system, a tropical storm, and for these two flights, the concentra-tions of large ice particles were found to be higher than in all other clouds sampled at the same temperature level. MMDs mostly exceed 500mm and even reached 2 mm. Moreover, in these flights MMD tended to in-crease with increasing TWC, the opposite trend found for the classical shorter-lived oceanic MCS. In spite of the larger MMDs observed, the pilot’s X-band radar (not shown here) indicated that reflectivity at flight level remained relatively low (green echoes or no echoes), not reaching a level of 30 dBZ that would typically result in a cautionary course change for avoidance. Thus, the data from these flights are still consistent with the scenario of high IWC/low radar reflectivity hypothesized byMason et al. (2006) to be conducive to engine power-loss events. Unfortunately, these interesting and opposite MMD trends are based on only two flights, and it is hoped that further measurements of this type will be
collected in future high IWC–dedicated field campaigns to statistically extend the present findings.
Flights 12 and 13 therefore suggest that different mechanisms could lead to the formation of high IWC areas. Our current hypothesis is that in strong updrafts with high supersaturation with respect to ice, nucleation processes will create large amounts of small ice, which could explain the trend of decreasing MMD with in-creasing TWC observed for most flights. In contrast, in weak but long-lasting updrafts with possibly lower su-persaturation, growth of larger ice crystals, nucleated close to 2108C, could be favored due to the longer available growth times, leading this time to an increase of the MMD with increasing TWC as observed for flights 12 and 13. Model simulations with detailed microphysics are needed to better understand different possible mechanisms of forming high IWC areas in tropical MCS. Acknowledgments. The authors acknowledge R. Potts and the Bureau of Meteorology for providing general
FIG. A1. Example of instrumental responses to supercooled liquid water droplets. (left) The number concentration as a function of time and particle size for the (top) 2D-S probe and (middle) CDP-2 probe. (bottom left) Time series of the MVD (blue, right axis) and the total concentration (black line, left axis) deduced from the CDP-2 concentrations. (right) The (top) mean particle spectrum for the 2D-S (black) and the CDP-2 (red) for the studied period. (middle) Time series of TWC measured from the IKP2 and hypothetical LWC deduced from CDP-2, and (bottom) vertical wind velocity and RICE probe raw frequency.
meteorological products used for this article. The au-thors greatly appreciate the provision of rapid-scan visible and infrared MTSAT-1R geostationary satellite data by the Japan Meteorological Agency through an agreement with the Bureau of Meteorology, and the processing and distributing of that data by the bureau under the direction of R. Potts. The authors also ac-knowledge L. Nguyen, P. Minnis, and the NASA Langley Research Center team for further postprocessing of the satellites’ images.
The research leading to these results has received funding from (i) the European Union’s Seventh Frame-work Programme in research, technological development, and demonstration under Grant Agreement ACP2-GA-2012-314314; (ii) the European Aviation Safety Agency (EASA) Research Program under Service Contract EASA.2013.FC27; and (iii) the Federal Aviation Admin-istration (FAA)’s Aviation Research Division and Avia-tion Weather Division under Agreement CON-I-1301 with the Centre National de la Recherche Scientifique. Funding to support the Darwin flight project was also provided by the NASA Aviation Safety Program, the Boeing Co., and Transport Canada. Additional support was also provided
by Airbus Operations SAS, Science Engineering Associ-ates, the Bureau of Meteorology, Environment and Cli-mate Change Canada, the National Research Council of Canada, the University of Utah, and the National Science Foundation under Grant AGS 12-13311.
APPENDIX
Identification of Supercooled Liquid Water Droplets in the Dataset
As mentioned insection 2b(2), the occurrence of su-percooled liquid water has been studied by combining the measurements from the CDP-2, 2D-S, and RICE instruments. Solely cases with CDP-2 concentration exceeding 10 cm23were examined.Figures A1andA2
present two examples from the HAIC/HIWC dataset illustrating the response of the different probes in liquid and glaciated conditions. For both figures, graphs are showing number concentrations as a function of time and size for the 2D-S (top left) and the CDP-2 (middle left), time series of the mean volume diameter (MVD) and total concentrations measured by the CDP-2
(bottom left), mean 2D-S and CDP-2 particle size dis-tributions (top right) for the respective data, time series of TWC from the IKP together with LWC estimated from CDP-2 (middle right), and vertical wind velocity with RICE (icing detector) probe raw frequency (bottom right).
In Fig. A1, the CDP-2 total concentration reaches values up to 50 cm23. Moreover, CDP-2 particle size distributions indicate that most of the particles are smaller than 30mm. Similarly, the 2D-S measured only particles in the five first bins, from 10 to 50mm. TWC from the IKP2 is low and of the same order of magnitude as the LWC estimated from the CDP-2 measurements. Finally, the frequency of the RICE probe is slightly changing, thus indicating ice accretion. Combining all this information leads to the conclusion that super-cooled liquid water has been encountered during this flight sequence of flight 3 performed at a mean tem-perature of 229.28C. Therefore, this period has been removed from the analysis presented here.
InFig. A2, the CDP-2 concentration slightly exceeds 10 cm23; however, particle sizes encompass the whole size range of the probe. Furthermore, the CDP-2 PSD is flat and the 2DS PSD confirms the presence of ice crystals at larger sizes. TWC from the IKP2 is more than an order of magnitude higher than the hypothetical LWC integrated from the CDP size spectra and also the RICE frequency stays almost constant. This behavior of the CDP-2 is a false response to ice crystals at negative temperatures (237.38C forFig. A2).
Regarding the four periods selected insection 2b(2), the CDP-2 total concentration does not exceed 2 cm23 during the two high IWC areas selected in flight 13. For flight 16, total CDP concentration slightly exceeds 10 cm23for both selected high IWC periods and indeed
Fig. A2corresponds to the second high IWC period of flight 16. The above-mentioned discussion of the graphs presented inFig. A2led to the conclusion that solely ice crystals were encountered during this period of flight. The first high IWC period of flight 16 presented in
section 2b(2) is very similar toFig. A2, thus also vali-dating the absence of supercooled liquid water droplets during this period of flight.
REFERENCES
Baker, B., Q. Mo, R. P. Lawson, D. O’Connor, and A. Korolev, 2009: The effects of precipitation on cloud droplet measure-ment devices. J. Atmos. Oceanic Technol., 26, 1404–1409, doi:10.1175/2009JTECHA1191.1.
Baumgardner, D., and A. Rodi, 1989: Laboratory and wind tunnel evaluations of the Rosemount Icing Detector. J. Atmos. Oceanic Technol., 6, 971–979, doi:10.1175/1520-0426(1989)006,0971: LAWTEO.2.0.CO;2.
——, and Coauthors, 2011: Airborne instruments to measure at-mospheric aerosol particles, clouds and radiation: A cook’s tour of mature and emerging technology. Atmos. Res., 102, 10– 29, doi:10.1016/j.atmosres.2011.06.021.
Bouniol, D., J. Delanoë, C. Duroure, A. Protat, V. Giraud, and G. Penide, 2010: Microphysical characterisation of West Af-rican MCS anvils. Quart. J. Roy. Meteor. Soc., 136, 323–344, doi:10.1002/qj.557.
Brenguier, J.-L., and Coauthors, 2013: In Situ measurements of cloud and precipitation particles. Airborne Measurements for Environmental Research: Methods and Instruments, M. Wendish and J.-L. Brenguier, Eds., Wiley Series in Atmospheric Physics and Remote Sensing, Wiley-VCH, 225–302.
Brown, P. R. A., and P. N. Francis, 1995: Improved measure-ments of the ice water content in cirrus using a total-water probe. J. Atmos. Oceanic Technol., 12, 410–414, doi:10.1175/ 1520-0426(1995)012,0410:IMOTIW.2.0.CO;2.
Claffey, K. J., K. F. Jones, and C. C. Ryerson, 1995: Use and cali-bration of Rosemount ice detectors for meteorological research. Atmos. Res., 36, 277–286, doi:10.1016/0169-8095(94)00042-C. Cober, S. G., G. A. Isaac, and A. V. Korolev, 2001: Assessing the
Rosemount Icing Detector with in situ measurements. J. Atmos. Oceanic Technol., 18, 515–528, doi:10.1175/ 1520-0426(2001)018,0515:ATRIDW.2.0.CO;2.
Cotton, R. J., and Coauthors, 2013: The effective density of small ice particles obtained from in situ aircraft observations of mid-latitude cirrus. Quart. J. Roy. Meteor. Soc., 139, 1923–1934, doi:10.1002/qj.2058.
Davison, C. R., J. MacLeod, J. Strapp, and D. Buttsworth, 2008: Isokinetic total water content probe in a naturally aspirating configuration: Initial aerodynamic design and testing. Proc. 46th AIAA Aerospace Sciences Meeting and Exhibit, Reno, NV, American Institute of Aeronautics and Astronautics, AIAA-2008-435. [Available online athttp://arc.aiaa.org/doi/ abs/10.2514/6.2008-435.]
——, J. W. Strapp, L. E. Lilie, T. P. Ratvasky, and C. Dumont, 2016: Isokinetic TWC evaporator probe: Calculations and systemic error analysis. Eighth AIAA Atmospheric and Space Environments Conf., Washington, DC, American Institute of Aeronautics and Astronautics, AIAA-2016-4060. [Available online athttp://arc.aiaa.org/doi/10.2514/6.2016-4060.] Dezitter, F., A. Grandin, J.-L. Brenguier, F. Hervy, H. Schlager,
P. Villedieu, and G. Zalamansky, 2013: HAIC (High altitude ice crystals). Proc. Fifth AIAA Atmospheric and Space Envi-ronments Conf., San Diego, CA, American Institute of Aeronautics and Astronautics, AIAA-2013-2674. [Available online athttp://arc.aiaa.org/doi/abs/10.2514/6.2013-2674.] Diao, M., M. A. Zondlo, A. J. Heymsfield, S. P. Beaton, and D. C.
Rogers, 2013: Evolution of ice crystal regions on the micro-scale based on in situ observations. Geophys. Res. Lett., 40, 3473–3478, doi:10.1002/grl.50665.
——, J. B. Jensen, L. L. Pan, C. R. Homeyer, S. Honomichl, J. F. Bresch, and A. Bansemer, 2015: Distributions of ice su-persaturation and ice crystals from airborne observations in relation to upper tropospheric dynamical boundaries. J. Geophys. Res. Atmos., 120, 5101–5121, doi:10.1002/ 2015JD023139.
DMT, 2009: Single particle imaging. Data analysis user’s guide, DOC-0223, Rev. A, 34 pp.
Erfani, E., and D. L. Mitchell, 2016: Developing and bounding ice particle mass- and area-dimension expressions for use in atmospheric models and remote sensing. Atmos. Chem. Phys., 16, 4379–4400, doi:10.5194/acp-16-4379-2016.
Field, P. R., A. J. Heymsfield, and A. Bansemer, 2006: Shattering and particle interarrival times measured by optical array probes in ice clouds. J. Atmos. Oceanic Technol., 23, 1357– 1371, doi:10.1175/JTECH1922.1.
Fontaine, E., A. Schwarzenboeck, J. Delanoë, W. Wobrock, D. Leroy, R. Dupuy, C. Gourbeyre, and A. Protat, 2014: Constraining mass–diameter relations from hydrometeor im-ages and cloud radar reflectivities in tropical continental and oceanic convective anvils. Atmos. Chem. Phys., 14, 11 367– 11 392, doi:10.5194/acp-14-11367-2014.
Grandin, A., J.-M. Merle, M. Weber, J. Strapp, A. Protat, and P. King, 2014: AIRBUS flight tests in high total water content regions. Proc. Sixth AIAA Atmospheric and Space Environ-ments Conf., Atlanta, GA, American Institute of Aeronautics and Astronautics, AIAA-2014-2753. [Available online at
http://arc.aiaa.org/doi/abs/10.2514/6.2014-2753.]
Heymsfield, A. J., 2003: Properties of tropical and midlatitude ice cloud particle ensembles. Part I: Median mass diameters and terminal velocities. J. Atmos. Sci., 60, 2573–2591, doi:10.1175/ 1520-0469(2003)060,2573:POTAMI.2.0.CO;2.
——, and J. L. Parrish, 1978: A computational technique for increasing the effective sampling volume of the PMS two-dimensional particle size spectrometer. J. Appl. Meteor., 17, 1566–1572, doi:10.1175/1520-0450(1978)017,1566: ACTFIT.2.0.CO;2.
——, and L. M. Miloshevich, 1993: Homogeneous ice nucleation and supercooled liquid water in orographic wave clouds. J. Atmos. Sci., 50, 2335–2353, doi:10.1175/1520-0469(1993)050,2335: HINASL.2.0.CO;2.
——, A. Bansemer, P. R. Field, S. L. Durden, J. L. Stith, J. E. Dye, W. Hall, and C. A. Grainger, 2002: Observations and parameterizations of particle size distributions in deep tropical cirrus and stratiform precipitating clouds: Results from in situ observations in TRMM field campaigns. J. Atmos. Sci., 59, 3457–3491, doi:10.1175/1520-0469(2002)059,3457: OAPOPS.2.0.CO;2.
——, ——, C. Schmitt, C. Twohy, and M. R. Poellot, 2004: Effec-tive ice particle densities derived from aircraft data. J. Atmos. Sci., 61, 982–1003, doi:10.1175/1520-0469(2004)061,0982: EIPDDF.2.0.CO;2.
——, L. M. Miloshevich, C. Schmitt, A. Bansemer, C. Twohy, M. R. Poellot, A. Fridlind, and H. Gerber, 2005: Homogeneous ice nucleation in subtropical and tropical convection and its in-fluence on cirrus anvil microphysics. J. Atmos. Sci., 62, 41–64, doi:10.1175/JAS-3360.1.
——, C. Schmitt, A. Bansemer, and C. H. Twohy, 2010: Improved representation of ice particle masses based on observations in natural clouds. J. Atmos. Sci., 67, 3303–3318, doi:10.1175/ 2010JAS3507.1.
——, ——, and ——, 2013: Ice cloud particle size distributions and pressure-dependent terminal velocities from in situ observa-tions at temperatures from 08 to 2868C. J. Atmos. Sci., 70, 4123–4154, doi:10.1175/JAS-D-12-0124.1.
King, W. D., 1986: Air flow and particle trajectories around aircraft fuselages. IV: Orientation of ice crystals. J. Atmos. Oceanic Technol., 3, 433–439, doi:10.1175/1520-0426(1986)003,0433: AFAPTA.2.0.CO;2.
Korolev, A., 2007: Reconstruction of the sizes of spherical particles from their shadow images. Part I: Theoretical considerations. J. Atmos. Oceanic Technol., 24, 376–389, doi:10.1175/JTECH1980.1. ——, and B. Sussman, 2000: A technique for habit classification of
cloud particles. J. Atmos. Oceanic Technol., 17, 1048–1057, doi:10.1175/1520-0426(2000)017,1048:ATFHCO.2.0.CO;2.
——, and G. Isaac, 2003: Roundness and aspect ratio of particles in ice clouds. J. Atmos. Sci., 60, 1795–1808, doi:10.1175/ 1520-0469(2003)060,1795:RAAROP.2.0.CO;2.
——, and P. R. Field, 2015: Assessment of the performance of the inter-arrival time algorithm to identify ice shattering artifacts in cloud particle probe measurements. Atmos. Meas. Tech., 8, 761–777, doi:10.5194/amt-8-761-2015.
——, E. F. Emery, J. W. Strapp, S. G. Cober, and G. A. Isaac, 2013: Quantification of the effects of shattering on airborne ice particle measurements. J. Atmos. Oceanic Technol., 30, 2527– 2553, doi:10.1175/JTECH-D-13-00115.1.
Krämer, M., and Coauthors, 2016: A microphysics guide to cirrus clouds—Part 1: Cirrus types. Atmos. Chem. Phys., 16, 3463– 3483, doi:10.5194/acp-16-3463-2016.
Lance, S., C. A. Brock, D. Rogers, and J. A. Gordon, 2010: Water droplet calibration of the Cloud Droplet Probe (CDP) and in-flight performance in liquid, ice and mixed-phase clouds dur-ing ARCPAC. Atmos. Meas. Tech., 3, 1683–1706, doi:10.5194/ amt-3-1683-2010.
Lawson, R. P., 2011: Effects of ice particles shattering on the 2D-S probe. Atmos. Meas. Tech., 4, 1361–1381, doi:10.5194/ amt-4-1361-2011.
——, L. J. Angus, and A. J. Heymsfield, 1998: Cloud particle measurements in thunderstorm anvils and possible weather threat to aviation. J. Aircr., 35, 113–121, doi:10.2514/2.2268. ——, D. O’Connor, P. Zmarzly, K. Weaver, B. Baker, Q. Mo, and
H. Jonsson, 2006: The 2D-S (stereo) probe: Design and pre-liminary tests of a new airborne, high-speed, high-resolution particle imaging probe. J. Atmos. Oceanic Technol., 23, 1462– 1477, doi:10.1175/JTECH1927.1.
——, E. Jensen, D. L. Mitchell, B. Baker, Q. Mo, and B. Pilson, 2010: Microphysical and radiative properties of tropical clouds investigated in TC4 and NAMMA. J. Geophys. Res., 115, D00J08, doi:10.1029/2009JD013017.
Leroy, D., E. Fontaine, A. Schwarzenboeck, and J. W. Strapp, 2016: Ice crystal sizes in high ice water content clouds. Part I: On the computation of median mass diameters from in situ measurements. J. Atmos. Oceanic Technol., 33, 2461–2476, doi:10.1175/JTECH-D-15-0151.1.
Locatelli, J. D., and P. V. Hobbs, 1974: Fall speeds and masses of solid precipitation particles. J. Geophys. Res., 79, 2185–2197, doi:10.1029/JC079i015p02185.
Madden, R. A., and P. R. Julian, 1972: Description of global-scale circulation cells in the tropics with a 40–50 day period. J. Atmos. Sci., 29, 1109–1123, doi:10.1175/1520-0469(1972)029,1109: DOGSCC.2.0.CO;2.
Mason, J., W. Strapp, and P. Chow, 2006: The ice particle threat to engines in flight. Proc. 44th AIAA Aerospace Sciences Meeting and Exhibit, Reno, NV, American Institute of Aeronautics and Astronautics, AIAA-2006-206. [Available online at doi:10.2514/6.2006-206.]
McFarquhar, G. M., and A. J. Heymsfield, 1996: Microphysical characteristics of three anvils sampled during the Central Equatorial Pacific Experiment. J. Atmos. Sci., 53, 2401–2423, doi:10.1175/1520-0469(1996)053,2401:MCOTAS.2.0.CO;2. ——, M. S. Timlin, R. M. Rauber, B. F. Jewett, J. A. Grim, and D. P.
Jorgensen, 2007: Vertical variability of cloud hydrometeors in the stratiform region of mesoscale convective systems and bow ech-oes. Mon. Wea. Rev., 135, 3405–3428, doi:10.1175/MWR3444.1. Mitchell, D. L., 1996: Use of mass- and area-dimensional
power laws for determining precipitation particle termi-nal velocities. J. Atmos. Sci., 53, 1710–1723, doi:10.1175/ 1520-0469(1996)053,1710:UOMAAD.2.0.CO;2.