HAL Id: hal-00811846
https://hal.archives-ouvertes.fr/hal-00811846
Submitted on 25 Jan 2021
HAL is a multi-disciplinary open access
archive for the deposit and dissemination of
sci-entific research documents, whether they are
pub-lished or not. The documents may come from
teaching and research institutions in France or
abroad, or from public or private research centers.
L’archive ouverte pluridisciplinaire HAL, est
destinée au dépôt et à la diffusion de documents
scientifiques de niveau recherche, publiés ou non,
émanant des établissements d’enseignement et de
recherche français ou étrangers, des laboratoires
publics ou privés.
Analysis of direct comparison of cloud top temperature
and infrared split window signature Against
independent retrievals of cloud thermodynamic phase
Vincent Giraud, O. Thouron, Jérôme Riédi, Philippe Goloub
To cite this version:
Vincent Giraud, O. Thouron, Jérôme Riédi, Philippe Goloub. Analysis of direct comparison of cloud
top temperature and infrared split window signature Against independent retrievals of cloud
thermo-dynamic phase. Geophysical Research Letters, American Geophysical Union, 2001, 28 (6), pp.983-986.
�10.1029/2000GL012046�. �hal-00811846�
Analysis of direct comparison of cloud top temperature
and infrared split window signature against
independant retrievals of cloud
thermodynamic
phase.
V. Giraud, 0. Thouron, J. Riedi and P. Goloub
Laboratoire d'Optique Atmosph6rique, Universit6 des Sciences et Technologies de Lille, France
Abstract. An accurate determination of cloud particle
phase is required for retrieval of other cloud properties. The main purpose of this letter is to demonstrate that the cloud phase assumption made in previous cirrus clouds re- trievals using infrared split window signatures is not rel-
evant. Coincident observations of the Earth surface from
ERS-2 and ADEOS-1 satellites give us the opportunity to
compare clouds infrared signatures, as observed by ATSR-2
onboard ERS-2, with cloud thermodynamic phase derived
from POLDER onboard ADEOS-1. We find out, firstly,
that large Brightness
Temperature
Differences
(BTD), esti-
mated between 11 and 12 /•m, may occured for cold liquid
water clouds consisting
of small supercooled
droplets (i.e.
altostratus). These BTDs have no longer been attributed to
cirrus clouds as previous studies have been. Secondly, the probability to observe ice or water clouds with respect to their cloud top temperature is quantified for our data set. A sharp transition between the ice and water phase is shown for cloud top temperatures ranging between 240 and 260 K. The probability for a cloud to be composed of super-cooled liquid droplets is shown to be higher over land than over ocean. This points out that ice activation susceptibility is
more efficient in maritime air mass than in continental one.
Introduction
The retrieval of global cloud properties depends on accu- rate interpretation of satellite radiometric data. During the last 15 years, intensive research for determining cirrus clouds effective microphysical properties from multispectral satel-
lite imagery has been performed
[Inoue, T., 1985], [Minnis
eta/, 1993], [Giraud et al, 1997], [Chung
eta/, 2000]. These
retrievals are commonly based on the significant wavelength
dependency
of cloud absorption
in the infrared window (10-
12 /•m). Nevertheless,
the main weakness
of actual meth-
ods is the assumption made upon cloud phase. For satellite retrievals, cloud particles phase discrimination is quite de- terminant since the optical properties of liquid particle and solid ones are distinct. This is mainly due to the impact of particle's shape as well as differences in ice and liquid wa- ter refractive indices which both strongly influence radiation absorption and scattering.
The purpose of this paper is to discuss cloud top temper-
atures and infrared signatures, as observed with ATSR-2,
Copyright 2001 by the American Geophysical Union.
Paper number 2000GL012046. 0094-8276/01/2000GL012046505.00
with respect to their thermodynamic phase as unambigu- ously derived from POLDER. The validity of cloud phase assumption made by considering cloud top temperatures is evaluated, and impact on split window retrievals is inferred.
Data processing
On June 12, 1997, POLDER and ATSR-2 observed the same Earth area within a 10 minute range. This dataset
gives a first opportunity to analyze several cloudy scenes
with independent and complementary satellite measure- ments. The overlap of the swath of the two sensors gives access to about 120 106 km 2 of the Earth.
POLDER has been working for 8 months from Novem- ber 1996 to June 1997. Using the polarization and direc- tionality capabilities, of this pioneer space-borne polarime-
ter, thermodynamic
cloud phase (liquid or ice) can be in-
ferred [Goloub
et al, 2000], [Riedi eta/, 2000]. Operational
POLDER phase product is delivered at a spatial resolution
of 60 km x 60 km [Buriez eta/, 1997]. However,
the Cloud
Top Phase (CTP) retrieval algorithm
can be applied directly
to full resolution data. In the present study, the cloud ther-
modynamic
phase
has been derived at full resolution
(6.2 km
x 6.2 km), which is much more appropriate
for a joint analy-
sis, considering
the ATSR spatial resolution
at nadir (i.e. 1.1
km x 1.1 km). Also, previous
studies have shown the scale
of natural variability of the CTP to be much closer to full POLDER resolution than the operational product actually delivered. This gain in resolution is somehow counterbal-
anced by the fact that thin clouds
(visible optical depth less
than 2.0) or cloud edges
tend to be declared as ice clouds
(regardless
of the actual cloud phase). This problem is more
sensitive at full resolution and appears mainly on the pix- els forming edges of broken liquid clouds. In the following,
ice/liquid clouds
refer to POLDER full resolution
pixels de-
clared as ice/liquid by the POLDER CTP algorithm. Fig-
ure I illustrates the global daily distribution of CTP derived from POLDER on June 12, 1997.
ATSR-2 has two thermal infrared channels centered at
10.8 and 12/•m matching those of AVHRR. Details of the
instrument
may be found in [Mutlow at al, 1998].
The measurements taken by POLDER are relocated on a standard reference grid. This grid is obtained from a si-
nusoidal
projection, whose constant step is 1/18 degrees
in
longitude (i.e. 6, 2 km). ATSR-2 data are projected on
this reference grid. ATSR-2 resolution being 6 times better, ATSR-2 pixel pertaining to the same POLDER pixel are averaged.
In this note, only pixels observed from both POLDER
and ATSR-2 within 4-10 minutes are considered. The cloud
984 GIRAUD ET AL.' CLOUD TOP TEMPERATURE, IR SIGNATURE & THERMODYNAMIC PHASE
LIQUID WATER - ', LOA/CNES/NASD.
Figure 1. POLDER thermodynamic phase index on June 12.
mask,
extensively
discussed
in [Buriez eta/, 1997] and [Parol
et al, 1999], is produced
at full resolution
by POLDER. Re-
gions poleward 60 ø were rejected in our studies to avoid possible problems in cloud detection above sea ice and snowcovered lands.
Analysis
BTD signatures for ice and liquid clouds
Since the imaginary part of the refractive index repre-
sents the absorptive properties of a material, it is clear from
Fig. 2 that both ice and liquid water absorb more infrared radiation at 12/zm than at 11/zm. These differences imply
that semi-transparent clouds are more opaque to telluric ra-
diation at 12/zm, and then explain that BTD could be ob- served between 11 and 12 /zm. Figures 3a, 3b, 3c and 3d show the bispectral radiance scatter plots for the regions
denoted by the boxes A, B, C and D in the image (Fig.
1), where infrared
signatures
are complete
and well defined.
The coldest temperatures corresponding to very low BTDs
are representative of the opaque parts of the clouds. Ac- cording to POLDER cloud detection, warmer temperatures
correspond to clear sky pixels. Intermediate temperatures are associated to more or less semi-transparent clouds. Sig-
natures in Fig. 3a and 3b exhibit very pronounced arches typical of liquid water clouds. The high BTD values can only be explained by the occurrence of small liquid droplets with effective radius less than 5/zm. Ice cloud signatures shown in Fig. 3c and 3d are more scattered and smaller BTDs are reached. Figure 4 presents BTD statistical distribution val- ues for liquid water and ice clouds. This highlights that the strongest BTDs, beyond 6 K, are predominantly associ- ated to semi-transparent water clouds. Cloudy pixels having
their BTD between I and 5 K are equally associated to the
liquid or ice phase. These pictures clearly demonstrate the difficulties in correctly interpreting BTD signatures with- out phase information. Notice that in clear sky conditions,
BTDs are due to water vapor absorption and are limited to
i or 2 K. However, Figure 4 shows high BTD even where no
cloud is detected from POLDER. This makes doubt about
the ability to detect very thin clouds from POLDER, but
has no impact on our analyses.
T. Inoue[1985],
has suggested
that semi-transparent
cir-
rus clouds could be detected from large BTDs. This is clearly in contradiction with our observations which sug- gest that semi-transparent liquid water clouds present largeBTDs, too. Assuming
spherical
particles, Giraud et al [1997]
show that, for overcast pixels, and a fixed optical depth,BTD decreases with the size of the particles and increases with the contrast between the cloud-free and the opaque
cloud brightness temperatures. Complementary simulations demonstrate that BTDs are larger for ice spheres than for
liquid water spheres
for identical cloudy conditions
(i.e. if
only refractive index is changed). Thus, assuming
that cir-
rus microphysics could be described by spherical particles, we may expect a retrieved effective radius for cirrus clouds greater t hah for liquid water clouds.Consi ]ering the above results, some retrievals of cirrus
cloud's, ffective microphysical properties developed by sev- eral au • tors should probably be attributed to liquid clouds.
In par cular, [Giraud et al, 1997] and [Lin and Coaldey,
1993] •und high values of the microphysical
parameter,
whic} :orrespond to small spheres, for cloud warmer than240 Ix. Our results tend to demonstrate that clouds analyzed
in these studies were actually liquid clouds (i.e altostratus
clouds). The surprising
decrease
of effective
radius at tem-
perature larger than 235 K (Fig. s in [Giraud eta/, 1997])
may probably be explained by a change in CTP. The lack ofsmall size particles found by these authors, for temperature
below 235 K, is in agreement with our observations and con-
solidates our assumption that cirrus clouds generally don't
exhibit as high BTDs as expected. Small BTDs observed for ice clouds may be attributed to the effects of particle sizes
as well as particle shapes.
Phase versus Cloud Temperature
In this part, we analyse relation between cloud top phase
derived from POLDER and the cloud top temperature from
ATSR-2 IR channel. Brightness temperature, as derived
from infrared channels, is representative of the cloud top
thermodynamic temperature when the two following condi-
tions are satisfied. First, the influence of the clear atmo-
sphere located above the cloud is negligible. In the infrared window, water vapor is the principal atmospheric gas ab-
sorbent. It is concentrated at low altitude, thus very low
atmospheric absorption occurs above high or middle level clouds. Second, clouds are assumed to be opaque and ra-
diate like blackbody. As mentioned previously, cloudy pix-
els are selected according to POLDER algorithm whereas
10,8
pm 12
pm
, , , , i , , , , , , : : : ; : ,, : ,, , , ,, ,, ,, ; , , ,, ,, ;i , , , , , , , ,
•"' 10 10,5 11 11,5 12 12,5 13
Figure 2. Imaginary part of refractive index for water and ice
from 10 to 13/•m. The two arrows correspond to the two ATSR-2
6. -,? 6 3 ' "" 2 i ! [. 220 240 260 .9.280 300 320 Brigthness temperature at I 1 i. tm (K) 220 240 260 280 300 320 Bngthness temperalure at I I pm (K) 7 7 6 6 • 4 ,c,- • 4 3 .?, ., 3
2'
ß,•', • '
2
' '220 240 260 280 ?g)0 320 Bfig•ss •m•r•ure at 11 gm (K) d •'no 2•0".,60 •' •.80 300Bngthnes.• temperature at I I [am (K)
Figure 3. Examples of bidimentional scatter diagrams as ob-
served with ATSR-2 data from the regions A, B, C and D, re-
spectively (see Fig. 1). CTP information is represented in black
for clear sky, red for liquid clouds and blue for ice clouds.
opaque clouds are selected when BTD is lower than 1 K,
(i.e. emissivity is quite similar to 1 in the two channels).
The presence
of ice particles, within clouds,
increases
as
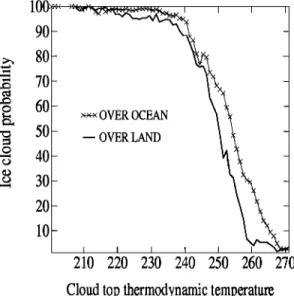
temperature decreases below 273 K, as illustrated in Fig. 5, showing the combined results of POLDER phase and ATSR-2 cloud top temperature retrievals. Distinction be-
tween clouds over land and those over ocean exhibits sev-
eral differences in the probabilities for a cloud to be liquid or ice. Considering a temperature within the range of 220 to 270 K, the probability for a cloud to be composed of ice particles is always smaller over land. In other words, liquid clouds persist at lower temperature over land than over ocean. Over land, clouds having their top tempera-
ture greater than 260 K consist, in great majority (95%),
of super-cooled droplets. Over ocean, at the same temper-
ature, about 30% are ice clouds. Ice and water cloud equal
distributions are reached around 250 K over land, 255 K
over ocean.
In pure cloud droplets or highly diluted deliquescent con- densation nuclei, the spontaneous ice formation is expected to occur over a narrow range of temperatures from about 238
to 235 K [Pruppacher,
H.R., 1995]. Our results show that
below about 240 K there is more than 95% probability thatclouds over the ocean are glaciated. Over land, the same probability is only reached below 230 K. At 240 K, 12% of the cloud over land remain liquid. Based on numerous theoretical studies which explain homogeneous freezing of
haze particles
(e.g., [Sassen
and Dodd, 1988,1989];
[Heyms-
•eZd a•d SabOn,
1989]; [Heyrns•eld
and Miloshevich,
1993];
[Heymsfield
et al, 1995]; [DeMott et al, 1994]; [Jensen
et al,
1994a,b]), we speculate
that freezing
temperatures
may be
lower in continental environments than in maritime ones, as a result of different aerosol mass concentrations. Indeed, more cloud condensation nuclei lead to smaller supercooled droplets and elevation of solute concentrations. The transi-
tion temperatures, at which homogeneous nucleation rapidly
ensues, are depressed for elevated solute concentration or for small haze particles.
For temperatures larger than 240 K, the freezing tem- perature differences between continental and maritime air masses range from 3 K at 245 K to 10 K at 270 K. These differences cannot be explained by a homogeneous freezing processes. For this temperature range, ice appears from het-
erogeneous processes like deposition, condensation freezing,
immersion freezing and contact freezing, which all require
ice nuclei (IN) [Masson,
B.J., 1957]. Surface
physical
and
chemical property requirements, for an aerosol to act as IN, are complex and poorly understood. While the potential impact of heterogeneous ice nuclei in ice formation has been
clearly
stated ([Sassen
and Dodd, 1988];
[Detwiler,
A., 1989];
[Heyms•eld
and Sabin, 1989]; [Heyms•eld and Miloshevich,
1993]; [Heyms•eld
et al, 1995]; [Jensen
et al, 199qa,b]),
ef-
fects on cirrus cloud formation have not been yet clearly un- derstood. Difficulties in studing heterogeneous nucleation processes are probably due to the fact that these processes have not shown themselves to be readily tractable through
the application of classical
theory [Pruppacher
and Klett,
1978]. Several
sources
of IN can be found both over ocean
and over land. For example, sea water rich in plankton and decayed plant leaves contain copious ice nuclei. Our results seem to point out that maritime IN are more efficient than continental ones, probably due to their differences in chemi-
cal and physical
properties,
as suggested
before by [Heyres-
field et al, 1998] during SUCCESS experiments.Result interpretations will remain speculative until ap- propriate new measurements of CN and IN concentration and efficiency to nucleate ice are obtained in the upper tro- posphere.
Conclusions
Two main results have been obtained from the direct
analysis of cloud infrared signatures against their thermo- dynamic phase. Firstly, the higher BTDs were observed for semi-transparent liquid clouds. Cirrus clouds don't exhibit as high BTD values as expected by previous results. Results of many cloud retrievals have to be revised considering that cloud phase assumption is not relevant. Secondly, in conti- nental air mass, the probability that liquid clouds form and maintain at lower temperatures is higher than in maritime air mass. We speculate that in maritime air mass, aerosols
could be activated in warmer conditions than in continental
ones. Of course, this study is limited to a unique day and has to be confirmed and completed with a larger data set Nev-
100% 90% 80% 70% 60% 50% 40% 30% 20% 10% 0%-, 0 1 2 3 4 5 6 7 nTD
Figure 4. Two-dimensional histograms of the frequency of
986
GIRAUD ET AL.' CLOUD TOP TEMPERATURE, IR SIGNATURE & THERMODYNAMIC PHASE
00]
90 70 60 50 40 30 20 10 210 220 230 240 250 260 270Cloud
top
thermodynamic
temperature
Figure 5. Probability of ice being detecting in clouds as a
function of the cloud top temperature, over ocean and land.
ertheless, the analysis presented in this paper clearly shows the potentialities of mixing observations from very comple- mentary satellite measurements. This kind of analysis will be more attractive again from future satellite missions such
as EOS-PM, PICASSO-CENA, PARASOL and CloudSat
which will be in orbit at a coincident time and location in 2003.
Acknowledgments. We thank N. Houghton, from
Rutherford Appleton Laboratory, for making ATSR,-2 data avail- able and F. Hennequart who processed the POLDER, data at LOA. We are also very grateful to Sara Hupp for his helpful com- ments on the manuscript. O. Thouron is supported by a doctoral grant from CNES and the R,•gion Nord-Pas-de-Calais.
References
Buriez J.C, C. Vanbauce, F. Parol, P. Goloub, M. Herman, B. Bonnel, Y Fouquart, P Couvert and G. S•ze, Cloud detection and derivation of cloud properties from POLDER,. Int. J. of Remote Sensing, 18, 2785-2813, 1997.
Chung, S.,S. Ackerman, P.F. van Delst and W.P. Menzel, Model calculations and interferometer measurements of ice cloud characteristics. J. Appl. Meteorol., in press, 2000.
DeMott, P.J., M.P. Meyers and W.R'. Cotton, Numerical model simulations of cirrus clouds including homogeneous and het- erogeneous ice nucleation, J. Atmos. Sci., 51, 77-90, 1994. Detwiler, A., Comments on "Homogeneous nucleation rate of
highly supercooled cirrus cloud droplets' by K. Sassen and G.C. Dodd, J. Atmos, Sci., •6, 2344-2345, 1989.
Goloub P., M. Herman, H. Chepfer, J. R,iedi, G. Brogniez, P. Couvert and G. S•ze, Cloud Thermodynarnical Phase Classifi- cation from the POLDER' Spaceborne intrument, J. Geophys. Res. 105, 14747-14759, 2000.
Heymsfield, A.J. and R,.M. Sabin, Cirrus crystal nucleation by homogeneous freezing of solution droplets, J. Atmos. Sci., •6, 2252-2264, 1989.
Heymsfield, A.J. and L.M. Miloshevich, Homogeneous ice nucle- ation and supercooled liquid water in orographic wave clouds, J. Atmos. Sci., 50, 2335-2353, 1993.
Heymsfield, A.J., L.M. Miloshevich, C. Twohy, G. Sachse and S. Oltmans, Upper tropospheric relative humidity observations and implications for cirrus ice nucleation, J. Atmos. Sci., 52, 4302-4326, 1995.
Heymsfield, A.J. and L.M. Miloshevich, Relative humidity and temperature influences on cirrus formation and evolution: Ob- servations from wave clouds and FIRE II, Geophys. Res. Left. 9, 1343-1346, 1998.
Jensen, E.J., O.B. Toon, D.L. Westphal, S. Kinne, and A.J. Heymsfield, Microphysical modeling of cirrus 1. Comparison with 1986 FIR,E IFO measurements, J. Geophys. Res., 99, 10421-10442, 1994a.
Jensen, E.J., O.B. Toon, D.L. Westphal, S. Kinne, and A.J. Heymsfield, Microphysical modeling of cirrus 2. Sensitivity studies, J. Geophys. Res., 99, 10443-10454, 1994b.
Giraud, V., J.C. Buriez, Y. Fouquart, and F. Parol, Large-scale analysis of cirrus clouds from AVHR,R, data: Assessment of both a microphysical index and the cloud-top temperature. J. Appl. Meteorol., 36, 664-675, 1997.
Inoue, T., On the temperature and effective emissivity determina- tion of semi-transparent cirrus clouds by bi-spectral measure- ments in the 10/•m window region. J. Meteor. Soc. Japan, 63, 88-98, 1985.
Lin, X. and J. Coackley Jr, R,etrieval of properties for semi- transparent clouds from multispectral infrared imagery data. J. Geophys. Res., 98, 18501-18514, 1993.
Masson, B.J., The Physics of Clouds, Oxford University Press, London, 481 pp, 1957
Minnis, P., E.F. Harrison, L.L. Stowe, G.G. Gibson, F.M. Denn, D.R,. Doelling and W.L. Smith, Jr., Radiative climate forc- ing by the mount Pinatubo eruption, Science, 259, 1411-1415,
1993.
Mutlow, C., J. Murray, P. Bailey and A. Birks, A short guide to the ATSR,-1 and V2 instruments and their data pruducts,
ATSR,-1/2 User Guide, www. atsr. rl. ac. uk, 1998.
Parol, F., J. C. Buriez, C. Vanbauce, P. Couvert, G. S•ze, P. Goloub and S. Cheinet, First results of the POLDER'
"Earth Radiation Budget and Clouds" operational algorithm.
IEEE/Tran. Geosc. Rein. Sens., 1999.
Pruppaker, H.R,., A new look at homogeneous ice nucleation in supercooled water drops, J. Atmos. Sci., 52, 1924-1933, 1995. Pruppaker, H.R,. and J.D. Klett, Microphisics of Clouds and Pre-
cipitation, 714 pp., D. R,eidel, Norwell, Mass, 1978.
R,iedi J., M. Doutriaux-Boucher, P. Goloub and P. Couvert,
Global distribution of cloud top phase from POLDER,/ADEOS
1, Geophys. Res. Left., 27, 1707-1710, 2000.
Sassen, K. and G.C. Dodd, Homogeneous nucleation rate for highly supercooled cirrus cloud droplets, J. Atmos. Sci., •5, 1357-1369, 1988.
Sassen, K. and G.C. Dodd, Haze particle nucleation simulations in cirrus clouds, and applications on numerical and lidar studies, J. Atmos. Sci., •6, 3005-3014, 1989.
V. Giraud, P. Goloub, J. R,iedi and O. Thouron Labo- ratoire d'Optique Atmosph&ique, Universit6 des Sciences et Technologies de Lille, 59655 Villeneuve d'Ascq Cedex. France,
Phone: (33) 03 20 43 47 66, Fax: (33) 03 20 43 43 42, (e-mail: giraud@løaser'univ-lillel'fr; gøløub@løaser'univ-lillel'fr; riedi@løaser'univ-lillel' fr; thøurøn@løaser'univ-lillel'fr)
(R,eceived July 13, 2000; revised December 5, 2000;