HAL Id: hal-00303963
https://hal.archives-ouvertes.fr/hal-00303963
Submitted on 8 Feb 2008HAL is a multi-disciplinary open access
archive for the deposit and dissemination of sci-entific research documents, whether they are pub-lished or not. The documents may come from teaching and research institutions in France or abroad, or from public or private research centers.
L’archive ouverte pluridisciplinaire HAL, est destinée au dépôt et à la diffusion de documents scientifiques de niveau recherche, publiés ou non, émanant des établissements d’enseignement et de recherche français ou étrangers, des laboratoires publics ou privés.
Comparison of total ozone and erythemal UV data from
OMI with ground-based measurements at Rome station
I. Ialongo, G. R. Casale, A. M. Siani
To cite this version:
I. Ialongo, G. R. Casale, A. M. Siani. Comparison of total ozone and erythemal UV data from OMI with ground-based measurements at Rome station. Atmospheric Chemistry and Physics Discussions, European Geosciences Union, 2008, 8 (1), pp.2381-2401. �hal-00303963�
ACPD
8, 2381–2401, 2008 Comparison of OMI data with ground-based measurements I. Ialongo et al. Title Page Abstract Introduction Conclusions References Tables Figures ◭ ◮ ◭ ◮ Back Close Full Screen / EscPrinter-friendly Version Interactive Discussion Atmos. Chem. Phys. Discuss., 8, 2381–2401, 2008
www.atmos-chem-phys-discuss.net/8/2381/2008/ © Author(s) 2008. This work is distributed under the Creative Commons Attribution 3.0 License.
Atmospheric Chemistry and Physics Discussions
Comparison of total ozone and erythemal
UV data from OMI with ground-based
measurements at Rome station
I. Ialongo, G. R. Casale, and A. M. Siani
Physics Department, Sapienza – University of Rome, Italy
Received: 3 January 2008 – Accepted: 6 January 2008 – Published: 8 February 2008 Correspondence to: I. Ialongo (iolanda.ialongo@uniroma1.it)
ACPD
8, 2381–2401, 2008 Comparison of OMI data with ground-based measurements I. Ialongo et al. Title Page Abstract Introduction Conclusions References Tables Figures ◭ ◮ ◭ ◮ Back Close Full Screen / EscPrinter-friendly Version Interactive Discussion
Abstract
Ground-based total ozone and surface UV irradiance measurements have been col-lected since 1992 using Brewer spectrophotometer and Erythemal Dose Rates (EDRs) have been determined by a broad-band radiometer (model YES UVB-1) operational since 2000 at Rome station. The methodology to retrieve the EDR and the
Erythe-5
mal Daily Dose (EDD) from the radiometer observations is described. Ground-based measurements were compared with satellite-derived total ozone and UV data from the Ozone Monitoring Instrument (OMI). OMI, onboard the NASA EOS Aura spacecraft, is a nadir viewing spectrometer that provides total ozone and surface UV retrievals. The results of the validation exercise showed satisfactory agreement between OMI
10
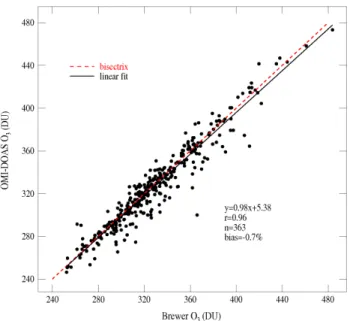
and Brewer total ozone data, for both OMI-TOMS and OMI-DOAS ozone alghorithms (biases of −1.8% and −0.7%, respectively). Regarding UV data, OMI data overesti-mate ground-based erythemally weighted data retrieved from both Brewer and YES Radiometer (biases about 20%), probably because of the effect of absorbing aerosols in an urban site such as Rome.
15
1 Introduction
The amount of solar ultraviolet (UV) radiation (200–400 nm) reaching the Earth’s sur-face is affected mainly by atmospheric ozone absorption, cloudiness and aerosols. Changes in UV radiation at surface may strongly affect the human health and the ter-restrial and aquatic ecosistem (UNEP,2007). This paper is focused on the
erythemally-20
weighted UV radiation monitoring.
Erythemal Dose Rate (EDR) is defined as the incoming solar radiation on a hor-izontal surface convoluted with the erythema action spectrum (Diffey and McKinlay,
1987) over the whole UV range. The Erythemal Daily Dose (EDD) can be obtained integrating the EDR values over the day and it provides the degree of effectiveness of
25
ACPD
8, 2381–2401, 2008 Comparison of OMI data with ground-based measurements I. Ialongo et al. Title Page Abstract Introduction Conclusions References Tables Figures ◭ ◮ ◭ ◮ Back Close Full Screen / EscPrinter-friendly Version Interactive Discussion spectroradiometers can provide measures of erythemal UV quantities.
Although the availability of UV measurements of high quality from ground-based in-struments is growing up in the last decades, the surface UV monitoring station network allows low spatial and time coverage. Satellite-based instruments offer a better ge-ografical distribution but continous validations with ground-based measurements are
5
required to assess the accuracy of satellite data.
Surface UV radiation estimates have been provided from the Ozone Monitoring In-strument (OMI), flying on the NASA EOS Aura spacecraft since 15 July 2004. OMI is a spectrometer designed to monitor ozone and other atmospheric species (Levelt et
al.,2006). Two algorithms, OMI-TOMS and OMI-DOAS (Differential Optical Absorption
10
Spectroscopy), are used to produce OMI daily total ozone datasets. OMI UV products are local solar noon irradiances at 305, 310, 324, and 380 nm, as well as EDRs and EDDs.
OMI continues the Total Ozone Monitoring System (TOMS) record of total ozone, aerosol, and UV measurements. Satellite ozone and UV data derived from TOMS
15
were exaustively validated by means of ground-based ozone and UV data (Brogniez et
al.,2005;Fioletov et al.,2002;Arola et al.,2005;Kazantzidis et al.,2006).
Brogniez et al.(2005) found a reasonably good agreement between satellite ozone data and ground-based measurements retrieved in six european sites: generally the ground-based ozone seems to be slightly higher than TOMS ozone (less than 3%).
Re-20
garding UV data,Fioletov et al.(2002) found that erythemal UV estimates from TOMS demonstrate better agreement with ground-based measures in case of low level of pollution.Arola et al.(2005) compared TOMS overpass retrievals against Brewer mea-surements at Ispra (Italy) and Thessaloniki (Greece), obtaining large positive biases in both cases (on average about 19% for Ispra and 30% for Thessaloniki). They found
25
that these discrepancies can be mainly explained by the aerosol effect.Kazantzidis et
al. (2006) confirmed that TOMS UV data overestimate ground-based measurements by almost 20% under high aerosol load.
com-ACPD
8, 2381–2401, 2008 Comparison of OMI data with ground-based measurements I. Ialongo et al. Title Page Abstract Introduction Conclusions References Tables Figures ◭ ◮ ◭ ◮ Back Close Full Screen / EscPrinter-friendly Version Interactive Discussion parison between ground-based Brewer and Dobson data and OMI satellite ozone data
showed an agreement of better than 1% for OMI-TOMS and 2% for OMI-DOAS ozone retrievals. A first validation of OMI UV retrievals is given by Tanskanen et al.(2007): they compared the surface UV radiation data from OMI with those derived from sev-eral ground-based instruments located at different sites in Europe, Canada, Japan,
5
USA and Antartic. The validation results showed that OMI data are in general suitable to monitor solar UV radiation levels but it was noticed a positive bias of the satellite-derived UV in urban sites, due to the effect of pollution.
In this study the methodology to derive the EDRs at local noon (EDRs@noon) and the EDDs from the broad-band radiometer (model UVB-1, Yankee Environmental
Sys-10
tem, MA, USA) operational at Rome (Italy) since 2000, is described and the results are presented. The aim of this work was to investigate on the applicability of OMI data for total ozone and surface UV monitoring in an urban site, such as Rome, and on the possible sources of uncertainty. EDRs@noon, EDDs and total ozone column from ground-based instruments at Rome station were compared with OMI data.
15
2 Data and methodology
2.1 Ground-based datasets
The Solar Radiometry Observatory of Sapienza University of Rome (41.9◦N, 12.5◦E, 75 m a.s.l.) is located on the roof of a building of the University Campus (centre of Rome, classified as urban site according toMeloni et al.(2000)). Total ozone and solar
20
UV irradiance have been measured by Brewer spectrophotometer #067 operational since 1992 and EDR measures are provided by the broadband UV radiometer (model YES UVB-1) operational since 2000.
Brewer spectrophotometer #067 is an MKIV type with a single-monochromator and it performs scans in the spectral range from 290 to 325 nm with a stepwidth of 0.5 nm
25
ACPD
8, 2381–2401, 2008 Comparison of OMI data with ground-based measurements I. Ialongo et al. Title Page Abstract Introduction Conclusions References Tables Figures ◭ ◮ ◭ ◮ Back Close Full Screen / EscPrinter-friendly Version Interactive Discussion values of ozone are determined from the Brewer direct sun measurements; for each
DS procedure, direct solar radiances are measured at six wavelengths (303.2, 306.3, 310.1, 313.5, 316.8 and 320.1 nm). The first wavelength is used for spectral calibra-tions, while combinations of the natural logarithm of the radiances at the other five wavelengths are used to compute the total ozone.
5
Periodic checks and tests (monthly, weekly and daily) are carried out in order to guar-antee the accuracy and quality of the observations. The absolute calibration was made by the IOS inc. (International Ozone Service) and by the CUCF (Central UV Calibra-tion Facility) almost every year. Furthermore, UV measurements were intercompared with the travelling standard spectroradiometer B5503 from PMOD/WRC
(Physikalisch-10
Meteorologisches Observatorium Davos, World Radiation Center) within the project QASUME, in May 2006 at Rome. It was found that the deviation in the angular re-sponse from the ideal cosine rere-sponse in the Brewer #067 has been leading UV irra-diance to be underestimated on average by 9%. In this study all UV irrairra-diances for the period 1992–2006 were corrected for cosine and temperature effect and for Sun-Earth
15
distance.
The EDR were obtained from Brewer measurements by weighting surface UV irra-diance with the standard erythemal action spectrum (Diffey and McKinlay,1987) and by integrating over the wavelength range 290–400 nm. The irradiances from 325.5 to 400 nm are extrapolated from the measured irradiance at 325 nm.
20
EDR measures (time sampling of 1 min) are also provided by the YES UVB-1 broad band radiometer which has a spectral response similar to that of skin erythema and it is suitable to determine erythemally weighted irradiances. The radiometer was calibrated at the European Reference Centre for Ultraviolet Radiation Measurements (Joint Re-search Centre, Ispra, Italy) in 2004 and it participated into the broadband radiometer
25
inter-comparison at PMOD/WRC at Davos (Switzerland) in August 2006.
An algorithm was developed to compute the EDRs (W m−2) from the radiometer signal, according to the following formula (Webb et al.,2006):
ACPD
8, 2381–2401, 2008 Comparison of OMI data with ground-based measurements I. Ialongo et al. Title Page Abstract Introduction Conclusions References Tables Figures ◭ ◮ ◭ ◮ Back Close Full Screen / EscPrinter-friendly Version Interactive Discussion where U is the raw signal of the instrument (V ); C is the calibration coefficient
(C=0.1104 Wm−2V−1);f
n(θ, T O3) is a function of the solar zenith angleθ and the total column ozoneT O3; Coscor(θ) is the cosine correction function.
The calibration factorC and fn(θ, T O3) were obtained during the broadband radiome-ter inradiome-ter-comparison at Davos (Webb et al.,2006) and all YES data were then
repro-5
cessed. The values offn were obtained taking into account the daily mean total ozone from Brewer #067. Total ozone data from satellite instruments are also used to derive
fn, obtaining results similar to those obtained from ground-based ozone data (difference
lower than 0.5%). Then, EDDs (kJ m−2) were computed integrating the EDR measures over the whole day.
10
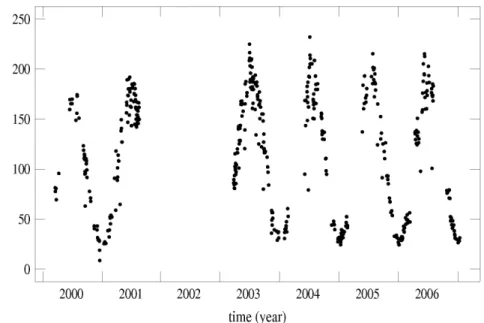
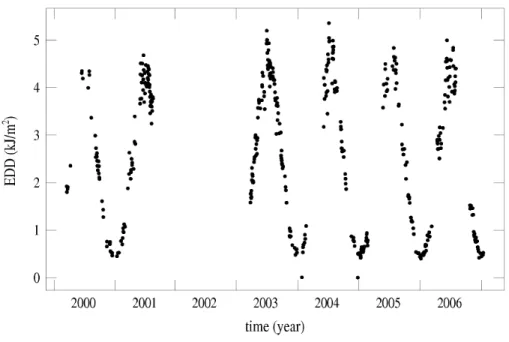
Figures1 and2 show, respectively, the EDR and EDD time series obtained by the radiometer measurements at Rome station during clear sky days since 2000. It is clearly visible the seasonal behavior with a maximum in summer and a minimum in winter.
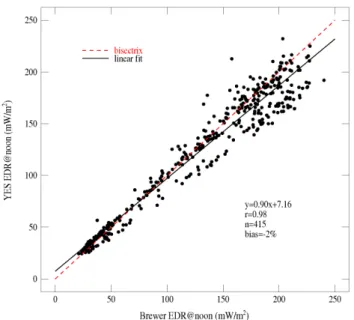
The Fig.3shows the comparison between Brewer and YES EDRs@noon: the
corre-15
lation coefficient r is 0.98 and the bias (defined as 1n
P
(YES − Brewer)/Brewer where
n is the number of days included in the comparison) is −2%. The absolute value of
the bias is lower than the estimated accuracy of the Brewer #067 UV irradiance (about 5%). Both Brewer and YES datasets are used for OMI validation exercise.
2.2 OMI products
20
The Ozone Monitoring Instrument (OMI) onboard the NASA EOS Aura spacecraft (on flight from 14 July 2004) is a nadir viewing spectrometer that measures solar reflected and backscattered light in a selected range of the UV and visible spectrum. The Aura satellite describes a sun-synchronous polar orbit, crossing the equator at 13:45 local time. The width of the instrument’s viewing swath is 2600 km and it is large enough
25
to provide global daily coverage with a spatial resolution of 13×24 km in nadir. OMI measurements of ozone columns and profiles, aerosols, clouds, surface UV irradiance and the trace gases (NO2, SO2, HCHO, BrO and OClO) are available (Levelt et al.,
ACPD
8, 2381–2401, 2008 Comparison of OMI data with ground-based measurements I. Ialongo et al. Title Page Abstract Introduction Conclusions References Tables Figures ◭ ◮ ◭ ◮ Back Close Full Screen / EscPrinter-friendly Version Interactive Discussion
2006).
Total ozone amounts are derived as two overpass products: OMI-TOMS ozone data are based on TOMS V8 algorithm (Bhartia et al.,2002) while OMI-DOAS ozone product (Veefkind et al., 2006) is based on a DOAS (Differential Optical Absorption Spectroscopy) tecnique developed by Koninklijk Nederlands Meteorologisch Instituut
5
(KNMI).
The OMI TOMS-like algorithm uses 2 wavelengths (317.5 and 331.2 nm under most conditions, and 331.2 and 360 nm for high ozone and high solar zenith angle condi-tions). The longer of the two wavelengths is used to derive the surface reflectivity (or cloud fraction); then, the shorter wavelength, which is heavily absorbed by ozone, is
10
used to derive total ozone.
In the DOAS algorithm the ozone vertical column is determined in three steps. In the first step, the so-called slant column density (the amount of ozone along an average photon path from the Sun to the satellite) is obtained. In the second step, the air mass factor is determined, which is needed to convert the slant column density into a vertical
15
column. Finally, a cloud correction is performed.
OMI surface UV retrievals are determined by means of an extension of the TOMS UV algorithm developed by NASA Goddard Space Flight Center (GSFC) (Tanskanen et
al.,2006). Firstly, the algorithm estimates the surface irradiance under clear-sky con-ditions by using as inputs OMI satellite ozone data and climatological surface albedo.
20
Afterwards the clear-sky irradiance is corrected by multiplying it with a cloud modifica-tion factor derived from OMI data that account for the attenuamodifica-tion of UV radiamodifica-tion by clouds and non-absorbing aerosols. Absorbing aerosols (e.g. organic carbon, smoke and dust) or trace gases (e.g. NO2, SO2) are known to lead an overestimation of the surface UV irradiance (Krotkov et al.,1998;Arola et al.,2005). The current OMI
sur-25
face UV algorithm does not include absorbing aerosols, therefore OMI UV data are expected to show an overestimation for regions affected by absorbing aerosols (i.e. ur-ban site). OMI UV overpass data include EDD, EDR@noon and spectral irradiances at 305.1, 310.1, 324.1 and 380.1 nm also at local solar noon.
ACPD
8, 2381–2401, 2008 Comparison of OMI data with ground-based measurements I. Ialongo et al. Title Page Abstract Introduction Conclusions References Tables Figures ◭ ◮ ◭ ◮ Back Close Full Screen / EscPrinter-friendly Version Interactive Discussion 2.3 Validation methodology
Ground-based Brewer daily mean total ozone measurements (all sky days) were com-pared with both OMI-TOMS and OMI-DOAS ozone data and Brewer EDRs@noon were compared with OMI EDRs@noon (clear sky days). Furthermore, EDRs@noon and EDDs from YES radiometer retrieved in clear sky days were compared with OMI
5
satellite-derived data. In order to quantify the agreement between OMI (yi) and ground-based (xi) data, the bias values were computed as follows:
bias = 1 n n X i =1 (yi − xi) xi ∗ 100. (2)
where n is the number of days taken into account in the intercomparison. The values of (yi−xi)/xi were analysed as a function of the OMI Solar Zenith Angle (SZA) and the
10
distance between the OMI pixel and the ground-based (GB) station.
3 Results and discussion
The validation results are summarized in Table1in terms of bias and correlation coef-ficient r.
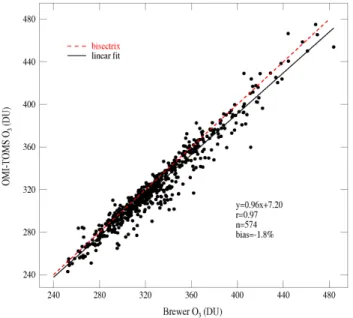
OZONE – The daily means of Brewer total ozone measurements were compared
15
with OMI-TOMS ozone (Fig. 4) from September 2004 to December 2006 and OMI-DOAS ozone (Fig. 5) from October 2005 to December 2006, for all sky days. OMI ozone slightly underestimates ground-based ozone with a negative bias around −1.8% for OMI-TOMS and −0.7% for OMI-DOAS.Balis et al.(2006) showed that OMI-DOAS comparisons exhibit indications for a seasonal dependence (i.e. SZA dependence); in
20
this study, the analysis does not show any significant dependence on both SZA and distance pixel-GB.
UV RADIATION – EDRs@noon retrieved from Brewer measurements during clear sky days were compared with OMI UV data from September 2004 to July 2006
ACPD
8, 2381–2401, 2008 Comparison of OMI data with ground-based measurements I. Ialongo et al. Title Page Abstract Introduction Conclusions References Tables Figures ◭ ◮ ◭ ◮ Back Close Full Screen / EscPrinter-friendly Version Interactive Discussion (Fig.6). The positive value of bias (28%) shows that OMI data overestimate
ground-based Brewer measurements (Table1). The Fig.6(lower panel) shows the values of (yi−xi)/xi as a function of OMI SZA: at large values of SZA (> 55◦), corresponding
to autumn–winter seasons, OMI overestimates ground-based instrument by 35%, on average, while at small SZAs (< 55◦) by 22%. This discrepancy may be explained with
5
the fact that satellite instruments do not probe well the lower atmospheric layers (large SZA), where trace gases and aerosols play an important role in the radiative budget. Otherwise, the comparison does not show any significant dependence on the distance pixel-GB.
EDRs@noon and EDDs retrieved from YES radiometer during clear sky days from
10
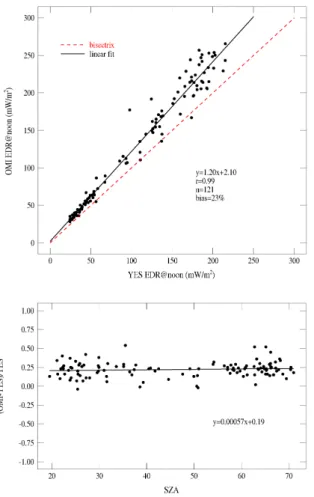
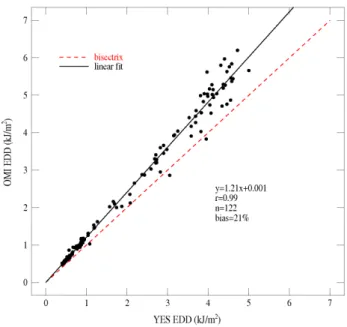
September 2004 to July 2006 were compared with OMI data (Figs.7 and 8, respec-tively). The high correlation coefficient (r=0.99) and the positive biases (Table1) show that OMI UV data sistematically overestimate YES EDRs@noon and EDDs, confirm-ing the results obtained for Brewer UV data. Although for YES UV data the bias values (23% for EDR@noon and 21% for EDD) are slighly smaller with respect to Brewer UV
15
data, the difference between OMI and ground-based UV data is still large. Otherwise, for YES data the comparison does not show any significant angular dependence (lower panel in Fig.7).
Similar results were found byWeihs et al.(2006) with measurements performed at Villeneuve d’Ascq (France) station (near urban site). Furthermore,Bais et al. (2007)
20
confirmed that OMI-derived EDDs overestimate ground-based data by between 20% and 30% at three sites in Greece.
Taking into account all sky conditions days the biases are slightly larger (1–3% higher) with respect to clear sky days. The OMI overestimation of ground-based UV measurements may be partly explained with the fact that OMI surface UV algorithm
25
does not account for the effect of absorbing aerosols and some trace gases in atmo-sphere. Furthermore, the difference can be related to the fact that the time of overpass and conditions during overpass do not correspond to time and conditions at solar noon (Weihs et al.,2006).
ACPD
8, 2381–2401, 2008 Comparison of OMI data with ground-based measurements I. Ialongo et al. Title Page Abstract Introduction Conclusions References Tables Figures ◭ ◮ ◭ ◮ Back Close Full Screen / EscPrinter-friendly Version Interactive Discussion
4 Conclusions
The first results of OMI total ozone and erythemal UV data validation by using ground-based high quality measurements at Rome site were shown.
OZONE – The daily mean ozone values from Brewer spectrophotometer #067 showed a good agreement with OMI ozone data retrieved by means of both OMI-TOMS
5
(bias=−1.8%) and OMI-DOAS (bias=−0.7%) algorithms. In both cases, comparisons do not show any significant dependence on SZA and distance OMI pixel-GB.
UV RADIATION – EDRs@noon and EDDs retrieved from YES UVB-1 radiometer were presented for clear sky days from 2000 to 2006 at Rome site. EDR@noon re-trievals from YES radiometer and Brewer #067 agree reasonably well (bias=−2%).
10
The comparisons between satellite-based and ground-based UV data showed that, on average, OMI UV products exceed ground-based UV measurements by more than 20%. This may be attributed to the fact that the satellite instrument does not effectively probe the boundary layer, where the extinction by the aerosols can be important, mainly in an urban site as Rome. The comparison of Brewer EDRs@noon with OMI data
15
shows a slight seasonal dependence (bias around 28%). Concerning YES radiometer data, the bias values are stable around 21% for EDD and 23% for EDR@noon. Similar results were found by several groups working on satellite validation exercise.
FUTURE PLANS – Further investigations on satellite-derived OMI spectral UV data are required to give hints about the possible sources of uncertainty. Furthermore,
20
EDRs at actual satellite overpass time will be compared with ground-based measure-ments, in order to diminish the uncertainty of satellite UV retrievals.
Acknowledgements. The authors are grateful to Aura Validation Data Center (NASA) for
pro-viding OMI data. The figures were drawn using the Mgraph package developed at LOA by L. Gonzalez and C. Deroo (http://www-loa.univ-lille1.fr/Mgraph).
ACPD
8, 2381–2401, 2008 Comparison of OMI data with ground-based measurements I. Ialongo et al. Title Page Abstract Introduction Conclusions References Tables Figures ◭ ◮ ◭ ◮ Back Close Full Screen / EscPrinter-friendly Version Interactive Discussion
References
Arola, A., Kazadzis, S., Krotkov, N., Bais, A., Groebner, J., and Herman, J. R.: Assess-ment of TOMS UV bias due to absorbing aerosols, J. Geophys. Res., 110, D23211, doi:10.1029/2005JD005913, 2005. 2383,2387
Bais, A., Kazantzidis, A., Kazadzis, S., and Zempila, M.: Validation of OMI products over
Eu-5
rope with ground-based UV instruments: Contribution from Aristotle University of Thessa-loniki, in: OMI AO Progress Report no.4, pp. 68–88, available at: http://www.knmi.nl/omi/
research/validation/ao/, 2007. 2389
Balis, D., Brinksma, E., Kroon, M., Amiridis, V. and Zerefos, C.: Validation of OMI total ozone using ground-based Brewer observations, ATMOS Conference, 12/5/2006, Frascati, ESA
10
ESRIN, 2006. 2383,2388
Bhartia, P. K. and Wellemeyer, C. W.: TOMS-V8 total O3 algorithm, NASA Goddard Space Flight Center, Greenbelt, MD, OMI Algorithm Theoretical Basis Document Vol II., 2002.2387
Brogniez, C., Houet, M., Siani, A. M., Weihs, P., Allaart, M., Lenoble, J., Cabot, T., de la Casiniere, A., and Kyro, E.: Ozone column retrieval from solar UV measurements at ground
15
level: Effects of clouds and results from six European sites, J. Geophys. Res., 110, D24202, doi:10.1029/2005JD005992, 2005. 2383
Casale, G. R., Meloni, D., Miano, S., Palmieri, S., Siani, A. M., and Cappellani, F.: Solar UV irradiance and total ozone in Italy: fluctuations and trend, J. Geophys. Res., 105, 4895–4901, 2000. 2384
20
Diffey, B. and McKinlay, A. F.: A reference action spectrum for ultraviolet induced erythema in human skin, Human Exposure to UV radiation: Risks and Regulations, 83–87, Elsevier, NY, 1987. 2382,2385
Fioletov, V. E., Kerr, J. B., Wardle, D. I., Krotkov, N., and Herman, J. R.: Comparison of Brewer ultraviolet irradiance measurements with total ozone mapping spectrometer
satel-25
lite retrievals, Opt. Eng., 41, 3051–3061, 2002. 2383
Kazantzidis, A., Bais, A. F., Groebner, J., Herman, J. R., Kazadizis, S., Krotkov, N., Kyro, E., den Outer, P. N., Garane, K., Grts, P., Lakkala, K., Meleti, C., Slaper, H., Tax, R. B., Turunen, T, and Zerefos, C. S.: Comparison of satellite-derived UV irradiances with ground-based measurements at four European stations, J. Geophys. Res., 111, D13207,
30
doi:10.1029/2005JD006672, 2006. 2383
ACPD
8, 2381–2401, 2008 Comparison of OMI data with ground-based measurements I. Ialongo et al. Title Page Abstract Introduction Conclusions References Tables Figures ◭ ◮ ◭ ◮ Back Close Full Screen / EscPrinter-friendly Version Interactive Discussion
spectral surface UV irradiance in the presence of tropospheric aerosols: 1. Cloud-free case, J. Geophys. Res., 103(D8), 8779–8793, 1998. 2387
Levelt, P. F., van den Oord, G. H. J., Dobber, M. R., Mlkki, A., Visser, H., de Vries, J., Stammes, P., Lundell, J., and Saari, H.: The Ozone Monitoring Instrument, IEEE Trans. Geo. Rem. Sens, Vol. 44, No. 5, 1093–1101, 2006.2383,2386
5
Meloni, D., Casale, G. R., Siani, A. M., Palmieri, S., and Cappellani, F.: Solar UV Dose Patterns in Italy, Photochem. Photobiol., Vol. 71, No. 6, pp. 681–690, 2000. 2384
Tanskanen, A., Krotkov, N. A., Herman, J. R., Arola, A.: Surface Ultraviolet Irradiance from OMI, IEEE Trans. Geo. Rem. Sens. Aura Special Issue, 2006.2387
Tanskanen, A., Lindfors, A., Maatta, A., Krotkov, N., Herman, J., Kaurola, J., Koskela, T.,
10
Lakkala, K., Fioletov, V., Bernhard, J., McHenzie, R., Kondo, Y., O’Neill, M., Slaper, H., den Outer, P., Bais, A. F., and Tamminen, J.: Validation of daily erythemal doses from OMI with ground-based UV measurement data, J. Geophys. Res., 112, D24S44, doi:10.1029/2007JD008830, 2007. 2384
UNEP: Environmental effects of ozone depletion and its interactions with climate change, 2006
15
assessment, Photochemical and Photobiological Sciences, Vol. 6, No. 3, 201–332, 2007.
2382
Veefkind, J. P., de Haan, J. F., Brinksma, E. J., Kroon, M., and Levelt, P. F.: Total Ozone from the Ozone Monitoring Instrument (OMI) using the DOAS technique, IEEE Trans. Geo. Rem. Sens., 44(5), 1239–1244, doi:10.1109/TGRS.2006871204, 2006. 2387
20
Webb, A. R., Groebner, J., and Blumthaler, M.: A Practical Guide to Operating Broadband In-struments Measuring Erythemally Weighted Irradiation. Publication of COST 726 and WMO, 2006. 2385,2386
Weihs, P., Simic, S., Buchard, V., Brogniez, C., Chiapello, I., Lenoble, J.: Validation of OMI products over Europe with ground-based UV instruments, OMI Science Team Meeting, 20–
25
ACPD
8, 2381–2401, 2008 Comparison of OMI data with ground-based measurements I. Ialongo et al. Title Page Abstract Introduction Conclusions References Tables Figures ◭ ◮ ◭ ◮ Back Close Full Screen / EscPrinter-friendly Version Interactive Discussion
Table 1. Summary of OMI validation results. The bias is defined in the Eq. (2); r is the
correlation coefficient; n is the number of days included in the comparison. bias r n OMI-TOMS vs. Brewer Ozone −1.8% 0.97 574 OMI-DOAS vs. Brewer Ozone −0.7% 0.96 363 OMI vs. Brewer EDR@noon 28% 0.99 140 OMI vs. YES EDR@noon 23% 0.99 129 OMI vs. YES EDD 21% 0.99 122
ACPD
8, 2381–2401, 2008 Comparison of OMI data with ground-based measurements I. Ialongo et al. Title Page Abstract Introduction Conclusions References Tables Figures ◭ ◮ ◭ ◮ Back Close Full Screen / EscPrinter-friendly Version Interactive Discussion
Fig. 1. EDR@noon derived from YES UVB-1 radiometer for clear sky days from 2000 to 2006
ACPD
8, 2381–2401, 2008 Comparison of OMI data with ground-based measurements I. Ialongo et al. Title Page Abstract Introduction Conclusions References Tables Figures ◭ ◮ ◭ ◮ Back Close Full Screen / EscPrinter-friendly Version Interactive Discussion
Fig. 2. EDD derived from YES UVB-1 radiometer for clear sky days from 2000 to 2006 at
ACPD
8, 2381–2401, 2008 Comparison of OMI data with ground-based measurements I. Ialongo et al. Title Page Abstract Introduction Conclusions References Tables Figures ◭ ◮ ◭ ◮ Back Close Full Screen / EscPrinter-friendly Version Interactive Discussion
Fig. 3. YES radiometer vs Brewer EDR@noon scatterplot at Rome. The solid black line is the
ACPD
8, 2381–2401, 2008 Comparison of OMI data with ground-based measurements I. Ialongo et al. Title Page Abstract Introduction Conclusions References Tables Figures ◭ ◮ ◭ ◮ Back Close Full Screen / EscPrinter-friendly Version Interactive Discussion
Fig. 4. OMI-TOMS vs Brewer daily total ozone scatterplot at Rome. The solid black line is the
ACPD
8, 2381–2401, 2008 Comparison of OMI data with ground-based measurements I. Ialongo et al. Title Page Abstract Introduction Conclusions References Tables Figures ◭ ◮ ◭ ◮ Back Close Full Screen / EscPrinter-friendly Version Interactive Discussion
Fig. 5. OMI-DOAS vs Brewer daily total ozone scatterplot at Rome. The solid black line is the
ACPD
8, 2381–2401, 2008 Comparison of OMI data with ground-based measurements I. Ialongo et al. Title Page Abstract Introduction Conclusions References Tables Figures ◭ ◮ ◭ ◮ Back Close Full Screen / EscPrinter-friendly Version Interactive Discussion
Fig. 6. OMI vs Brewer EDR@noon scatterplot (upper panel) and bias as a function of
OMI-derived SZA (lower panel) for clear sky days at Rome. The solid black line is the linear fit while the red dashed line is the bisectrix.
ACPD
8, 2381–2401, 2008 Comparison of OMI data with ground-based measurements I. Ialongo et al. Title Page Abstract Introduction Conclusions References Tables Figures ◭ ◮ ◭ ◮ Back Close Full Screen / EscPrinter-friendly Version Interactive Discussion
Fig. 7. OMI vs YES EDR@noon scatterplot (upper panel) and bias as a function of OMI-derived
SZA (lower panel) for clear sky days at Rome. The solid black line is the linear fit while the red dashed line is the bisectrix.
ACPD
8, 2381–2401, 2008 Comparison of OMI data with ground-based measurements I. Ialongo et al. Title Page Abstract Introduction Conclusions References Tables Figures ◭ ◮ ◭ ◮ Back Close Full Screen / EscPrinter-friendly Version Interactive Discussion
Fig. 8. OMI vs YES radiometer EDD scatterplot for clear sky days at Rome. The solid black