Discrete SARS-CoV-2 antibody titers
track with functional humoral stability
The MIT Faculty has made this article openly available.
Please share
how this access benefits you. Your story matters.
Citation
Bartsch, Yannic C. et al. "Discrete SARS-CoV-2 antibody titers track
with functional humoral stability." Nature Communications 12, 1
(February 2021): 1018 © 2021 The Author(s)
As Published
http://dx.doi.org/10.1038/s41467-021-21336-8
Publisher
Springer Science and Business Media LLC
Version
Final published version
Citable link
https://hdl.handle.net/1721.1/129807
Terms of Use
Creative Commons Attribution 4.0 International license
Discrete SARS-CoV-2 antibody titers track with
functional humoral stability
Yannic C. Bartsch
1,14
, Stephanie Fischinger
1,2,14
, Sameed M. Siddiqui
3,4,14
, Zhilin Chen
1
, Jingyou Yu
1,5
,
Makda Gebre
1,5
, Caroline Atyeo
1
, Matthew J. Gorman
1
, Alex Lee Zhu
1
, Jaewon Kang
1
, John S. Burke
1
,
Matthew Slein
1
, Matthew J. Gluck
6,7
, Samuel Beger
6
, Yiyuan Hu
6
, Justin Rhee
6
, Eric Petersen
6
,
Benjamin Mormann
6
, Michael de St Aubin
8
, Mohammad A. Hasdianda
9
, Guruprasad Jambaulikar
9
,
Edward W. Boyer
9
, Pardis C. Sabeti
4,10,11,12
, Dan H. Barouch
1,5,12
, Boris D. Julg
1
, Elon R. Musk
6
,
Anil S. Menon
6
✉
, Douglas A. Lauffenburger
13
✉
, Eric J. Nilles
9
✉
& Galit Alter
1,12
✉
Antibodies serve as biomarkers of infection, but if sustained can confer long-term immunity.
Yet, for most clinically approved vaccines, binding antibody titers only serve as a surrogate of
protection. Instead, the ability of vaccine induced antibodies to neutralize or mediate
Fc-effector functions is mechanistically linked to protection. While evidence has begun to point
to persisting antibody responses among SARS-CoV-2 infected individuals, cases of
re-infection have begun to emerge, calling the protective nature of humoral immunity against
this highly infectious pathogen into question. Using a community-based surveillance study,
we aimed to de
fine the relationship between titers and functional antibody activity to
SARS-CoV-2 over time. Here we report significant heterogeneity, but limited decay, across antibody
titers amongst 120 identified seroconverters, most of whom had asymptomatic infection.
Notably, neutralization, Fc-function, and SARS-CoV-2 specific T cell responses were only
observed in subjects that elicited RBD-specific antibody titers above a threshold. The findings
point to a switch-like relationship between observed antibody titer and function, where a
distinct threshold of activity
—defined by the level of antibodies—is required to elicit vigorous
humoral and cellular response. This response activity level may be essential for durable
protection, potentially explaining why re-infections occur with SARS-CoV-2 and other
common coronaviruses.
https://doi.org/10.1038/s41467-021-21336-8
OPEN
1Ragon Institute of MGH, MIT and Harvard, Cambridge, MA, USA.2Institut für HIV Forschung, Universität Duisburg-Essen, Duisburg, Germany. 3Computational and Systems Biology Program, Massachusetts Institute of Technology, Cambridge, MA, USA.4Broad Institute of MIT and Harvard,
Cambridge, MA, USA.5Center for Virology and Vaccine Research, Beth Israel Deaconess Medical Center, Harvard Medical School, Boston, MA, USA.
6Space Exploration Technologies Corp, Hawthorne, CA, USA.7Icahn School of Medicine at Mount Sinai, Nw York, USA.8Harvard Humanitarian Initiative,
Cambridge, MA, USA.9Brigham and Women’s Hospital, Boston, MA, USA.10Harvard T.H. Chan School of Public Health, Cambridge, MA, USA.11Howard
Hughes Medical Institute, Chevy Chase, MD, USA.12Massachusetts Consortium on Pandemic Readiness, Cambridge, MA, USA.13Department of Biological
Engineering, Massachusetts Institute of Technology, Cambridge, MA, USA.14These authors contributed equally: Yannic C. Bartsch, Stephanie Fischinger,
Sameed M. Siddiqui. ✉email:[email protected];[email protected];[email protected];[email protected]
123456789
F
ollowing most infections, the persistence of humoral
immune responses not only provides a record of infection,
but also confers protective immunity upon re-exposure. The
emerging data point to sustained humoral immune responses in
at least a subset of SARS-CoV-2 infected individuals
1,2, yet cases
of re-infection have begun to emerge
3,4. Whether persisting
antibodies retain neutralizing or other protective antiviral effector
functions, remains unclear, but may provide critical clues related
to the nature of long-term protection from re-infection.
Impor-tantly, higher SARS-CoV-2 antibody levels are consistently
observed among severely ill individuals and the elderly,
suggest-ing that enhanced immunity may arise in the presence of more
aggressive disease
5. Nonetheless, the majority of adults experience
asymptomatic to mild disease
6, typically resulting in the
genera-tion of lower antibody titers
7.
Importantly, beyond binding, antibodies confer protection
against re-infection or disease via their ability to functionally
interfere with infection, either by blocking infection
(neutraliza-tion) or by recruiting the innate immune system to clear and
control disease
8, both of which have emerged as correlates of
immunity against SARS-CoV-2 in vaccine studies in animal
models
9,10. However, the relationship between binding titers and
antibody effector function, particularly in individuals with
mild-to-asymptomatic disease, is poorly understood. Moreover, how
antibody function relates to T cell immunity, proposed as an
alternate correlate of immunity, is unclear. Collectively, defining
the nature of T and B cell immunity is key to defining the nature
of long-lived protection from re-infection.
Here we comprehensively probed the functional humoral
immune response in a cohort of 120 seropositive individuals,
identified through a community-based prospective
ser-oprevalence study, to gain deeper insights into the spectrum and
heterogeneity of functional humoral immunity to SARS-CoV-2
over time. As previously observed, striking heterogeneity in
antibody titers were observed across the infected population,
positively correlated with the number of symptoms experienced
by each individual. Limited antibody waning was noted over the
study period, but a discrete titer threshold was observed across
the population that discriminated individuals who evolved
neu-tralizing and Fc-effector functions, as well as T cell immunity.
These data suggest that a threshold of protective immunity may
exist among naturally infected individuals, related to the
func-tional potential of the humoral (and cellular) immune response.
Results
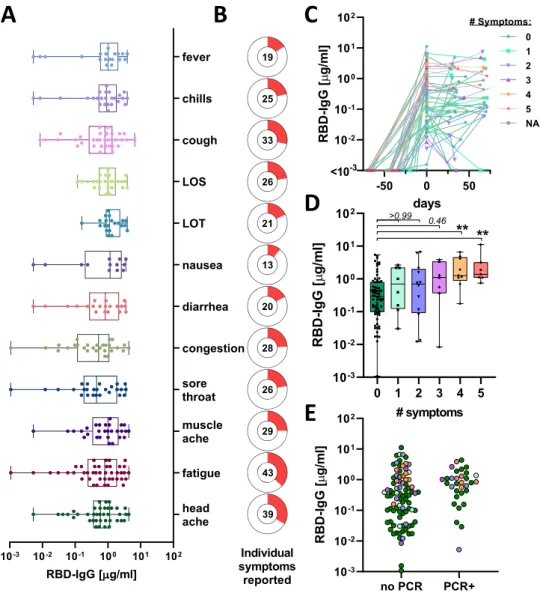
Baseline antibody levels track with symptomatology. In this
study we included 4300 volunteers all of whom were employees at
Space Exploration Technologies Corp. (SpaceX) that were
fol-lowed from April 2020, including SARS-CoV-2 receptor-binding
domain (RBD) antibody testing, and detailed symptomatology.
There were no exclusion criteria and all volunteers were included
across all analyses. Following a blinded performance of this
SARS-CoV-2 quantitative enzyme-linked immunosorbent assay
(ELISA) to the RBD, with a specificity of >99.5%
11, a total of
120 seroconverters were enrolled. Strikingly, 73 (61%) of the
seroconverters reported no COVID-19 related symptoms
(including loss of smell, loss of taste, cough, fever, and chills). We
observed antibody titers at baseline (T0;
first seropositive
time-point) between 1 ng/ml to 11
μg/ml (Fig.
1
A and Supplementary
Fig. 1). While no single symptom was associated with higher
titers, particular symptoms were observed more frequently in the
cohort (Fig.
1
A, B). Titers were distributed broadly, with a
sub-stantial proportion exhibiting levels comparable to subjects who
reported multiple COVID-19 related symptoms (fever, chills,
cough, loss of smell or loss of taste, Fig.
1
C, D). Along these lines,
PCR confirmed cases appeared to have higher titers most likely
because individuals with COVID-19 related symptoms were more
likely to get tested (Fig.
1
E). Thus, highly specific SARS-CoV-2
antibodies were readily found in both symptomatic and
asymp-tomatic infection cases, albeit with distributions favoring higher
titers in more symptomatic disease.
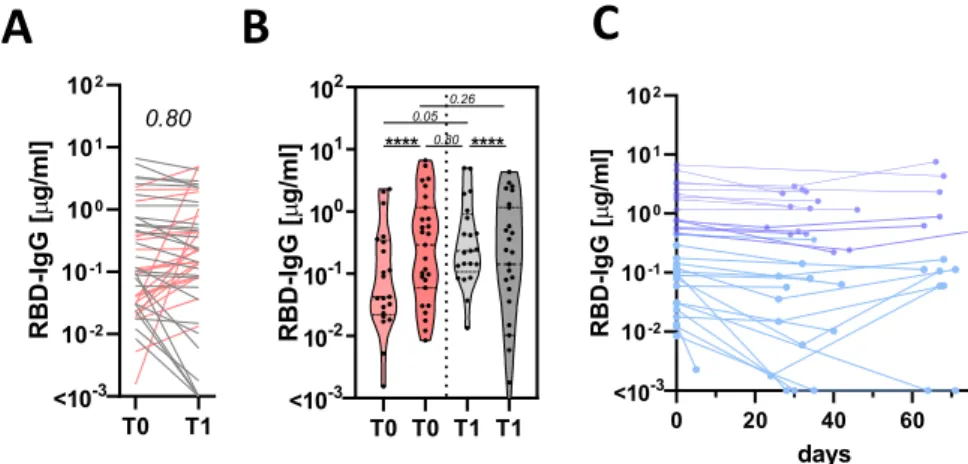
Antibody titer kinetics. Among the seroconverters, additional
longitudinal samples for comprehensive antibody profiling were
available for 87 that were included in the study, sampled with a
mean interval sampling time of 39.7 days (standard deviation
13.8 days) (Fig.
1
C). Forty eight of the seroconverters had at least
one additional follow-up test, and 44 (91.6 %) remained
ser-opositive, whereas four individuals lost their antibody responses
(Fig.
1
C). As RBD IgG titers were evaluated by ELISA over
multiple timepoints across the 48 subjects, diverse trajectories
were observed, with limited evidence of uniform decay.
Twenty-one individuals showed increased titer trajectories at their
sec-ond timepoint (T1) whereas 27 individuals exhibited lower
SARS-CoV-2 IgG levels at T1 (Fig.
2
A). The length of timing between
sampling timepoints did not appear to influence T0 antibody
titers (Supplementary Fig. 1B) or trajectory to the next timepoint
(Supplementary Fig. 1C).
The heterogeneous early humoral trajectories were potentially
representative of differences in the timing of sampling during the
induction of the humoral immune response (Fig.
2
B). To test this
hypothesis, individuals were grouped based on whether they
exhibited increasing or decreasing antibody titers. Subjects with
increasing titers tended (p
= 0.05) to have lower early titers;
potentially pointing to a slight upward trajectory from
serocon-version to study maximum observed titers, indicating maturation
of the response. Conversely, individuals with waning titers
exhibited higher titer at the
first timepoint (Fig.
2
B), pointing
to an expected loss of antibodies from study maximum observed
immunity, due to a loss of plasmablasts. These data point to an
expected rise, peak, and early waning profile observed with other
viral infections
12and emphasize the need for repeat testing to
ascertain the level of waning across a population
13,14.
Importantly, timepoints were also available for a subset of
individuals at additional timepoints. Remarkable stability for up
to more than 60 days was observed in these individuals, pointing
to a stabilization of the response (Fig.
2
C). Although we cannot
exclude possible re-exposure and natural boosting of these
immune responses, these data argue for some early waning, that
stabilizes at later timepoints resulting in persistent seropositivity
across this broad titer range. Whether these persisting binding
antibodies possess additional antiviral functions, critical for
protection against infection/disease, remains unclear.
Functional implications of titer heterogeneity. Commonly
cir-culating human coronaviruses cause seasonal infections, despite
the
presence
of
detectable
antibody
levels
across
the
population
15,16. However, why some individuals continue to get
re-infected, despite the presence of antibody-titers is unclear.
Beyond binding, the ability of antibodies to neutralize and
leverage innate immune effector functions is key to protection
across many clinically approved vaccines
8as well as against
SARS-CoV-2 in animal models
9,10. Whereas some literature
points to a relationship between RBD-binding titers and
neu-tralization
17, the overall relationship between binding and
humoral function is not well established.
To begin to address the relationship between antibody titer and
function, the 120 seropositive individuals were split in a simple
unbiased manner by the median study maximum observed titers
and examined through multiple functional assays (Fig.
3
A).
Remarkable differences in antibody effector function were
observed across the median-split (Fig.
3
B): detectable
neutraliza-tion, antibody-mediated complement deposition (ADCD), and
antibody-dependent neutrophil phagocytosis (ADNP) were
observed almost exclusively in individuals possessing higher
maximum observed RBD-specific antibody titers. Furthermore,
these functions remained stable in individuals with repeat
timepoints (Fig.
3
C).
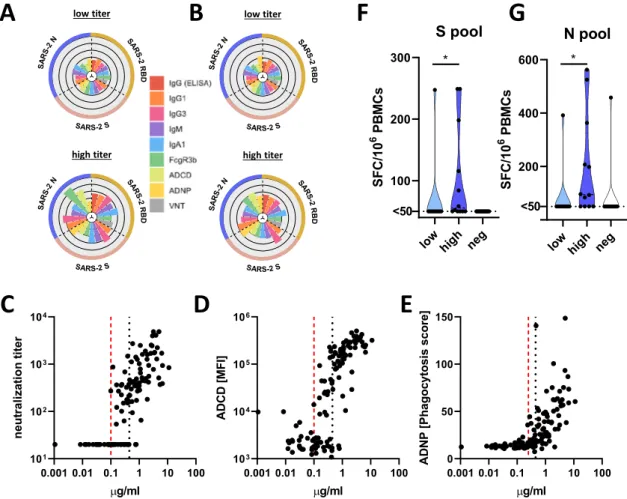
We next probed the functional humoral profile across
additional SARS-CoV-2 antigens, aimed at defining whether
additional humoral specificities may compensate for poor
RBD-functional immunity. Consistent coordination of humoral titers
across RBD, nucleocapsid (N), and full spike (S) were observed
(Fig.
3
D), albeit the correlations were stronger in the high titer
group. Accordingly, despite the correlated nature of RBD-, N-,
and S-humoral responses across both groups, only individuals
with high IgG titers exhibited broad and robust RBD-, N-, and
S-humoral immune responses of different subclasses, isotypes, and
with additional innate immune effector functions both at the
first
(Fig.
4
A, Supplementary Fig. 2) and second timepoints (Fig.
4
B).
In contrast, limited humoral immune responses across all 3
antigens were observed in individuals with low RBD-titers.
Beyond the median split (0.45
μg/ml), more discrete titers were
noted that tracked with individual antibody functions, where
neutralization emerged at a cut off of 0.1
μg/ml, ADNP only
appeared at 0.25
μg/ml, and complement appeared in some
individuals at concentrations of IgG as low as 0.1
μg/ml
(Fig.
4
C–E). These differences may reflect the distinct numbers
of antibody molecules required to drive each function,
represent-ing unique functional needs to cross-link viral spikes,
Fc-receptors, or deposit complement, respectively. Yet these distinct
thresholds point to opportunities to define discrete titer
Fig. 1 SARS-CoV-2 titer heterogeneity by symptoms. A IgG-RBD titer by reported symptom (values for individuals with multiple symptoms are shown for each symptom individually; LOS loss of smell, LOT loss of taste) (box extends from 25th to 75th percentile, whiskers show min and max, and vertical line indicates the median).B Donut plots with the proportion of individuals who reported the individual symptom in (A), the number in the donut hole indicates the absolute number of individuals (from a total of 116 individuals with symptom data).C The line plot shows the trajectory of SARS-CoV-2 RBD-specific antibody titers following seroconversion in 120 individuals (colors and symbols indicate the number of reported symptoms).D The whisker box plots show study maximum observed RBD titers grouped by individuals reporting 0–5 symptoms (box extends from 25th to 75th percentile, whiskers show min and max, and the horizontal line indicates the median;n0= 73, n1= 8, n2= 12, n3= 7, n4= 9, n5= 7). E The dot plot shows RBD-specific IgG titers in individuals
that tested PCR+ (n = 32) prior to developing antibody responses or that did not have a PCR test at the time or within 2 weeks prior to seroconversion (n = 88; colors indicate the number of reported symptoms as in (C) and (D)). Statistical differences in (D) were assessed with the Kruskal–Wallis test followed by a post hoc Dunn’s correction for multiple testing. Source data are provided as a Source Data file.
thresholds for each antibody effector function that may ultimately
define quantitative antibody functional correlates of immunity in
future large-scale sero-surveillance cohorts. Together, these data
indicate that antibodies to other SARS-CoV-2 antigen specificities
may not compensate for low RBD-specific functional antibody
levels. Rather, it appears that a distinct titer threshold may track
with durable functional humoral immune responses to RBD and
other SARS-CoV-2 antigens.
The absence of high binding, neutralization, or antibody
effector function does not ultimately rule out protection from
re-infection, and speculation has emerged about the potential role of
T cells, rather than antibodies, as critical correlates of immunity
Fig. 2 SARS-CoV-2 titer heterogeneity over time. A The line graph shows the trajectory of the humoral immune response after thefirst antibody-positive timepoint (red lines show individuals that experience an increase in their antibody titers and gray shows individuals that exhibit stable or low-level waning) (n = 48). B The violin plots show the T0 and T1 RBD-specific IgG titers across individuals that experience an increase (reds) or experience stable or decreasing (grays).C The line plot shows the overall decay profiles once all samples were aligned based on study maximum observed titer (highest titer per individual observed in this study) (n = 32). The shades of blue show the individuals with the higher study maximum titers in the deep blue or lower observed titers in the light blue. Statistical differences between T0 and T1 within a group in (A) and (B) were assessed with a paired Wilcoxon-test and differences across groups and timepoints were assessed with the Kruskal–Wallis test followed by a post hoc Dunn’s correction for multiple testing. ****p < 0.0001 or exactp-values for not significant comparisons. Source data are provided as a Source Data file.
Fig. 3 A discrete titer cut-off tracks with functional SARS-CoV-2 humoral and T cell immunity. A The dot plot shows the distribution of study maximum observed antibody titers (highest titer per individual observed in this study) across the cohort, split based on median titers. Dark blue shading indicates all individuals above the median and the light blue shows all the individuals below the median (ntotal= 120; nlow= 60, nhigh= 60). B The violin plots show the
distribution of neutralizing antibody titers (dilution factor, left), antibody-dependent complement deposition (ADCD, meanfluorescence intensity, middle), and antibody-dependent neutrophil phagocytosis (ADNP, phagocytosis score, right)(nlow= 60, nhigh= 60) against SARS-CoV-2 S. C The violin plots show
the neutralization levels, ADCD, and ADNP (n = 15) from the maximum observed titers to the next timepoint (P + 1) in a subset of individuals in the high titer group.D The correlation heat maps (Spearman-correlation) show significant correlations (p < 0.05) between RBD, Spike (S), and Nucleocapsid (N) titers in the high titer (right;n = 15) and low titer (left; n = 26) groups. Statistical differences between two groups were assessed with a two-sided non-parametric Mann–Whitney test in (B) and paired Wilcoxon-test in (C). ****p < 0.0001 or exact p-values for not significant comparisons. Source data are provided as a Source Datafile.
in COVID-19, particularly in asymptomatic/mild disease
18. Thus,
given the emerging data pointing to the presence of T cell
immunity both in infected and uninfected populations
18,19, we
next assessed the presence of SARS-CoV-2 specific T cell
responses in our cohort. Following T-cell expansion culture,
responses to either SARS-CoV-2 spike protein (S) or
nucleocap-sids protein (N) overlapping peptide pools were quantified by
IFNγ ELISpot in 12 high and 10 low RBD antibody titer
individuals.
We observed SARS-CoV-2 specific T cells in 83 % (10 of 12) of
the individuals in the high titer group against at least one of the
tested peptide pools, and only 10% (1 of 10) of the individuals in
the low titer group had detectable T cell reactivity against the S
and N pools (Fig.
4
F, G). Conversely, S- and N-specific T cells
were readily detectable in hospitalized SARS-CoV-2 infected
individuals or symptomatic convalescent individuals
(Supple-mentary Fig. 3), while only 1 of 14 seronegative and 1 of the 16
pre-pandemic controls also possessed presumably cross-reactive
T cells
18. Finally, while individuals with asymptomatic infection
harbored low T cell numbers, a non-significant inverse trend was
observed between symptom and T cell numbers, pointing to a
potential role for T cells in disease attenuation (Supplementary
Fig. 3). These
findings demonstrate that SARS-CoV-2 specific
T cells are not detectable in all infected individuals, and are not
selectively enhanced among individuals with less robust humoral
immune responses. Instead, the data suggest that both T and B
cells evolve in a coordinated manner. A discrete titer cut off
marked the generation of persistent diverse functional humoral
and cellular immune responses in a subset of SARS-CoV-2
infected individuals that may collectively contribute to protection
upon re-exposure.
Discussion
The recent SARS-CoV-2 pandemic has left parts of the world
paralyzed. Our lack of understanding the predictors of disease
severity has overwhelmed our hospital systems. Waning antibody
titers
7,14and new cases of re-infection suggest that immunity may
only be transient and incomplete and new emerging viral variants
clearly have begun to escape natural immunity
4,20. However, for
many pathogens and vaccines, specific antibody levels or
func-tions represent the critical protective threshold of immunity
21.
While emerging data have begun to show that antibodies
repre-sent vital biomarkers that capture infection rates more
compre-hensively than nucleic acid-based testing
13, the precise levels of
antibodies associated with protection from re-infection remain
unclear. Probing the evolution of the humoral immune responses
in a community-based serosurveillance study, here we observed
that while the SARS-CoV-2 specific humoral immune response is
Fig. 4 A discrete titer cut-off tracks with functional SARS-CoV-2 humoral and T cell immunity. A, B Theflower plots summarize titer and functional data against SARS-CoV-2 RBD, S or N antigen in high or low titer group at maximum observed titers (A) and the following timepoint (B) (the petal color corresponds to features as indicated; the univariate data are also shown in Fig.3and Supplementary Fig. 2).C–E Antibody-dependent virus neutralization (C), ADCD (D) or ADNP (E) by ELISA RBD titer. The black dotted line indicates the median split (0.45μg/ml) and the red dashed line the threshold titer for the individual functions.F, G The violin plots show the number of spots forming cells (SFC) of interferon-gamma (IFNγ) secreting T cells after overnight stimulation with either an overlapping peptide pool covering SARS-CoV-2 S (F) or N (G) in individuals with low titers (light blue,n = 10), high titers (dark blue,n = 12) or negative controls (white, n = 14). Statistical differences between two groups were assessed with a two-sided non-parametric
largely stable for several months, the presence of antibodies does
not automatically track with sustained functional cellular or
humoral immunity to SARS-CoV-2 that may be required for
long-term protection against infection. Coupled to large
re-infection serosurveillance cohorts, able to also capture viral loads
and inflammatory status, the precise cut-off of this titer may be
ascertained and used to guide vaccine prioritization.
Antibody titers have been linked intimately to disease severity
5,
leading some to argue that antibodies are less critical for disease
control. However, emerging data point to the functional quality,
rather than the quantity of the humoral immune response, as a
correlate of immunity
22,23. For example, vaccine-induced
anti-bodies lacking the ability to recruit NK cells or monocytes fail to
protect against malaria challenge
24. While previous studies have
noted a robust correlation between RBD-specific antibodies and
neutralization
17, not all antibodies against the RBD are
neu-tralizing
25. Furthermore, neutralization also accrues with
SARS-CoV-2 disease severity
26. Thus, low titer antibodies emerging
following asymptomatic or mild disease may not necessarily
possess the key footprints required to block viral infection.
Likewise, innate immune recruiting antibodies were also only
observed at titers above 0.1
μg/ml (Fig.
4
), likely due to the
requirement of sufficient antibodies to form immune complexes
that cluster Fc-receptors and drive cellular activation
27. Thus, a
minimal titer may mark the evolution of a sufficiently broad
neutralization footprint and the generation of sufficient
anti-bodies to recruit antibody effector function.
The immune decision to generate a robust or weak humoral
immune response may occur at the time of the host-pathogen
interaction, dependent on the level of viral challenge, or
inflam-matory cues. Low-level challenge may elicit only weak, poorly
functional antibodies. Conversely, high-burden challenge may
lead to the generation of a potent and functionally robust
humoral immune response, programmed to respond aggressively
upon re-encounter with the pathogen. The immune decision may
also occur at the level of host genetics or gender, where human
leukocyte-antigens (HLA) alleles and sex have been clearly linked
with differential response to vaccination
28,29. While we were
underpowered to probe these differences, and lacked qPCR viral
load levels early in the pandemic, future large-scale re-infection
studies will have the potential to probe the demographic,
inflammatory, and viral modulators of immunity to SARS-CoV-2,
beyond the force of exposure or symptomatology.
The presence of cross-reactive T cell immunity across both
pre-pandemic and otherwise healthy individuals have raised the
possibility that antibodies developed against endemic common
coronaviruses may confer complementary or compensatory
immunity in individuals that experience asymptomatic or mild
infection
30. However, using a highly sensitive T cell expansion
analysis, SARS-CoV-2 specific T cell responses were solely
observed in individuals that elicited broad functional humoral
immune responses. These data point to limited evidence for a
compensatory T cell signature in asymptomatic/mild disease.
Conversely, given that robust T cell immune responses were
observed in convalescent subjects with symptomatic infection,
these data suggest that T and B cell responses likely evolve
syn-chronously, driven by symptomatic infection (Supplementary
Fig. 3). However, whether additional tissue-resident cells may
exist and persist in the respiratory tract of asymptomatic
indivi-duals that generate lower antibody responses remains unclear.
Unlike natural asymptomatic/mild infection, SARS-CoV-2
vaccines appear to drive robust humoral immune responses,
nearly all eliciting neutralization at levels observed in
sympto-matic convalescents after two rounds of immunization
31–34and
some able to drive the co-evolution of Fc-effector function
10, both
linked to protection from SARS-CoV-2 challenge
20. The need for
multiple rounds of immunization suggests that more antigen or
boosting may be required to push the immune system to generate
functional immunity that may be required for protection. Thus,
vaccine boosting, unlike mild/asymptomatic natural infection, is
likely to result in the induction of broad robust protective
immunity. Moreover, several vaccine platforms also induce T cell
immunity, which may not be necessary for vaccine-induced
sterilizing protection but may cooperate with antibodies to drive
control and clearance should infection occur. The data presented
here point to a critical functional immunologic threshold—simply
captured at the level of antibody titers—that may exist in natural
infection, that may guide surveillance efforts and provide insights
for the prioritization of vaccine campaign efforts to immunize
those most vulnerable to re-infection.
Methods
Cohort. The parent cohort study was launched in mid-April 2020, providing an opportunity for industry employees to volunteer for COVID-19 testing and sur-veillance (Space Exploration Technologies Corp.). All employees were invited to participate by email. There were no exclusion criteria. Upon obtaining informed consent, blood samples were collected approximately every 39.7 days (standard deviation 13.8 days) and participants completed a study survey at the initiation of the study and thereafter, including the collection of COVID-19 related symptoms. The median age of the seropositive population was 31 years (range 22–71 years) and 92% were males with an average BMI of 28.0 kg/m2(range 18.5–42.4 kg/m2)
resembling the characteristics of the parent cohort (median age: 32 years, range: 18–71 years, 84.3% male (3582/4245 individuals with reported gender) and BMI of 27.0 kg/m2(range 15.7–60.9 kg/m2). The study protocol was approved by the
Western Institutional Review Board. The use of de-identified data and biological samples was approved by the Mass General Brigham Healthcare (previously Partners Healthcare) Institutional Review Board. All participants provided written informed consent.
RBD-IgG ELISA. Serological analyses were performed using an in-house ELISA that detects IgG against the RBD of the SARS-CoV-2 spike glycoprotein (provided by Aaron Schmidt) using a previously described method35. The assay was further
evaluated in a blinded proficiency study against several EUA approved ELISAs, demonstrating >99.5% specificity11,35. Briefly, 384-well plates were coated with 0.5
μg/ml of RBD for 1 h at 37 °C in bi-carbonate buffer. The plates were then washed and plasma samples were added at a 1:100 dilution in duplicate for 1 h at 37 °C, washed and then detected with a secondary anti-human-IgG-HRP (Bethyl Laboratories). The secondary was washed away after 1 h, and the colorimetric detector was added (TMB; Thermo Fisher) for 5 min, the reaction was stopped and the absorbance was acquired at 450/570 nm on a Tecan infinite M1000pro plate reader and Tecan-i-control V.3.4.2 software (Biotek Instruments). In order to convert raw OD values into concentration (μg/ml) a 12 two-fold dilution curve (starting at 625 ng/ml) of an SARS-CoV-2 RBD-specific monoclonal IgG1 (clone: CR3022) was included onto every ELISA plate. The sample concentration was interpolated from the resulting standard curve, as previously described35. A
posi-tive cutoff was equal to the mean of the OD-convertedμg/ml values of the negative control wells on the respective plate plusfive times the standard deviation of the concentration from negative plasma samples.
Antigen biotinylation. For all antibody-based assays, SARS2-CoV2-nucleocapsid (N) (Aalto Bio Reagents Ltd) and SARS2-CoV2-Spike (S) (provided by Eric Fisher) antigen were biotinylated using Sulfo-NHS LCLC biotin (Thermo Fisher) and excessive biotin removed with ZebaSpin desalting columns (7 KDa cut-off, Thermo Fisher).
IgG subclass, isotype, and FcγR binding. SARS-CoV-2 specific antibody subclass and isotypes, and FcγR binding was analyzed using a custom Luminex multiplexed assay36. SARS2-CoV2-RBD, SARS2-CoV2-N, and SARS2-CoV2-S were coupled to
magnetic Luminex beads (Luminex Corp, TX, USA) by carbodiimide-NHS ester-coupling (Thermo Fisher). Dilution curves were performed on pooled samples from the cohort to determine dilutions in the linear range for each detection reagent. Coupled beads were then incubated with different plasma dilutions (between 1:100 and 1:1000 depending on the secondary reagent) for 2 h at room temperature in 384-well plates (Greiner Bio-One, Germany). Unbound antibodies were washed away and PE-conjugated antibody (Southern Biotech, AL, USA, see Life Science Reporting Summary) at a 1:100 dilution used to detect IgG1 (#9054-09), IgG3 (#9210-(#9054-09), IgM (#9020-09) or IgA1 (#9130-(#9054-09), respectively. For the FcγR3b binding, a PE-Streptavidin (Agilent Technologies, CA, USA) coupled recombinant biotinylated human FcγR3b protein (Duke Protein Production Facility) was used as a secondary probe. After 1h incubation, the excessive sec-ondary reagent was washed away and the relative antibody concentration per antigen determined on an IQue analyzer (IntelliCyt, NM, USA). Samples
with mean signals plusfive times the standard deviation of the PBS-control wells were considered as positive.
ADCD. Antibody-Dependent-Complement-Deposition was assessed as described previously37. In brief, biotinylated antigens were coupled to redfluorescent
Neu-travidin beads (Thermo Fisher). Plasma antibodies were diluted 1:10 in 0.1% BSA and incubated with the coupled antigen beads for 2 h at 37 °C. Beads were washed with PBS and incubated with complement factors from guinea pig (Cedarlane) at a 1:100 dilution in Gelatin Veronal Buffer (with Mg & Ca) (Boston BioProducts) for 20 min at 37 °C. The complement reaction was then stopped by washing with 15 mM EDTA in PBS. C3 deposition on the beads was detected with a 1:100 dilution of a FITC conjugated anti-guinea pig C3 antibody (MP Biomedical, # 0855385) and relative C3 deposition was analyzed on an iQue analyzer.
ADNP. Antibody-Dependent-Neutrophil-Phagocytosis was analyzed as described previously38. Briefly, biotinylated antigens were coupled to green fluorescent
Neutravidin beads (Thermo Fisher) and immune complexes were formed by incubating a 1:100 plasma dilution with the beads for 2 h at 37 °C in 96-well plates (Greiner Bio-One). Human neutrophils were obtained from ACK lysed blood from healthy donor whole blood and 2 × 10⁵cells were incubated with the formed
immune complexes. After 1 h at 37 °C, cells were washed, and surface stained with an anti-human CD66b antibody (Biolegend, #305112) at a 1:100 dilution. Neu-trophil phagocytosis was analyzed on an iQueflow cytometer and a phagocytosis score was calculated as the product of the frequency of bead positive CD66b neutrophils and the meanfluorescence of the bead positive cells using ForeCyt Standard Edition 8.1 software (Supplementary Fig. 4).
SARS-CoV2 antibody-mediated virus neutralization. The ability of antibodies to neutralize the virus was assessed on a 2019-nCoV pseudovirus neutralization assay, as described previously39. In brief, HEK293T cells were transfected with pcDNA3.1
(-)-hACE2 (Addgene). 12 h post transfection; the HEK293T/hACE2 cells were seeded in 96-well plates (2 × 10⁴cells/well) and incubated overnight. Heat (56 °C,
30 min) inactivated plasma samples were serially diluted and mixed with 50μl of pseudoviruses, incubated at 37 °C for 1 h and added to the HEK293T/hACE2 cells. Forty-eight hours after infection, cells were lysed in Steady-Glo Luciferase Assay detection (Promega). A standard quantity of cell lysate was used in the luciferase assay with luciferase assay reagent (Promega) according to the manufacturer’s protocol.
PBMC isolation and T cell expansion. PBMCs were isolated and frozen from EDTA blood within 24 h after collection using Sepmate tubes (Stemcell Technol-ogy). Before the ELISPOT assay, PBMC samples were thawed and cultured in R10-50 media (RPMI media supplemented with 10% FCS, penicillin/streptavidin, 2 mM L-Glutamine, 10 mM HEPES buffer, and 50 U/ml IL-2) containing 0.1μg/ml anti-human CD3 (clone: 12F6, Absolute Antibody Ltd., #AB00640-2.0). Cells were inspected daily and R10-50 (w/o anti-CD3) media was added/replaced as needed. After 8 days, R10-50 media was replaced with R10 media (no IL-2 or anti-CD3) and cells were rested overnight.
ELISPOT. PVDV membrane plates (Millipore, MA, USA) were coated with anti-human IFNγ antibody (clone: 1-DK1, Mabtech Inc, #3420-3-1000, conc.: 2 μg/ml) overnight. Expanded and overnight rested PBMC samples (see above) were counted and 3 × 10⁵PBMCs were added per well with S or N overlapping peptide
pools (both Miltenyi, Germany) at 1.25μg/ml peptide, and incubated overnight. Medium alone was used as a negative control. Pools of 23 MHC-I restricted peptides from human Cytomegalovirus, Eppstein Barr virus and Influenza virus (CEF, Anaspec Inc.) and 35 MHC-II restricted peptides from human Cytomega-lovirus, Epstein Barr virus, Influenza virus, Tetanus toxin, and Adenovirus 5 (CEFTA, Mabtech Inc.) were used as positive controls. IFNγ secretion was detected with a biotinylated anti-human IFNγ antibody (clone: 7-B6-1, Mabtech Inc, #3420-6-1000, conc. 0.5μg/ml) and ALP conjugated-Streptavidin (Mabtech Inc). Spots were developed with 1-Step BCIP/NBT-plus reagent (Mabtech Inc.) for 20 min. Membranes were dried and spots were analyzed and counted on an ImmunoSpot CTL analyzer. A response was considered positive only if there were≥50 SFCs/106
PBMC after subtracting the value of the matched negative control.
Statistics. Microsoft Excel 365 was used to compile experimental data and patient information. Violin plots, bar graphs, and x-y plots were generated in Graph Pad Prism V.8. Statistical differences between two groups were calculated using a two-sided Mann–Whitney test or Wilcoxon test for paired comparisons. To compare multiple groups, a Kruskal–Wallis test was used followed by the Dunn's method correcting for multiple comparisons in Graph Pad Prism V.8 (significance levels: *p < 0.05, **p < 0.01, ***p < 0.001, ****p ≤ 0.0001). Flower plots were visualized with the ggplot2 package (v.3.3) in R (v.4.0.1) and RStudio (v.1.3) using Z-scored values.
Reporting summary. Further information on research design is available in the Nature Research Reporting Summary linked to this article.
Data availability
All relevant data are included in this manuscript. No data was stored externally. Source data are provided with this paper.
Code availability
There was no specific custom code used in this manuscript.
Received: 10 November 2020; Accepted: 20 January 2021;
References
1. Robbiani, D. F. et al. Convergent antibody responses to SARS-CoV-2 in convalescent individuals. Nature 584, 437–442 (2020).
2. Iyer, A. S. et al. Persistence and decay of human antibody responses to the receptor binding domain of SARS-CoV-2 spike protein in COVID-19 patients. Sci Immunol. eabe0367 (2020).
3. To, K. K. et al. COVID-19 re-infection by a phylogenetically distinct SARS-coronavirus-2 strain confirmed by whole genome sequencing. Clin. Infect. Dis. ciaa1275 (2020).
4. Tillett, R. et al. Genomic evidence for a case of reinfection with SARS-CoV-2 SSRN (2020).
5. Long, Q. X. et al. Antibody responses to SARS-CoV-2 in patients with COVID-19. Nat. Med. 26, 845–848 (2020).
6. Oran, D. P. & Topol, E. J. Prevalence of asymptomatic SARS-CoV-2 infection: a narrative review. Ann. Intern. Med. 173, 362–367 (2020).
7. Long, Q. X. et al. Clinical and immunological assessment of asymptomatic SARS-CoV-2 infections. Nat. Med. 26, 1200–1204 (2020).
8. Gunn, B. M. & Alter, G. Modulating antibody functionality in infectious disease and vaccination. Trends Mol. Med. 22, 969–982 (2016).
9. Yu, J. et al. DNA vaccine protection against SARS-CoV-2 in rhesus macaques. Science 369, 806–811 (2020).
10. Mercado, N. B. et al. Single-shot Ad26 vaccine protects against SARS-CoV-2 in rhesus macaques. Nature 586, 583–588 (2020).
11. Nilles, E. J. et al. Evaluation of two commercial and two non-commercial immunoassays for the detection of prior infection to SARS-CoV-2. Preprint athttps://www.medrxiv.org/content/10.1101/2020.06.24.20139006v2
(2020).
12. Slifka, M. K. & Ahmed, R. Long-term humoral immunity against viruses: revisiting the issue of plasma cell longevity. Trends Microbiol. 4, 394–400 (1996).
13. Gudbjartsson, D. F. et al. Humoral immune response to SARS-CoV-2 in Iceland. N. Engl. J. Med. 383, 1724–1734 (2020).
14. Ibarrondo, F. J. et al. Rapid decay of anti-SARS-CoV-2 antibodies in persons with mild Covid-19. N. Engl. J. Med. 383, 1085–1087 (2020).
15. Loos, C. et al. Evolution of early SARS-CoV-2 and cross-coronavirus immunity. mSphere 5, e00622 (2020).
16. Sariol, A. & Perlman, S. Lessons for COVID-19 immunity from other coronavirus infections. Immunity 53, 248–263 (2020).
17. Amanat, F. et al. A serological assay to detect SARS-CoV-2 seroconversion in humans. Nat. Med. 26, 1033–1036 (2020).
18. Grifoni, A. et al. Targets of T cell responses to SARS-CoV-2 coronavirus in humans with COVID-19 disease and unexposed individuals. Cell 181, 1489–1501.e1415 (2020).
19. Braun, J. et al. SARS-CoV-2-reactive T cells in healthy donors and patients with COVID-19. Nature 587, 270–274 (2020).
20. Chandrashekar, A. et al. SARS-CoV-2 infection protects against rechallenge in rhesus macaques. Science 369, 812–817 (2020).
21. Plotkin, S. A. Vaccines: correlates of vaccine-induced immunity. Clin. Infect. Dis. 47, 401–409 (2008).
22. Lu, L. L., Suscovich, T. J., Fortune, S. M. & Alter, G. Beyond binding: antibody effector functions in infectious diseases. Nat. Rev. Immunol. 18, 46–61 (2018). 23. Plotkin, S. A. Correlates of protection induced by vaccination. Clin. Vaccin.
Immunol. 17, 1055–1065 (2010).
24. Suscovich, T. J. et al. Mapping functional humoral correlates of protection against malaria challenge following RTS,S/AS01 vaccination. Sci. Transl. Med. 12, eabb4757 (2020).
25. Yuan, M. et al. Structural basis of a shared antibody response to SARS-CoV-2. Science 359, 1119–1123 (2020).
26. Liu, L. et al. High neutralizing antibody titer in intensive care unit patients with COVID-19. Emerg. Microbes Infect. 9, 1664–1670 (2020).
27. Vidarsson, G., Dekkers, G. & Rispens, T. IgG subclasses and allotypes: from structure to effector functions. Front. Immunol. 5, 520 (2014).
28. Klein, S. L., Jedlicka, A. & Pekosz, A. The Xs and Y of immune responses to viral vaccines. Lancet Infect. Dis. 10, 338–349 (2010).
29. Poland, G. A., Ovsyannikova, I. G. & Kennedy, R. B. Personalized vaccinology: a review. Vaccine 36, 5350–5357 (2018).
30. Sette, A. & Crotty, S. Pre-existing immunity to SARS-CoV-2: the knowns and unknowns. Nat. Rev. Immunol. 20, 457–458 (2020).
31. Jackson, L. A. et al. An mRNA vaccine against SARS-CoV-2 - preliminary report. N. Engl. J. Med. 383, 1920–1931 (2020).
32. Folegatti, P. M. et al. Safety and immunogenicity of the ChAdOx1 nCoV-19 vaccine against SARS-CoV-2: a preliminary report of a phase 1/2, single-blind, randomised controlled trial. Lancet 396, 467–478 (2020).
33. Keech, C. et al. Phase 1-2 trial of a SARS-CoV-2 recombinant spike protein nanoparticle vaccine. N. Engl. J. Med. 383, 2320–2332 (2020).
34. Mulligan, M. J. et al. Phase I/II study of COVID-19 RNA vaccine BNT162b1 in adults. Nature 586, 589–593 (2020).
35. Roy, V. et al. SARS-CoV-2-specific ELISA development. J. Immunol. Methods 484, 112832 (2020).
36. Brown, E. P. et al. Optimization and qualification of an Fc Array assay for assessments of antibodies against HIV-1/SIV. J. Immunol. Methods 455, 24–33 (2018).
37. Fischinger, S. et al. A high-throughput, bead-based, antigen-specific assay to assess the ability of antibodies to induce complement activation. J. Immunol. Methods 473, 112630 (2019).
38. Karsten, C. B. et al. A versatile high-throughput assay to characterize antibody-mediated neutrophil phagocytosis. J. Immunol. Methods 471, 46–56 (2019).
39. Atyeo, C. et al. Distinct early serological signatures track with SARS-CoV-2 survival. Immunity 53, 524–532.e4 (2020).
Acknowledgements
We thank Nancy Zimmerman, Mark and Lisa Schwartz, an anonymous donor (financial support), Terry and Susan Ragon, and the SAMANA Kay MGH Research Scholars award for their support. We acknowledge support from the Ragon Institute of MGH, MIT, and Harvard, the Massachusetts Consortium on Pathogen Readiness (MassCPR), the NIH (3R37AI080289-11S1, R01AI146785, 01, U19AI135995-02, U19AI42790-01, 1U01CA260476– 01, CIVIC75N93019C00052), the Gates Foundation Global Health Vaccine Accelerator Platform funding (OPP1146996 and INV-001650), the Musk Foundation, and the Translational Research Institute for Space Health through NASA Cooperative Agreement NNX16AO69A. D.A.L. was partially supported by the National Institute for Allergy and Infectious Disease (U19 AI135995). S.M.S. was partially sup-ported by the US Food and Drug Administration (HHSF223201810172C). We would also like to thank Eric Fischer for S protein production efforts and Jared Feldman, Blake Marie Hauser, Tim Caradonna, and Aaron Schmidt for generating receptor-binding domain antigen.
Author contributions
Y.C.B., S.F., S.M.S., D.A.L., and G.A. analyzed and interpreted the data. Y.C.B., S.F., C.A., M. J. Gorman, A.L.Z., J.K., J.S.B., and M.S. performed Systems Serology and ELISA assays. J.Y., MG, and D.H.B. performed the neutralization assay. Y.C.B., Z.C., and B.D.J. performed and analyzed T cell experiments. M. J. Gluck, S.B., J.R., E.P., B.M., M.S.A., M.A.H., G.J., E.W.B., E.R.M., A.S.M., and E.J.N. managed sample and data collection. E.R.M., A.S.M., E.J.N., and G.A. designed the study, Y.C.B., S.F., S.M.S., D.A.L., and G.A. drafted the manuscript. All authors critically reviewed the manuscript.
Competing interests
G.A. is a founder of Seromyx Systems Inc. P.C. S. is a co-founder of, a shareholder in, and advisor to Sherlock Biosciences Inc, as well as a Board member of and shareholder in Danaher Corporation. M. J. Gluck, S.B., Y.H., J.R., E.P., B.M., A.S.M., and E.R.M. are employees of Space Exploration Technologies Corp. All other authors have declared that no conflict of interest exists.
Additional information
Supplementary informationThe online version contains supplementary material available athttps://doi.org/10.1038/s41467-021-21336-8.
Correspondenceand requests for materials should be addressed to A.S.M., D.A.L., E.J.N. or G.A.
Peer review informationNature Communications thanks the anonymous reviewers for their contribution to the peer review of this work.
Reprints and permission informationis available athttp://www.nature.com/reprints
Publisher’s note Springer Nature remains neutral with regard to jurisdictional claims in published maps and institutional affiliations.
Open Access This article is licensed under a Creative Commons Attribution 4.0 International License, which permits use, sharing, adaptation, distribution and reproduction in any medium or format, as long as you give appropriate credit to the original author(s) and the source, provide a link to the Creative Commons license, and indicate if changes were made. The images or other third party material in this article are included in the article’s Creative Commons license, unless indicated otherwise in a credit line to the material. If material is not included in the article’s Creative Commons license and your intended use is not permitted by statutory regulation or exceeds the permitted use, you will need to obtain permission directly from the copyright holder. To view a copy of this license, visithttp://creativecommons.org/ licenses/by/4.0/.
© The Author(s) 2021