1
Analysis of the Materials and Energy Cost to Manufacture Graphene by Roll-Based Chemical Vapor Deposition
by
Henry M. Hanlon
SUBMITTED TO THE DEPARTMENT OF MECHANICAL ENGINEERING IN PARTIAL FULFILLMENT OF THE REQUIREMENTS FOR THE DEGREE OF
BACHELOR OF SCIENCE IN MECHANICAL ENGINEERING AT THE
MASSACHUSETTS INSTITUTE OF TECHNOLOGY MAY 2020
© 2020 Henry M. Hanlon. All rights reserved.
The author hereby grants to MIT permission to reproduce and to distribute publicly paper and electronic copies of this thesis document in whole or in part in any medium
now known or hereafter created.
Signature of Author: _____________________________________________________ Department of Mechanical Engineering
May 08, 2020 Certified by: ____________________________________________________________ Rohit Karnik Professor of Mechanical Engineering Thesis Supervisor Accepted by: ___________________________________________________________ Maria Yang Professor of Mechanical Engineering Undergraduate Officer
2
Analysis of the Materials and Energy Cost to Manufacture Graphene by Roll-Based Chemical Vapor Deposition
by
Henry M. Hanlon
Submitted to the Department of Mechanical Engineering on May 08, 2020 in Partial Fulfillment of the Requirements for the Degree of Bachelor of Science in Mechanical
Engineering ABSTRACT
A single layer of graphite, called graphene, has immense promise as a material. Despite being essentially two-dimensional, graphene is stronger than steel in tension. The
material has extremely high electron mobilities even at room temperature. It can be used as a filter and has the added benefit of being transparent. Despite this impressive resume, graphene remains the topic of scientific papers and not dinner tables. One of the reasons for this is the difficulty and associated costs of mass manufacture. This paper proposes parameters for the production of graphene via roll-to-roll chemical vapor deposition, through the lens of eight case study experiments. Once the parameters are understood, the paper seeks to provide variable cost estimates, focused mostly on the cost of materials and energy required for this process. The analysis reveals that cost of production depends heavily on the substrate – commonly copper (typically $40 m-2) –
and specifically the thickness and quality or purity of the metal. Considering process parameters based on literature reports of roll-based graphene synthesis, the costs of energy and gasses are significantly less, approximately $1.74 and $1.11 per m-2,
respectively. The equipment based on currently available prices is approximately $ 1 m -2. Future experiments or for-profit production should explore different substrates, the
recycling of copper substrates, optimization of the gas flow rates and furnace insulation, or multi-side production of graphene.
Thesis Supervisor: Rohit Karnik
3 Table of Contents Abstract 2 Table of Contents 3 Introduction 4 Background 4 Discussion 8 Conclusion 17 References 18
4
1. Introduction:
Prior to 2004, many experiments and postulates suggested that strictly two-dimensional materials were too thermodynamically unstable to exist. [1] While atomic monolayers did exist, they were part of larger 3D structures, such as carbon nanotubes. Andre Geim and Kostya Novoselov would change all that. In their 2004 paper, they detailed a
process of successive mechanical cleavage accomplished through adhesive tape that isolated sheets of graphene from graphite. [2] Their discovery of a stable, atom-thick material was notable in and of itself. However, they quickly discovered a slew of intriguing material properties that has ignited a robust study and production of graphene.
Graphene monolayers of high quality can approach a room-temperature electron mobility of 2.5×105 cm2V-1s-1, a figure about an order of magnitude more than
commercially available silicon. [3] Graphene possesses a Young’s Modulus of
approximately a terapascal. [4] In terms of thermal conductivity, sheets can reach about 5 W/m-K at room temperature. [5] This “miracle material” accomplishes all of this while being transparent, and of course, no more than an atom thick. Naturally, these
properties have applications in a broad array of fields, from field-effect transistors, to gas detectors, electrodes, photovoltaic cells, LEDs, LCDs and antibacterial paper. [6] As the study of graphene matures, it is easy to imagine that graphene’s possible
applications will only grow.
The demand for graphene is high, what remains outstanding is how to achieve the requisite levels of supply. While the adhesive tape method has appealing simplicity, it is time consuming and tends to produce graphene flakes of varying thickness. [7] There are promising methods of manufacture through additional mechanical means and also through various flavors of chemical vapor deposition. Even after the ideal production method is established though, if graphene is to live up to its plethora of applications, we must understand its cost of manufacture. This thesis seeks to provide a survey of existing production technologies, while maintaining focus on roll-to-roll chemical vapor deposition and its projected theoretical cost minima. The thesis will focus on cost of materials, energy, and operational costs based off process parameters in relation to the desired quality and size of graphene.
2. Background:
2.1 Graphene and Its Applications:
Mono-layer graphite, commonly known as graphene, is a hexagonal lattice of carbon atoms, one atom thick. [6] It is one allotrope of carbon at standard temperature and pressure, alongside charcoal and diamond. Graphene itself has many other forms it can take. Naturally, it is most found stacked in the form of graphite, but it is also a
subcomponent of “0D” fullerenes and “1D” nanotubes. [8] The carbon atoms are joined with sp2 bonds of length 1.42 angstroms. [6]
5
As discussed in the introduction, the unique material properties of graphene have initiated what is akin to a high tech “gold rush.” The original paper by Geim and
Novoselov has over 15,000 citations and is one of the top 100 most cited papers of all time. [9] Patent offices have seen a surge in intellectual property filings regarding the uses and applications of graphene. Laboratories dedicated to the study of graphene are well funded by research institutions, nations and corporations alike.
One of the most alluring properties is the aforementioned room temperature electron mobility of approximately 2.5×105 cm2V-1s-1. Electron mobility is essentially a measure
of how fast charge, and therefore signals, can be sent through semiconductors.
Graphene could hold answers on how to make circuits faster. There are a few catches though; namely that, unlike silicon, graphene is a zero-bandgap material. [6] Chemical doping with nitrogen or boron has had some promising results, but it is not an exact science as of yet. [8] An additional wrinkle is that the substrates that graphene is typically put on after production, such as polymethyl methacrylate or polyethylene terephthalate, can contaminate the graphene and alter its electrical properties. [10] Thermal annealing and additional post-processing is occasionally required. Once reliable doping strategies are known, graphene will quickly be of use in circuits as a transistor, or as a supercapacitor. The monolayer aspect of graphene means that any component that it is made into will likely be smaller than any competitor material. The potential application of graphene in circuits is probably the best known, however, there are many other viable ways of using this material. Graphene has been proposed as a semi-permeable membrane for use in water desalination. Fluorinated graphene monolayer membranes have been found to have a 10000 times higher water flux than cellulose triacetate membranes currently in used. [8] Graphene with pores is also a good salt rejector, thanks to its consistent tight-knit atomic structure. These two facts in concert mean that graphene has tremendous opportunity as a primary membrane in forward osmosis processes.
Graphene has also been proposed in new DNA sequencing methods. Nucleotides each have a unique electronic signature. Passing DNA strands through four graphene
nanopores and measuring the resultant currents could allow for nucleotides to be discriminated far faster than the Sanger Technique. [8] This method relies on the fact that graphene is an atomic monolayer, and thus will not be under the effect of many nucleotides at once, as well as on its high conductivity and tensile strength.
Graphene holds potential applications in the field of gas separation. Membranes made of graphene outperformed traditional filters of polymer and silica for a range of gases including hydrogen, helium, carbon dioxide, oxygen and nitrogen. [8] Functionalizing the membrane increases selectivity even more.
There are a great deal more potential applications of this material: SARS-COVID 19 has a virion width on the order of several hundred nanometers, and graphene has been suggested as a potential mask replacement [11], though rolling this out at time of publication is dubious; graphene can also serve as a durable and hyper-responsive
6
capacitive touch screen [12]; a component of electromagnetic shielding film [13]; and high sensitivity gas detector [6]. The gas molecule detection is interesting as it relates to the manufacturing of graphene. Part of the reason that manufacturing is so challenging is that tiny defects dramatically affect the quality of the product. Therefore, it follows that well-produced graphene would be able to identify these defects later on in life.
2.2 Methods of Manufacturing Graphene:
In 2009, a method of mass-producing graphene was sorely needed. Several ideas came about namely: mechanical cleavage; graphitization of single crystal Si; and eventually chemical vapor deposition (CVD). Mechanical cleavage was the method used by Geim and Novoselov to first isolate a graphite monolayer. As discussed, it involved iterative adhesive tape separation. This method was obviously quite time consuming, and labor intensive. [14] Ruoff et al. used an atomic force microscope tip to obtain layers of highly ordered pyrolytic graphene. [15] Additional methods of sectioning and cleavage included diamond wedges. Jayasena et al proposed a method using high frequency oscillations along the wedge to increase the yield of monolayers. [16]
Ultimately though, mechanical cleavage remained difficult to scale.
The graphitization of single crystal SiC has been used for quite some time, but it does not create isolated monolayers. This process leverages high-temperature vacuum decomposition of the substrate and the sublimation of part of the Si. [17] The result is a lattice of carbon atoms with a structure very similar to that of graphene, however they are still covalently bonded to the silicon, and therefore it is not technically graphene. [17] In some ways, this method is almost more ready to be used to create circuit parts, since the graphene is already on an insulating substrate, by virtue of being on a silicon wafer. Additionally, the silicon acts as a sort of n-type doping agent. [17] Yet, the electron mobilities are much lower than pure monolayers.
Li et al. would disrupt the field by introducing a method using chemical vapor deposition to grow graphene on metal substrates. [14] After this initial experiment, a period of intense radiative innovation followed, with a great deal of papers being published that touted faster ways to produce higher quality graphene. The most important of such modifications is the switch from batch CVD to roll-to-roll (R2R) synthesis. In batch synthesis, the copper foils are pre-cut, and all actions are performed on individual pieces that are transferred between processes. Manufacturing is thus cut into sections based off of machine capacity and is not fluid. R2R involves a continuous spool of substrate being rolled through various parts of a sort of assembly line. The spool moves at a constant velocity, and graphene is being produced continuously. True to its name, the process begins a roll of copper foil and ends with a roll of graphene, which in the case of Li et al., is packaged in polyethylene terephthalate (PET). [14] The ultimate delivery mechanism of the graphene varies, and PET is just one of a slew of options. If graphene is to be mass-manufactured, it will likely be done via a R2R process. Indeed, Kidambi et al. sounded off to that effect: “the need for such large areas necessitates the development of continuous (e.g., roll-to-roll) graphene CVD methods.” [18]
7 2.3 R2R CVD Case Studies:
There have been many demonstrations of R2R CVD based graphene production. None of the processes have approached actual mass manufacture: some steps might still require inordinate human labor; quantities may be too small for profitability; and quality may not be usable for all applications of graphene. However, these experiments are the closest thing to mass manufacture of graphene that is possible to study at present moment. Additionally, the key parameters that these experiments have selected can elucidate future process parameters even if other factors change.
The R2R experiments that were considered were the following. In addition to these papers, many batch synthesis experiments provided background information.
• “Roll-to-roll production of 30-inch graphene films for transparent
electrodes” [19] by Sukang Bae, Hyeong Kim, Youngbin Lee, Xiangfan Xu, Jae-Sung Park, Yi Zheng, Jayakumar Balakrishnan, Tian Lei, Hye Ri Kim, Young Il Song, Young-Kin Kim, Kwang S. Kim, Barbaros Ӧzyilmaz, Jong-Hyun Ahn, Byung Hee Hong and Sumio Lijima. Published in Nature Nanotechnology in 2010. Hereafter referred to as: Bae et al.
• “Continuous roll-to-roll growth of graphene films by chemical vapor deposition” [20] by Thorsten Hesjedal. Hereafter referred to as: Hesjedal. • “Production of a 100-m-long high-quality graphene transparent conductive
film by roll-to-roll chemical vapor deposition and transfer process” [21] by Toshiyuki Kobayashi, Koji Kadono, Shinji Hayazaki and Yukiko Mizuguchi.
Published in Applied Physics Letters in 2011. Hereafter referred to as: Kobayashi et al.
• “Growth of continuous graphene by open roll-to-roll chemical vapor
deposition” [22] by Guofang Zhong, Xingyi Wu, Lorenzo D’Arsie, Kenneth B.K. Teo, Nalin L. Rupesinghe, Alex Jouvray, and John Robertson. Published in Applied Physics Letters in 2016. Hereafter referred to as: Zhong et al.
• “Roll-to-roll Graphene Synthesis by Using Microwave Plasma Chemical Vapor Deposition at Low Temperature” [23] by Takatoshi Yamada, Masatou Ishihara, Jaeho Kim, Masataka Hasegawa and Sumio Iijima. Published in Materials Research Society in 2012. Hereafter referred to as: Yamada et al. • “A Scalable Route to Nanoporous Large-Area Atomically Thin Graphene
Membranes by Roll-to-Roll Chemical Vapor Deposition and Polymer Support Casting” [18] by Piran Kidambi, Dhanushkodi Mariappan, Nicholas Dee, Andrey Vyatskikh, Sui Zhang, Rohit Karnik, and A. John Hart. Published in Applied Materials and Interfaces in 2018. Hereafter referred to as: Kidambi et al. • “Process Optimization of graphene growth in a roll-to-roll plasma CVD
system” [24] by Majed Alrefae, Anurag Kumar, Piyush Pandita, Aaditya
Candadai, Ilias Bilionis, and Timothy Fisher. Published in AIP Advances in 2017. Hereafter: Alrefae et al.
• “High-speed roll-to-roll manufacturing of graphene using a concentric tube CVD reactor” [25] by E.S. Polsen, D.Q. McNerny, B. Viswanath, S.W. Pattinson and A. John Hart. Published in Sci. Rep. in 2015. Hereafter: Polsen et al.
8
3. Discussion:
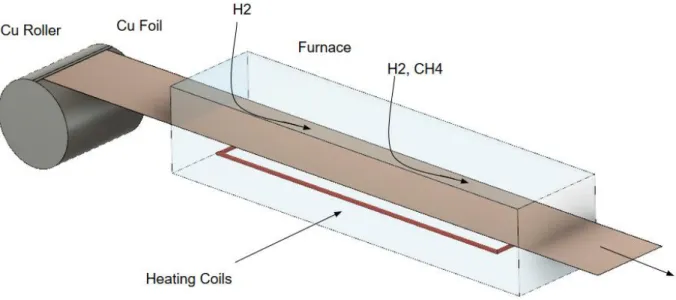
3.1 The Theoretical Process of Mass Manufacture of Graphene via R2R CVD: At a minute level, the experiments enumerated above have a great deal of differences. However, in choosing a simplistic view, we can extrapolate a generic that is the same between all of them. This informs the devising of a generic production process, and a basic high-level methodology for the future.
Production will begin with a substrate in foil form located on a roller. The substrate will likely be copper, though nickel is a potential substitute. Thicker foil tends to provide better results; however, the author believes it is possible that 25 µm foil will be the final standard. Thinner foil happens to cheaper both from a process standpoint – less copper is used overall – and from a production standpoint. 25 µm foil is much more common in the literature. The foil might require some pre-process polishing. Zhang et al improved electrical properties with electropolishing of copper foils prior to CVD. [26] Regardless, the roll of foil will be unspooled at a uniform speed, and likely enter a furnace where annealing takes place. Then the roll will enter a furnace where the carbon source gas is applied. The gas flow rates are quite variable between papers, and it is important to note that the value is related quite closely to the speed of the roll. Faster roll speed requires a faster flow rate because the same amount of gas is required per square meter passing through the furnace. While there was again a great deal of variation, gas flows (in standard cubic centimeters per minute) were about 50x larger than the speed of the foil in centimeters per second. Both the annealing and growth chambers may need to be pressurized above or below atmospheric conditions. However, there is a good amount of evidence to suggest that atmospheric pressure is sufficient. The
furnace temperature could also vary quite a bit. The preponderance of papers suggests that a temperature of 1200 K would likely be a good lower bound on furnace
temperature. The foil would spend a certain amount of time in the furnace. This is determined by the length of the furnace and the speed of the roll. One could also argue that the foil roll speed is determined by the growth time, and perhaps be more right. The growth time matters more with respect to the actual science in play. In canvassing the case studies, a growth time of 5 minutes was found to be acceptable. It adheres closely to the Kobayashi et al. experiment, and also is a good intermediate value between the very quick and slow experiments. After the growth stage, the copper foil would need etching to separate the graphene film and would also need a target substrate to hold the graphene for transport and shipping.
9
The table below contains the various case studies’ parameters regarding the envisioned methodology. The final column contains this paper’s assumptions as informed by the case studies. To the astute reader, it is clear that the Kobayashi experiment was
weighed heavily. This paper has the added advantage of being released more recently, and thus had already witnessed the Zhang, Polsen, Yamada and Hesjedal experiments – with the two latter experiments being addressed in the Kobayashi et al. paper. [21] For the Bae et al. experiment, the paper provided that the copper foil used had a diagonal of 30 inches. [19] This was approximated as a square for the purposes of calculating the area produced and the production rate. Additionally, the roll was
stationary in the chamber. Therefore, the speed listed is simply the length of the roll in the chamber divided by the time spent; it is not a true R2R process.
The growth time parameter is the length of the furnace divided by the speed, which gives the amount of time that each infinitesimally sized section of copper foil spends in the furnace.
Table 3.1 Selected Case Study and Theoretical Parameters. The ‘Theoretical Process’ column denotes the values used for cost estimation.
Parameters Bae et al. [19] Hesjedal [20] Kobayashi et al.
[21] Cu foil 𝑙𝑒𝑛𝑔𝑡ℎ × 𝑤𝑖𝑑𝑡ℎ × 𝑡ℎ𝑖𝑐𝑘𝑛𝑒𝑠𝑠 ~2888𝑐𝑚2 𝑢𝑛𝑘𝑛𝑜𝑤𝑛 𝑡ℎ𝑖𝑐𝑘𝑛𝑒𝑠𝑠 1𝑚 × 25𝑚𝑚 × 25𝜇𝑚 [27] > 100𝑚 × 210𝑚𝑚 × 36𝜇𝑚 Figure 1: R2R CVD Process.
10
Pressure [kPa] 0.06 101.3 1
Gases H2, CH4 H2, CH4, Ar H2, CH4
Gas Flow Rates [sccm] Anneal Phase: H2: 8 Growth Phase: H2: 8, CH4: 24 Ar: 1000 H2: 50 CH4: 25 H2: 50 CH4: 450 Substrate temperature [K] 1273.15 1273.15 1273.15
Speed [cm/min] 0.896 (effective speed, given
by length/time) 1-40 10
Growth time [min]
Anneal Phase: 30
Growth Phase: 30 0.75-30 4
Parameters Yamada et al. [23] Kidambi et al. [18] Alrefae et al. [24] Cu foil 𝑙𝑒𝑛𝑔𝑡ℎ × 𝑤𝑖𝑑𝑡ℎ × 𝑡ℎ𝑖𝑐𝑘𝑛𝑒𝑠𝑠 48𝑐𝑚 × 30𝑐𝑚 × 33𝜇𝑚 > 0.6𝑚 × 6.35𝑚𝑚 × 36𝜇𝑚 𝑢𝑛𝑘𝑛𝑜𝑤𝑛 × 2.54𝑐𝑚 × 76𝜇𝑚 Pressure [kPa] 0.03 0.21-0.31 0.7-1.8 Gases H2, CH4, Ar H2, CH4 H2, CH4, N2, O2, Ar
Gas Flow Rates [sccm] H2: 50 CH4: 50 Anneal Phase: H2: 150 Growth Phase: H2: 150 CH4: 200 H2: 1000 CH4: 1000 N2: 100 O2: 100 Ar: 5000 Substrate temperature [K] 673.15 1273.15 296.15 Speed [cm/min] 0.2-0.5 5 4.5-95.9 Growth time [min] 1-4 12 0.26-5.7
Parameters Zhong et al. [22] Polsen et al. [25] Theoretical Process Cu foil 𝑙𝑒𝑛𝑔𝑡ℎ × 𝑤𝑖𝑑𝑡ℎ × 𝑡ℎ𝑖𝑐𝑘𝑛𝑒𝑠𝑠 20𝑚 × 12𝑚𝑚 × 40𝜇𝑚 𝑢𝑛𝑘𝑛𝑜𝑤𝑛 × 6.35 𝑚𝑚 × 50.8𝜇𝑚 𝑤𝑖𝑑𝑡ℎ 10 𝑐𝑚 𝑡ℎ𝑖𝑐𝑘𝑛𝑒𝑠𝑠 25𝜇𝑚 Pressure [kPa] 101.3 0.5 101.3 Gases H2, CH4, N2 H2, C2H4, He H2, CH4
Gas Flow Rates [sccm] N2: 8000 H2: 160 CH4: 2 Anneal Phase: H2: 300 Growth Phase C2H4: 10 H2: 315 H2: 200 CH4: 200 Substrate temperature [K] 1283.15-1343.15 1283.15 1200 Speed [cm/min] 0.75 2.5-50 5 Growth time [min] 80 ~1.22 5 3.2 Costing:
For the purpose of this analysis, we will focus on the variable costs of production, which are mainly the costs of copper, gases, and energy. The fixed and/or operational costs will be excluded from calculations, due to the high level of minutiae and because all of these costs would be a flat figure amortized by the number of parts produced. As a
11
general note, where prices are provided, they were specified assuming a small-scale production run based in Cambridge Massachusetts based on prices available in April of 2020.
One important global process parameter is the production rate. This rate has units of m2/s. The production rate can be constructed from existing process parameters denoted
in the Theoretical Process column of Table 3.1 by using the following equation: 𝑃𝑟𝑜𝑑𝑢𝑐𝑡𝑖𝑜𝑛 𝑅𝑎𝑡𝑒 [𝑚 2 𝑠 ] = 𝑆𝑝𝑒𝑒𝑑 [ 𝑚 𝑠] ∗ 𝑊𝑖𝑑𝑡ℎ 𝑜𝑓 𝐹𝑢𝑟𝑛𝑎𝑐𝑒 [𝑚] Eq. 3.1 This equation results in a production rate of approximately 8.33x10⁻⁵ m2/s. This
translates to an hourly production rate of 0.3 m2/h. In equations, the production rate in
terms of seconds will be referred to as 𝑛
𝑡 and the production rate in terms of hours will be
referred to as 𝑛
𝑡ℎ. In this case, “n” is a generic part of graphene, equal to 1 m
2.
3.2.1 Cost of Copper:
The CVD method demands higher quality copper than what can be used in most industrial applications. Most of the case studies, when sources where provided, listed Alfa Aesar as the copper foil supplier. Alfa Aesar’s products are much more expensive than typical commercial-off-the-shelf copper. An Alibaba product cited their cost at $14 per kilogram, which translates to 3.14 $
𝑚2. [28] Alfa Aesar’s products are orders of
magnitude more expensive. While it is possible that in-house post processing and purchases in bulk could drive down the price, the Alfa Aesar quotes are a reasonable starting point. Here are a select set of products and their associated costs:
Table 3.2 Alfa Aesar Copper Foil Quotes [27]
Item Number Description Thickness Size Price (USD)
Price (USD) per square meter 10950 Puratronic ® 99.999% 25 𝜇𝑚 . 025 × 1𝑚 157.00 6280 13382 Annealed, coated, 99.8% 25 𝜇𝑚 0.3 × 10𝑚 120.00 40 42972 Puratronic ® 99.999% 50 𝜇𝑚 0.1 × 0.1𝑚 183.00 18300 35818 Annealed, coated, 99.8% 50 𝜇𝑚 0.1 × 0.1𝑚 151.00 15100
The cost of copper foil becomes prohibitively expensive for certain stock keeping units at Alfa Aesar. It is important to note that this did not include a bulk discount, and it is likely that items 10950, 42972 and 35818 could approach the item cost of 13381.
12
Clearly, the price of copper depends heavily on the quality that is desired. The
experiment grade Alfa Aesar foil was significantly more expensive than the cheapest available on the Alibaba marketplace.
Additionally, there is a heavy reliance on thickness, which makes sense. Choosing 36 micrometer foil instead of 25 micrometer foil results in a 1.44x increase of material, which should translate to the final cost. Here the thicker foils are even more expensive than this simple relation predicts.
The Li et al. experiment used Alfa Aesar item 13382. [14] Use of this item makes sense both from a cost and process parameter standpoint, and this provides a good middle of the road estimate between industrial grade and “Puratronic” copper.
One factor that has not been considered yet is the potential re-use of copper after transferring graphene to another substrate such as PET. Currently, the copper is
typically dissolved by a solution such as iron chloride. If the graphene could be rolled off of the copper cleanly, it would be a significant boon to manufacturing efforts. Let us assume that the copper can be re-used in some portion of the total amount
“𝑟𝑒𝑐𝑦𝑐𝑙𝑒𝑓𝑟𝑎𝑐”. That gives a final cost of copper of the following expression:
If the cost is given per kg: 𝐶𝑜𝑠𝑡𝐶𝑜𝑝𝑝𝑒𝑟[ $ 𝑚𝐺𝑟𝑎𝑝ℎ𝑒𝑛𝑒2 ] = 𝑃𝑟𝑖𝑐𝑒 𝑝𝑒𝑟 𝑘𝑔 [$ 𝑘𝑔] ∗ 𝑑𝑒𝑛𝑠𝑖𝑡𝑦 [ 𝑘𝑔 𝑚3] ∗ 𝑡ℎ𝑖𝑐𝑘𝑛𝑒𝑠𝑠 [𝑚] ∗ (1 − 𝑟𝑒𝑐𝑦𝑐𝑙𝑒𝑓𝑟𝑎𝑐)
If the cost is given per square meter
𝐶𝑜𝑠𝑡𝐶𝑜𝑝𝑝𝑒𝑟[ $
𝑚2] = 𝑃𝑟𝑖𝑐𝑒 ∗ (1 − 𝑟𝑒𝑐𝑦𝑐𝑙𝑒𝑓𝑟𝑎𝑐) + 𝐶𝑜𝑠𝑡𝑟𝑒𝑐𝑦𝑐𝑙𝑒
Eq. 3.2 There is much unknown about the recycle fraction. Of course, it has the potential to entirely eliminate the cost of copper, but complete recycling is unlikely, and the recycling step will incur a non-zero cost of recycle. The case studies consulted do not broach the issue, so exact specifics are yet to be determined. However, it is clear that maximizing the amount of recycling should be a top priority.
All in all, the cost of copper in the experiment are described below. Notably, there will be an associated cost of recycling, which is unknown. This is represented by Costrecycle.
Cost of Copper Summary:
Estimated Value Expression
40 [$ 𝑚2] (assuming no recycling) 𝐶𝑜𝑠𝑡𝐶𝑜𝑝𝑝𝑒𝑟[ $ 𝑚2] = 𝑃𝑟𝑖𝑐𝑒 ∗ (1 − 𝑟𝑒𝑐𝑦𝑐𝑙𝑒𝑓𝑟𝑎𝑐) + 𝐶𝑜𝑠𝑡𝑟𝑒𝑐𝑦𝑐𝑙𝑒
13 3.2.2 Cost of Gases:
The cost of gases is small in comparison to that of the copper. This poses great opportunity for future mass manufacture. The gases are the matter from which the graphene is ultimately formed. Copper just happens to be the most effective substrate currently known. With that in mind though, understanding the costs of gases reveals the absolute minimum costs of production in a yet-to-be-invented process.
Table 3.3 Gas Cost Variables
Description Variable Units Value Used or
Expression Reference Price of methane 𝑝𝐶𝐻4 [$ 𝐿] 0.016 [29] Price of hydrogen 𝑝𝐻2 [ $ 𝐿] 0.012 [29]
Flow rate of methane (STP) 𝑓𝑙𝑜𝑤𝐶𝐻4 [𝑠𝑐𝑐𝑚], [
𝐿
𝑠] 200, 0.0033
Table 3.1 (theoretical process column) Flow rate of hydrogen (STP) 𝑓𝑙𝑜𝑤𝐻2 [𝑠𝑠𝑐𝑚], [𝐿
𝑠] 200, 0.0033
Table 3.1 (theoretical process column)
In order to use the parameters provided in the case studies, Equation 3.3 was devised. 𝐶𝑜𝑠𝑡𝐺𝑎𝑠𝑒𝑠 =
𝑡
𝑛∗(𝑝𝑔𝑎𝑠1∗ 𝑓𝑙𝑜𝑤𝑔𝑎𝑠1+ ⋯ 𝑝𝑔𝑎𝑠𝑁∗ 𝑓𝑙𝑜𝑤𝑔𝑎𝑠𝑁)
Eq. 3.3 The product of the flow rates and the prices is a quantity with units of dollars per
second. In order to convert this dollar per second value into a dollars per part value, it is multiplied by the inverse of the production rate.
Entering the best estimations on the parameters provided, the cost of gases results $1.11 m-2. The cost would likely be more if the chamber were to be pressurized above
atmospheric and could be reduced by optimizing the furnace tube geometry. Cost of Gases Summary:
Estimated Value Expression
1.11 [ $ 𝑚2] 𝐶𝑜𝑠𝑡𝐺𝑎𝑠𝑒𝑠[ $ 𝑚2] = 𝑡 𝑛∗ (𝑝𝑔𝑎𝑠1∗ 𝑓𝑙𝑜𝑤𝑔𝑎𝑠1+ ⋯ 𝑝𝑔𝑎𝑠𝑁∗ 𝑓𝑙𝑜𝑤𝑔𝑎𝑠𝑁) 3.2.3 Cost of Energy:
While a graphene production process ultimately will have many energy sinks, the most significant portion of energy use takes place in the furnace. The furnace has three main inputs: copper, hydrogen, and methane. The furnace experiences thermal losses
14
despite insulation. One can model the requisite heat input with the following equation, based off the first law of thermodynamics, which balances the heat input and output. The change in enthalpy Δ𝐻 is equivalent to a change in energy Δ𝑈 in this particular case because pressure is being held constant.
𝑄̇ =(TChamber− 𝑇0)
𝑅𝑐ℎ𝑎𝑚𝑏𝑒𝑟 + 𝑚𝐶𝑢̇ ∗ cp Cu∗(T𝐶ℎ𝑎𝑚𝑏𝑒𝑟− 𝑇0)+ 𝑚𝐶𝐻̇ 4∗ 𝑐𝑝 𝐶𝐻4(T𝐶ℎ𝑎𝑚𝑏𝑒𝑟− 𝑇0) + 𝑚𝐻̇ 2
∗ 𝑐𝑝 𝐻2(T𝐶ℎ𝑎𝑚𝑏𝑒𝑟− 𝑇0)
Eq. 3.4 TChamber is assumed to be 1200 K, as described in Table 3.1 in the Theoretical Process
column. T0 is 293 K, a reasonable approximation for room temperature. T0 is also the
assumed outlet temperature of the gasses prior to entry in the chamber. This equation’s left-hand-side (LHS) is the requisite heat input in watts. The right-hand-side (RHS) is the various sources of loss for the heat input. The first term models the chamber as a
thermal resistor to the environment. The rest of the terms take a mass flow rate of a various component material and multiply that by the change in enthalpy from entering the chamber to leaving it.
While the specific heat fluctuates with temperature, the value for the chamber
temperature was selected. This will provide an overestimate for the amount of energy that is required. The environment temperature should be considered standard room temperature. The chamber temperature varies across the case study experiments, but 1200 K is a reasonable approximation. The initial temperature of the gases is the outlet temperature from storage tanks and was assumed to be about 0℃. A rough estimation of a research furnace’s insulation was found by taking the wattage and dividing by the maximum temperature. [30] This yielded a value of 0.39 K/W.
The relevant variables are listed in the following table. Table 3.4 Cost of Energy Variables
Description Variable Units Value Reference
Process Setpoint 𝑇𝐶ℎ𝑎𝑚𝑏𝑒𝑟 [𝐾] 1200 Table 3.1 (theoretical process column) Chamber thermal resistance 𝑅𝑐ℎ𝑎𝑚𝑏𝑒𝑟 [ 𝐾 𝑊] 0.39 [31]
Specific heat of copper 𝑐𝐶𝑢 [
𝑘𝐽
𝑘𝑔𝐾] 0.377 [32]
Specific heat of methane
at 1200 K 𝑐𝐶𝐻4 [
𝑘𝐽
𝑘𝑔𝐾] 4.858 [33]
Specific heat of hydrogen
at 1100 K 𝑐𝐻2 [
𝑘𝐽
𝑘𝑔𝐾] 15.34 [32]
Energy cost per
Kilowatt-Hour 𝑝𝑘𝑊ℎ [
$
𝑘𝑊ℎ] 0.2218 [34]
Power (gases & copper) 𝑝𝑚𝑎𝑡𝑒𝑟𝑖𝑎𝑙𝑠 [𝑘𝑊] 0.02 Calculated
15
Power (total) 𝑄̇ [𝑘𝑊] 2.35 Calculated
Hourly Production Rate 𝑛
𝑡ℎ [ 𝑚2 ℎ ] 0.3 Table 3.1 (theoretical process column) Energy used per part 𝑒𝑛𝑒𝑟𝑔𝑦 [𝑘𝑊ℎ 𝑚−2] 𝑄̇ ∗ 𝑡ℎ
𝑛 = 7.83 Calculated
After calculating the power, it is adjusted to a per part basis. Similarly, to the cost of gases, this accomplished by multiplying by the inverse of the production rate. Power has units of energy per unit time. Multiplying by the inverse of production rate will yield and energy per part value. However, the production rate must be converted to an hourly basis, as electricity costs are commonly cited per kilowatt-hour. The production rate in terms of parts per hour, defined at the beginning of section 3.2, is 0.3 m2/h. The product
of the power and the production rate is 7.83, which has units of kWh m2, which is
dominated by the furnace heat loss. This is subsequently converted to a dollar per part value by multiplying by the cost of electricity. This is shown in Equation 3.5.
𝐶𝐸𝑛𝑒𝑟𝑔𝑦=(𝑒𝑛𝑒𝑟𝑔𝑦 ∗ 𝑝𝑘𝑤ℎ)
Eq. 3.5 The process as described results in a price of $1.74 m-2.
Cost of Energy Summary:
Estimated Value Expression
1.74 [ $ 𝑚2] 𝐶𝑜𝑠𝑡𝐸𝑛𝑒𝑟𝑔𝑦[ $ 𝑚2] = 𝑄̇ ∗ 𝑡ℎ 1000 ∗ 𝑛∗ 𝑃𝑘𝑤ℎ
3.2.4 Summary of Variable Costs:
The variable costs can be loosely approximated by the costs of copper, gases and energy. Putting together sections 3.3, 3.4 and 3.5, the result is the following.
Cost Type Value Expression
Copper 40 [ $ 𝑚2] (assuming no recycling) 𝐶𝑜𝑠𝑡𝐶𝑜𝑝𝑝𝑒𝑟[ $ 𝑚2] = 𝑃𝑟𝑖𝑐𝑒 ∗ (1 − 𝑟𝑒𝑐𝑦𝑐𝑙𝑒𝑓𝑟𝑎𝑐) + 𝐶𝑜𝑠𝑡𝑟𝑒𝑐𝑦𝑐𝑙𝑒 Gases 1.11 [$ 𝑚2] 𝐶𝑜𝑠𝑡𝐺𝑎𝑠𝑒𝑠[ $ 𝑚2] = 𝑡 𝑛 ∗ (𝑝𝑔𝑎𝑠1∗ 𝑓𝑙𝑜𝑤𝑔𝑎𝑠1+ ⋯ 𝑝𝑔𝑎𝑠𝑁∗ 𝑓𝑙𝑜𝑤𝑔𝑎𝑠𝑁) Energy 1.74 [$ 𝑚2] 𝐶𝑜𝑠𝑡𝐸𝑛𝑒𝑟𝑔𝑦[ $ 𝑚2] = 𝑄̇ ∗ 𝑡ℎ 1000 ∗ 𝑛∗ 𝑃𝑘𝑤ℎ 3.2.5 Capital Costs:
16
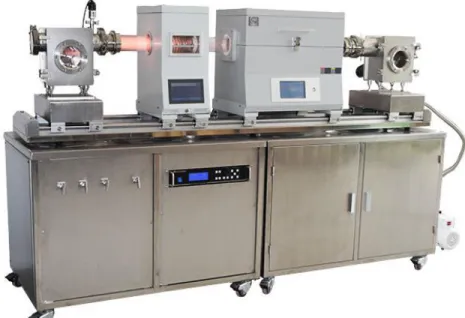
Specific equipment costs and tooling was not considered. These would obviously be important from a profitability standpoint. However, all capital expenditures have the same formula: essentially the cost of the machine/implement amortized by the amount of parts produced before it must be replaced. Additionally, as mass manufacture of graphene becomes closer to reality, the prices of these secondary products would be expected to fall in conjunction with that of graphene. As of this date (May 5, 2020), a R2R PECVD furnace was available on Alibaba.com by Zhengzhou CY Scientific Instrument Co., Ltd. for $26,500 (Fig. 2). [30] The furnace has a 1.4 m length and 0.08 m inner diameter (the furnace is a heated tube). Assuming a residence time of 10 min translates to a linear speed of 14 cm/min, and a production rate of 112 cm2/min or 5887
m2/year at full capacity. At 76% capacity, the production rate is 4500 m2/year. Although
other ancillary equipment may be needed, the CVD system is the main equipment and likely accounts for most of the equipment cost. Assuming a useful lifetime of 5 years translates to capital cost of approximately $1.18 m-2. Therefore, the capital cost is quite
low compared to the cost of copper, and approximately on the same order of magnitude as the cost of gases and energy. However, current methods have not attempted to minimize gas and energy costs. If gas and energy use is optimized, capital cost may exceed those costs.
Figure 2. R2R PECVD furnace manufactured by Zhengzhou CY Scientific Instrument Co., Ltd. [30]
3.2.6 Operational Costs:
Absent from this analysis thus far have been operational costs. This category includes: cost of labor; leases; administrative costs; intellectual property purchase; and general overhead. These values are specific beyond the scope of the paper, and would hinge upon location, regulatory markets and business model. These costs may tend to
17
dominate over other costs (except possibly for cost of copper) for small-scale production.
Here we present one scenario, assuming a 500 sq. ft. facility with 10 CVD furnaces (50 sq. ft. per furnace) producing 45,000 m2/year of graphene, with illustrative costs (the
numbers may not reflect actual costs). Rent: $60,000/year = $1.33 m-2
Labor & administration: $300,000/year = $6.67 m-2
Facilities: $50,000/year = $1.11 m-2
Therefore, it is seen that these costs are significant, and depend on the scale of production. The cost per part will be higher for smaller scale production, but may be mitigated if the manufacture of graphene takes place in a facility manufacturing other products that require similar skills and infrastructure. Furthermore, these costs will decrease considerably if the width of the furnace tube is increased, e.g., a 0.8 m width furnace could fit into similar dimensions, allowing a 10-fold increase in production rate at the same operational costs.
4. Conclusion:
The process as envisioned is dominated by the cost of copper, followed by energy, gases, and equipment. In order to lower the cost of production, researchers and businesses should focus on:
• Eliminating the waste of copper when removing graphene films and reusing where possible. This scales down the copper cost by a multiplicative factor. • Optimizing gas flow rates and energy consumption.
• Increasing the width of the foil to increase throughput.
• Identifying suitable substitutes for copper as a substrate. This would drive down the unit cost of substrate.
• Producing graphene on both sides of copper substrate. This would halve the copper cost.
• Adopting the process to use lower quality copper that may be cheaper to supply. In terms of speeding up the overall rate of manufacture, a prospective manufacturer has several options. Likely the rate limiting factor is the growth time, and this one is non-negotiable due to the chemistry at work. However, there are a few solutions:
• Increasing the width of the furnace would scale production linearly.
• Increasing the length of the furnace chamber would allow for an identical growth time with a faster foil speed.
• Decomposing the roll into separate pieces and introducing multiple furnaces, and then recompose the roll after the growth phase.
18
Prognostication about the future often renders the best-laid assumptions incorrect. Prior to the mass production of graphene becoming commonplace, the demand will need to be realized. While many proposals have been thrown out for uses of graphene, the financial imperative does not yet exist. Several process parameters will need to be tweaked, given that current CVD produced graphene can commonly be bilayer or trilayer graphite, or be missing desirable electrical properties.
Despite the faulty nature of assumptions, it can be stated with some degree of
confidence that the yet-to-be-invented process – assuming it is in fact R2R CVD – will have much thought put into the substrate. Eliminating the waste of copper or finding new target materials will bring graphene production towards profitability at scale. In the words of Geim: “Once someone sees that there is a gold mine, then very heavy
equipment starts to be applied from many different research areas.” [35]
References:
[1] A. Geim and K. S. Novoselov, "The Rise of Graphene," Nature Materials, vol. 6, pp. 183-191, 2007. [2] A. K. Geim and K. S. Novoselov, "Electric Field Effect in Atomically Thin Carbon Films," Science, vol.
306, pp. 666-669, 2004.
[3] B. Deng, Z. Liu and H. Peng, "Towards Mass Production of CVD Graphene Films," Advanced
Materials, vol. 1800996, pp. 1-25, 2018.
[4] C. Lee, X. Wei, J. Kysar and J. Hone, "Measurement of the Elastic Properties and Intrinsic Strength of Monolayer Graphene," Science, vol. 321, pp. 385-388, 2008.
[5] A. Balandin, S. Ghosh, W. C. I. Bao, D. Teweldebrhan, F. Miao and C. Lau, "Superior Thermal Conductivity of Single Layer Graphene," Nano Letters, vol. 8, pp. 902-907, 2008.
[6] C. Miao, CVD Synthesis of Graphene and Graphene Bipolar Junction Transistor, University of Califonia Los Angeles, 2011.
[7] R. Munoz and C. Gomez-Aleixandre, "Review of CVD Synthesis of Graphene," Chemical Vapor
Deposition, vol. 19, pp. 297-322, 2013.
[8] X. Lin, "Synthesis and Applications of Large-Area Single-Layer Graphene," RSC Advances, vol. 6, pp. 17818-17844, 2016.
[9] University of Manchester, "The University of Manchester," 2014. [Online]. Available:
https://www.manchester.ac.uk/discover/news/manchester-graphene-paper-among-top-100-citations-of-all-time/ . [Accessed 5 April 2020].
[10] J. Suk, "Enhancement of the Electrical Properties of Graphene Grown by Chemical Vapor
Deposition via Controlling the Effects of Polymer Residue," Nano Letters, vol. 13, pp. 1462-1467, 2013.
19
[11] R. Mertens, "How can graphene assist in the war on Coronavirus?," Graphene-info, 24 March 2020. [Online]. Available: https://www.graphene-info.com/how-can-graphene-assist-war-coronavirus. [Accessed 06 May 2020].
[12] J. Ryu, Y. Kim, D. Won, N. Kim, J. Park, E. Lee, D. Cho, S. Cho, S. Kim, G. Ryu, H. Shin, Z. Lee, B. Hong and S. Cho, "Fast Synthesis of High-Performance Graphene Films by Hydrogen-Free Rapid Thermal Chemical Vapor Deposition," ACS Nano, vol. 8, pp. 950-956, 2014.
[13] H. Fu, Z. Yang, Y. Zhang, M. Zhu, Y. Jia, Z. Chao, D. Hu and Q. Li, "SWCNT-modulated folding-resistant sandwhich-structured graphene film for high-performance electromagnetic interference shielding," Carbon, vol. 162, pp. 490-496, 2020.
[14] X. Li, W. Cai, J. An, S. Kim, J. Nah, D. Yang, R. Piner, A. Velamakanni, I. Jung, E. Tutuc, S. Banerjee, L. Colombo and R. Ruoff, "Large-Area Synthesis of High-Quality and Uniform Graphene Films on Copper Foils," Science, vol. 324, pp. 1312-1314, 2009.
[15] X. Lu, M. Yu, H. Huang and R. Ruoff, "Tailoring Graphite with the Goal of Achieving Single Sheets,"
Anglais, vol. 10, pp. 269-272, 1999.
[16] J. e. al, "A Novel Mechanical Cleavage for Synthesizing Few-layer Graphenes," Nanoscale Res Lett., vol. 6, p. 95, 2011.
[17] Ciochon et al, "Si Beam-assisted Graphitization of SiC," Applied Physics A, vol. 124, 2018.
[18] P. Kidambi, D. Mariappan, N. Dee, A. Vyatskikh, S. Zhang, R. Karnik and J. Hart, "A Scalable Route to Nanoporous Large-Area Atomically Thin Graphene Membranes by Roll-to-Roll Chemical Vapor Deposition and Polymer Supper Casting," ACS Applied Materials and Interfaces, vol. 10, pp. 10369-10378, 2018.
[19] S. Bae, H. Kim, Y. Lee, X. Xu, J. Park, Y. Zheng, J. Balakrishnan, T. Lei, H. Kim, Y. Song, Y. Kim, K. Kim, B. Ozyilmaz, J. Ahn, B. Hong and S. Iijima, "Roll-to-roll Production of 30-inch Graphene Films for Transparent Electrodes," Nature Nanotechnology, vol. 5, pp. 574-578, 2010.
[20] T. Hesjedal, "Continuous Roll-to-roll Growth of Graphene Films by Chemical Vapor Deposition,"
Applied Physics Letters, vol. 98, pp. 133106-1 - 133106-3, 2011.
[21] T. Kobayashi, K. Kadono, S. Hayazaki and Y. Mizuguchi, "Production of a 100-m-long High-Quality Graphene Transparent Conductive Film by Roll-to-roll Chemical Vapor Deposition and Transfer Process," Applied Physics Letters, vol. 102, p. 023112, 2013.
[22] G. Zhong, X. Wu, L. D'Arsie, K. Teo, N. Rupesinghe, A. Jouvray and J. Robertson, "Growth of Continuous Graphene by Open Roll-to-roll Chemical Vapor Deposition," Applied Physics Letters, vol. 109, pp. 193103-1 - 193103-5, 2016.
20
[23] T. Yamada, M. Ishihara, J. Kim, M. Hasegawa and S. Iijima, "Roll-to-roll Graphene Synthesis by Using Microwave Plasma Chemical Vapor Deposition at Low Temperature," Materials Research
Society, vol. 1401, 2012.
[24] M. Alrefae, A. Kumar, P. Pandita, A. Candadai, I. Bilionis and T. Fisher, "Process Optimization of Graphene Growth in a Roll-to-roll Plasma CVD System," AIP Advances, vol. 7, pp. 115102-1 - 115102-18, 2017.
[25] E. Polsen, D. McNerny, B. Viswanath, S. Pattinson and J. Hart, "High-speed Roll-to-roll Manufacturing of Graphene Using a Concentric Tube CVD Reactor," Sci. Rep., 2015. [26] B. Zhang, W. Lee, R. Piner, I. Kholmanov, Y. Wu, H. Li, H. Ji and R. Ruoff, "Low-Temperature
Chemical Vapor Deposition Growth of Graphene from Toluene on Electropolished Copper Foils,"
ACS Nano, vol. 6, no. 3, pp. 2471-2476, 2012.
[27] Alfa Aesar, "Alfa Aesar," Thermo Fisher Scientific, [Online]. Available: https://www.alfa.com/en/catalog/010950/. [Accessed 27 April 2020].
[28] Alibaba, "Alibaba.com," [Online]. Available: https://www.alibaba.com/product-detail/1OZ-HTE-ED-Copper-Foil-as_60595166510.html?spm=a2700.7724857.normalList.33.2eb423aapKsh0W.
[Accessed 27 April 2020].
[29] J. Jordan, Interviewee, Airgas Representative. [Interview]. 14 April 2020.
[30] "Alibaba.com," Alibaba, [Online]. Available: https://www.alibaba.com/product-detail/Lab-scale-Roll-to-Roll-PE_62558873162.html?spm=a2700.galleryofferlist.0.0.24f18e34oYXVDN. [Accessed 06 May 2020].
[31] Hogentogler, "Hogentogler," [Online]. Available: https://www.hogentogler.com/thermo-scientific-
lindberg-blue-m/bf51748c-muffle- furnace.asp?gclid=CjwKCAjwkPX0BRBKEiwA7THxiPlaGf9AfzaY1K4Epmxmr9N4cQG-6sTBRlF9bWsCCiAzx9ICJTqmUBoCTSgQAvD_BwE. [Accessed 27 April 2020]. [32] Engineering Toolbox, "The Engineering Toolbox," [Online]. Available:
https://www.engineeringtoolbox.com. [Accessed 27 April 2020].
[33] "NIST Chemistry WebBook," National Institute of Standards and Technology , 2018. [Online]. Available: https://webbook.nist.gov/cgi/cbook.cgi?ID=C74828&Mask=1. [Accessed 7 May 2020]. [34] United States Department of Labor, "U.S. Bureau of Labor Statistics," 11 January 2019. [Online].
Available:
https://www.bls.gov/regions/new_england/news-release/averageenergyprices_boston.htm. [Accessed 27 April 2020].
[35] J. Colapinto, "Material Question: Graphene may be the most remarkable substance ever discovered. But what's it for?," The New Yorker, 22 December 2014.
![Table 3.2 Alfa Aesar Copper Foil Quotes [27]](https://thumb-eu.123doks.com/thumbv2/123doknet/14176852.475480/11.918.115.813.729.931/table-alfa-aesar-copper-foil-quotes.webp)