HAL Id: tel-01665492
https://tel.archives-ouvertes.fr/tel-01665492
Submitted on 16 Dec 2017HAL is a multi-disciplinary open access archive for the deposit and dissemination of sci-entific research documents, whether they are pub-lished or not. The documents may come from teaching and research institutions in France or abroad, or from public or private research centers.
L’archive ouverte pluridisciplinaire HAL, est destinée au dépôt et à la diffusion de documents scientifiques de niveau recherche, publiés ou non, émanant des établissements d’enseignement et de recherche français ou étrangers, des laboratoires publics ou privés.
Spatial and temporal variations of the occurrence and
distribution of polycyclic aromatic compounds in a river
system affected by past industrial activities
Fayez Abuhelou
To cite this version:
Fayez Abuhelou. Spatial and temporal variations of the occurrence and distribution of polycyclic aromatic compounds in a river system affected by past industrial activities. Analytical chemistry. Université de Lorraine, 2016. English. �NNT : 2016LORR0233�. �tel-01665492�
AVERTISSEMENT
Ce document est le fruit d'un long travail approuvé par le jury de
soutenance et mis à disposition de l'ensemble de la
communauté universitaire élargie.
Il est soumis à la propriété intellectuelle de l'auteur. Ceci
implique une obligation de citation et de référencement lors de
l’utilisation de ce document.
D'autre part, toute contrefaçon, plagiat, reproduction illicite
encourt une poursuite pénale.
Contact : [email protected]
LIENS
Code de la Propriété Intellectuelle. articles L 122. 4
Code de la Propriété Intellectuelle. articles L 335.2- L 335.10
http://www.cfcopies.com/V2/leg/leg_droi.php
UNIVERSITE DE LORRAINE, Institut national polytechnique de Lorraine
ECOLE DOCTORALE « Ressources Procédés Produits Environnement »
Laboratoire Interdisciplinaire des Environnements Continentaux UMR 7360 CNRS – Université de Lorraine
THESE
Pr se t eàe à ueàdeàl o te tio àduàgrade de
Docteur en Géosciences
De lU i e sit àdeàLo ai e Par
Fayez ABUHELOU
Les variations spatiales et temporelles de l'occurrence et de la distribution de composés aromatiques polycycliques dans un système fluvial affecté par activités
industrielles passées.
Soutenance publique le 15 Décembre 2016
Membres du jury:
Rapporteur Mme Cécile Quantin, Professeur - Université Paris Sud
Rapporteur M. Johnny Gaspéri, Maître de Conférences (HDR) - Université Paris Est Créteil
Directeur de thèse M. Fabien Thomas, Directeur de Recherche, CNRS, Université de Lorraine Co-directrice de
thèse
Mme Laurence Mansuy-Huault, Maître de Conférences, Université de Lorraine
Invitée Mme Emmanuelle Montargès-Pelletier, Chargée de Recherche, CNRS/Université de Lorraine
Invitée Mme Catherine Lorgeoux, Ingénieure de recherche, CNRS/Université de Lorraine
ABUHELOU Fayez |PhD Thesis | Université de Lorraine| 2016
UNIVERSITE DE LORRAINE, Institut national polytechnique de Lorraine
ECOLE DOCTORALE « Ressources Procédés Produits Environnement »
Laboratoire Interdisciplinaire des Environnements Continentaux UMR 7360 CNRS – Université de Lorraine
THESIS
In partial fulfillment of the requirements for the degree of
PhD in Geosciences. at Université de Lorraine
By
Fayez ABUHELOU
Spatial and temporal variations of the occurrence and distribution of polycyclic aromatic compounds in a river system affected by past industrial activities.
Defense on 15th December 2016.
Members of jury:
Reviewer Mme Cécile Quantin, Professeur - Université Paris Sud
Reviewer M. Johnny Gaspéri, Maître de Conférences (HDR) - Université Paris Est Créteil
Supervisor M. Fabien Thomas, Directeur de Recherche, CNRS, Université de Lorraine Co- Supervisor Mme Laurence Mansuy-Huault, Maître de Conférence, Université de
Lorraine
Invited Mme Emmanuelle Montargès-Pelletier, Chargée de Recherche, CNRS/Université de Lorraine
Invited Mme Catherine Lorgeoux, Ingénieure de recherche, CNRS/Université de Lorraine
La contamination en composés aromatiques polycycliques (CAP) a été suivie entre 2014 et 2015 auà ou sàdeàsi à a pag esàd ha tillo ageàsu à àsitesàdiff e tsàe t eàáu ou àetà‘i he o t.à Cetteàse tio àduà ou sàd eauà o espo dà àlaàpa tieàa alàdeàlaà all eàdeàl O eàp ofo d e tà affe t eàpa àplusàd u àsi leàd a ti it sà i i esàetàsid u gi uesà ui ont cessé entre 1968 et .à L O eà aàdo à t à leà epta leà deà ejetsà i dust ielsà età u ai sàetà aà t à p ofo d e tà perturbée dans son hydrodynamisme avec la construction de plusieurs barrages. Dans ce o te te,àl o u e eàdesà àh d o a u esàa o atiques polycycliques réglementaires (HAP), de 11 CAP oxygénés (O-CAP) et de 5 CAP azotés (N-CAP) et leur distribution dans les fractions dissouteàetàpa ti ulai eàdesàeau àdeàl O eào tà t à tudi esàe à etta tàe àpla eàdesàp oto olesà d ha tillo ageàetàd analyse adaptés. Le premier objectif de ce travail a été de comparer les thodesàd ha tillo ageà desà ati esà e à suspe sio àpa à filt atio àetà pa à e t ifugatio à à flux continu sur le terrain. Des différences significatives ont pu être identifiées entre les deux te h i ues,àlaàfilt atio àa e a tà àdesà o e t atio sàe àCáPàplusà le esàduàfaitàd u eàplusà grande abondance des CAP de bas poids moléculaire. Nous avons pu mettre en évidence le rôle de la fraction fine (< 5µm) et/ou colloïdale plus ou moins retenue par les filtres et qui, de part sa réactivité, piège des CAP. La comparaison des deux méthodes dans différentes situations h d ologi uesà ousà o t eà ueà etteà te tio à estàpasàs st ati ueà aisàplutôtà o l eà à des situations de fort hydrodynamis e.àLesàdeu à thodesàd ha tillo ageàdesà ati esàe à suspension ne sont donc pas comparables mais complémentaires. Le suivi saisonnier et multi-sitesàdesàeau àdeàl O eà o t eà ueàlaà o e t atio àe àCáPà a ieàe t eà . àetà . à gàL-1 dans
la fraction dissoute et entre 1.5 et 105.5 µg g-1 dans la fraction particulaire avec des variations spatiales de ±35% et ±45% respectivement. Les variations de concentration des CAP dans la f a tio àdissouteàso tài po ta tesàd u àsiteà àl aut eàlo s ueàleàd itàestàfaible (de 0.5 à 34 m3.s -1). Les concentrations en CAP sont faibles autour de 20 ng.L-1 et spatialement homogènes en
périodes de haut débit (> 50 m3.s-1) du fait de la dilution. Les concentrations en CAP dans les matières en suspension varient entre 2.8 to 36.3 µg g-1,et montrent des concentrations stables uellesà ueàsoie tàlesàsituatio sàh d ologi uesàlo s u ellesàso tà olle t esàpa àlaà e t ifugeuseà de terrain. La fraction dissoute est enrichie en HAP de bas poids moléculaire dans les périodes d tiageà età està a u eà pa à l o u e eà desà HáPà à à età à lesà a o ati uesà auà ou sà desà épisodes de crue. Les CAP polaires sont au moins aussi abondants que les HAP dans la fraction dissoute et évoluent de la même façon que les HAP. La part des CAP polaires dans la fraction pa ti ulai eàestàsig ifi ati e e tàplusà asseà deà à à %àdeàl e se leàdesàCáP .
Mots-clés: Centrifugeuse deterrain à flux Continu, Filtration, Rivière Orne, Composés
aromatiques polycycliques, composés aromatiques polycycliques polaires, Fractions dissoute et particulaire.
ABUHELOU Fayez |PhD Thesis | Université de Lorraine| 2016
Summary
The spatio-temporal variations of the concentration and distribution of dissolved and particulate polycyclic aromatic compounds (PACs), namely 16 polycyclic aromatic hydrocarbons (PAHs), 11 oxygenated PACs (O-PACs) and 5 nitrogen PACs (N-PACs), were studied in the Orne, a river impacted for more than one century by iron mining and steel-making industry. The first objective of this work was to compare the influence of two different methods of separation of suspended particulate matter (SPM), filtration (FT) and field continuous flow centrifuge (CFC). Results showed that in half of the sampling campaigns, PAC concentrations were 2 to 8 times higher for PAHs and 2 to 10 times higher for O-PAC when SPM were collected by filtration. These differences that were not observed systematically over the six sampling campaigns could be explained by the retention of colloidal matter on glass-fiber filters that appeared as a very reactive phase particularly enriched in low molecular PACs. The two methods were then considered as complementary methods to study SPM. The second objective of this work was to perform a long term monitoring of PAC concentrations and distributions in dissolved and particulate fractions. The results from the six sampling campaigns between May 2014 and September 2015 in eight different sites showed that the PAC concentrations ranged between 1.6 to 223.7 ng L-1 in the dissolved fraction ΣPáCTD),and between 1,55 to 105,5 µg g-1 in the
total particulate fraction, with maximum spatial variation of ±35% and ±45% respectively. The dissolved PACs spatial variations were strongly influenced by the hydrological conditions and less spatial variation was observed during high flow events as the result of dilution and homogenization of pollutants. During low flow events, particulate PACSPM-CFC concentrations
were more stable and equivalent in values and distribution to the corresponding PACSPM-FT
samples. Overall it was in a range between 2.8 to 36.3 µg g-1. The dominance of dissolved low molecular weight PAHTD in the low flow events decreased during high flow events due to the
appearance of penta- and hexa-cyclic PAHs. The dissolved polar PACs were as high as the PAHs contribution and also subjected to seasonal changes, the O-PACs ranged between 5.6 to 90.3 ng L-1 and N-PAHs from 1.0 to 42.5 ng L-1. The particulate polar PACs concentrations and contribution were significantly lower, the highest concentrations of 8,76 µg g-1 and 29,41 µg g-1 was observed during high flow event for O-PACs and during low flow event for N-PAH respectively.
Keywords: Continuous flow field centrifuge, Filtration, Orne River, Polycyclic aromatic
hydrocarbons, Polar polycyclic aromatic compounds, Dissolved and suspended particulate matter.
Acknowledgments
I would like to start by addressing my sincerely and gratitude for several people who have supported me to continue this ambitious journey and all those who contributed to the successful completion of this work.
I would like to thank the members of this jury, Cécile Quantin and Johnny Gaspéri who have accepted to report on this work, Emmanuelle Montargès-Pelletier and Catherine Lorgeoux for their invaluable time on evaluation of my thesis, and their helpful feedback.
My sincere gratitude to my supervisors, Fabien Thomas and Laurence Mansuy-Huault for invaluable advice, guidance and encouragement during these extended years.
My work has been performed at the research unit LIEC and I have benefitted from the analytical support and the expertise of the organic geochemistry platform of GEORESSOURCES Lab. I respectfully acknowledge my colleagues, and collaborators from both labs for their support, and collaboration. This work has been developed in the context of the Zone Atelier Moselle and e ei edà theà fi a ialà suppo tà ofà theà áge eà deà l Eauà ‘hi -Meuse and the ANR MOBISED. I would like to thank all these stakeholders and with special thank for Benoît Losson, Claire Delus and Luc Manceau from LOTERR, Christophe Gauthier, Allan Bauer, Delphine Catteloin, Valery Collin, Renaud Gley and Hussein Kanbar for their contributions to the work, and SARM-CRPG for chemical analyses.
Also, I would like to acknowledge the financial support of Erasmus Mundus scholarship and extend my thanks to Stephane Desobry and Delphine Laurent.
Last but not least, I would like to also thank my friends and family all the love and the encouragement they offered me, and for my parents, my wife and lovely two sons for their patient and continuous support all the way long. I dedicate this thesis to them.
Fayez Abuhelou
iv ABUHELOU Fayez |PhD Thesis | Université de Lorraine| 2016
Table of contents
Résumé ... i
Summary ... ii
Acknowledgments ... iii
Table of contents ... iv
List of Figures ... vii
List of Tables ... xii
Annexes ... xii
Abbreviations ... xiii
INTRODUCTION GÉNÉRALE... 1
CHAPTER I: INTRODUCTION ... 6
1. Introduction ... 7
2. Thesis Overview and Objectives ... 10
CHAPTER II: BIBLIOGRAPHIC SYNTHESIS ... 15
PART ONE: THE RIVER COLUMN DISTRIBUTION ... 15
1. Introduction ... 16
2. Definitions ... 16
3. Colloids ... 18
4. Accessible fraction ... 21
PART TWO: POLYCYCLIC AROMATIC COMPOUNDS IN RIVER SYSTEM... 24
1. Introduction: ... 25
1.2 Polycyclic Aromatic hydrocarbons... 25
1.3 Polar PACs ... 28
2. Analysis of PACs in aquatic systems ... 34
2.1 Dissolved and Particulate PACs ... 34
2.1.1 Sampling Methods ... 35
2.1.2 Analytical extraction methods ... 41
2.1.3 Analytical methods ... 49
2.2 Distribution Partition Coefficient ... 51
3. Sources and Molecular Diagnostic Ratios (MDRs) ... 54
4. Legislation and Standards ... 58
CHAPTER III: METHODOLOGY ... 62
1. Study Area and Sampling Sites ... 63
2.1. Elementary and Global Parameters Analysis... 73
2.2. Solid Phase Extraction (SPE) ... 74
2.3. Accelerated Solvent extraction (ASE) ... 76
2.4. Analysis ... 78
Cleanup and Derivatization ... 78
Analysis ... 79
Data processing ... 80
2.5. Quality Control... 81
CHAPTER IV: SUSPENDED PARTICULATE MATTER COLLECTION METHODS AFFECT THE QUANTIFICATION OF POLYCYCLIC AROMATIC COMPOUNDS IN THE RIVER SYSTEM. ... 82
Abstract ... 83
Introduction ... 84
Material and methods ... 87
Characteristics of sampling sites ... 87
SPM collection ... 88
Analytical methods ... 89
Global parameters and elemental content... 89
PAC extraction and analysis... 90
Results ... 91
Sampling campaign characteristics ... 91
PAC concentration and distribution in SPMFT and SPMCFC ... 94
PACs in the SPM of the inlet and outlet waters of the CFC ... 102
Discussion ... 104
Conclusions ... 108
Acknowledgements ... 109
References ... 110
CHAPTER V: SPATIO-TEMPORAL VARIATIONS OF DISSOLVED AND PARTICULATE POLYCYCLIC AROMATIC COMPOUNDS: THE CASE OF ORNE RIVER, FRANCE. ... 113
1. Introduction ... 114
2. Results and discussion ... 116
2.1. River Global Parameters ... 116
2.2. PACs status in the Orne River ... 128
2.2.1. PAC Temporal and Spatial Variations ... 135
Temporal Variations in the Dissolved Fraction ... 135
Spatial Variations in the Dissolved Fraction ... 136
Temporal variations in particulate Fraction ... 139
ABUHELOU Fayez |PhD Thesis | Université de Lorraine| 2016
PAC variation in WWTP samples ... 142
2.2.2. PACs distribution ... 143
Dissolved PAHs distribution ... 143
Particulate PAHs distribution ... 145
Polar PACs distribution ... 147
Spatial PAC distribution ... 151
2.2.3. Influence of the global parameters. ... 156
The influence of the river flow ... 156
The influence of the organic carbon content ... 160
Individual PACs vs global parameters ... 161
Statistical interpolations ... 165
2.3. PAC fluvial concentration in the Orne River ... 170
Partition Coefficient ... 170
2.4. Molecular ratios ... 174
PAH molecular ratios ... 174
Aone/Ant ratio ... 177
2.5. PACs assessment in the Orne River ... 179
Comparison with other river ... 179
Mass flow of PACs in the Orne River ... 183
Comparison to standards and legislations ... 187
Risk quotient (RQ) assessment ... 188
3. Conclusion ... 190
GENERAL CONCLUSIONS AND PERSPECTIVES ... 191
REFERENCE ... 199
ANNEXES ... 220
Chapter I
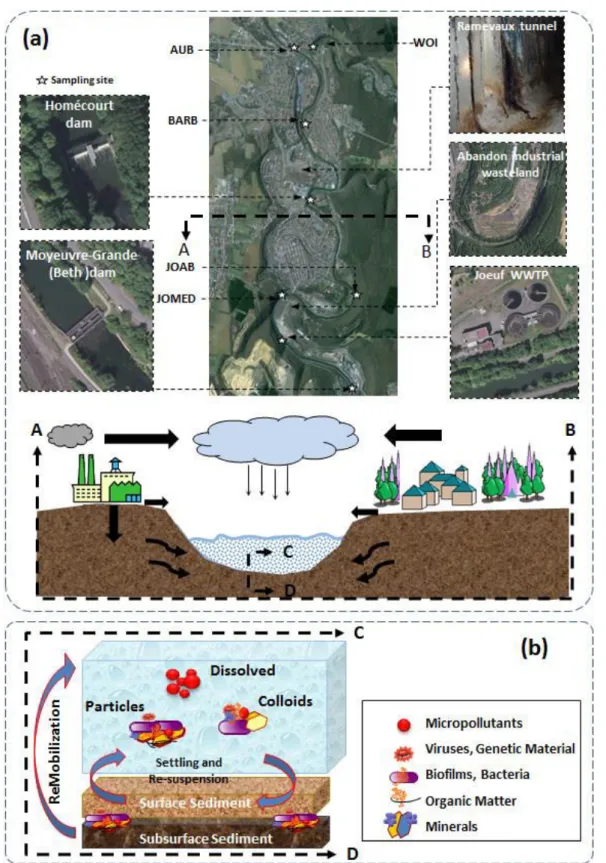
Figure I 1 Conceptual diagram showing (a) Possible PACs petrogenic and pyrogenic emission
sources reaching the river system and (b) The influence of the hydrodynamic conditions on the micropollutants PACs partition in the whole river column, between sediment and particulate matter, colloidal and dissolved compartments. ... 13
Chapter II
Figure II 1 Conceptual diagram showing the size distribution in natural water and several of
the analytical techniques that are used to characterize them. ... 17
Figure II 2 A chemcentric speciation diagram Two trace substances , phenanthrene and
copper are used to illustrate how much chemicals interactions with various constituents may affect their functional speciation ... 20
Figure II 3 This conceptual diagram illustrates the bioavailable and bioaccessible fractions of
a contaminant in soil as defined by physical location. It also describes the relationship of soil-associated contaminant molecules in relation to bioaccessible fraction . ... 22
Figure II 4 Overview of scientific concepts of the bioavailability of organic chemicals ... 23 Figure II 5 The structure of the sixteen PAHs included in the priority list of the USA
Environmental Protection Agency (EPA). The 8 PAHs included in the European Water Framework Directive are in the frames.. ... 26
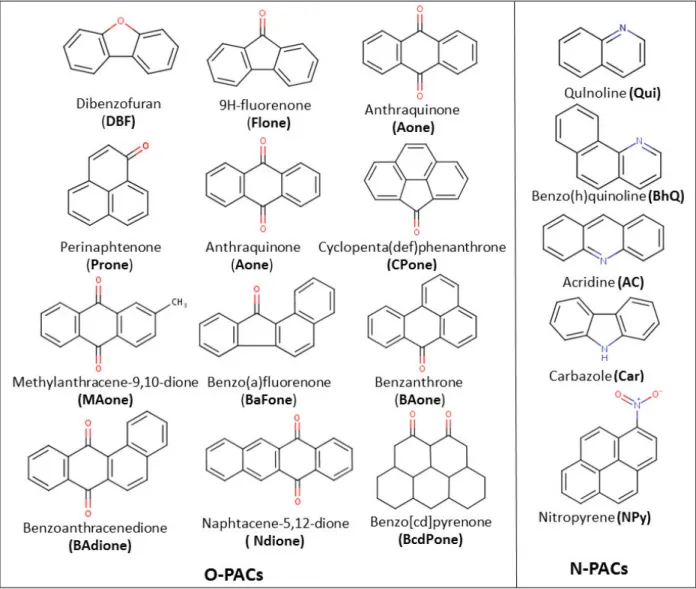
Figure II 6 Sector share of polycyclic aromatic hydrocarbons . ... 27 Figure II 7 Molecular structure for selected polar PACs including O-PACs and N-PACs. ... 29 Figure II 8 Schematic diagram for (a) dead end (frontal) filtration and (b) Crossflow
(tangential) filtration. ... 38
Figure II 9 Schematic diagram for surface filtration by skin layer and depth filtration by filter
medium. ... 40
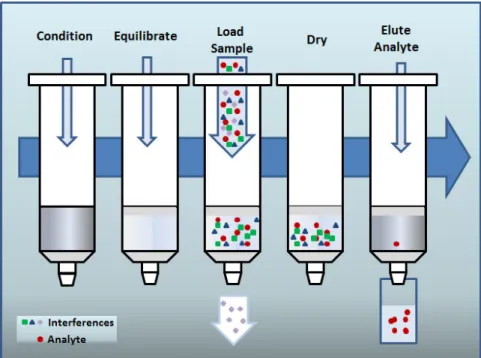
Figure II 10 Representation of liquid–liquid extraction methodology. ... 42 Figure II 11 Representation of solid phase extraction (SPE) methodology ... 43 Figure II 12 Representation of (a) Carboxen–poly(dimethylsiloxane) (PDMS) fiber and (b) the
viii ABUHELOU Fayez |PhD Thesis | Université de Lorraine| 2016
Figure II 13 Representation of conventional Soxhlet apparatus. . ... 46 Figure II 14 Representation Accelerated solvent extraction process. ... 48 Figure II 15 Schematic diagram (a) Gas chromatography (GC) and (b) Liquid chromatography
(LC). ... 49
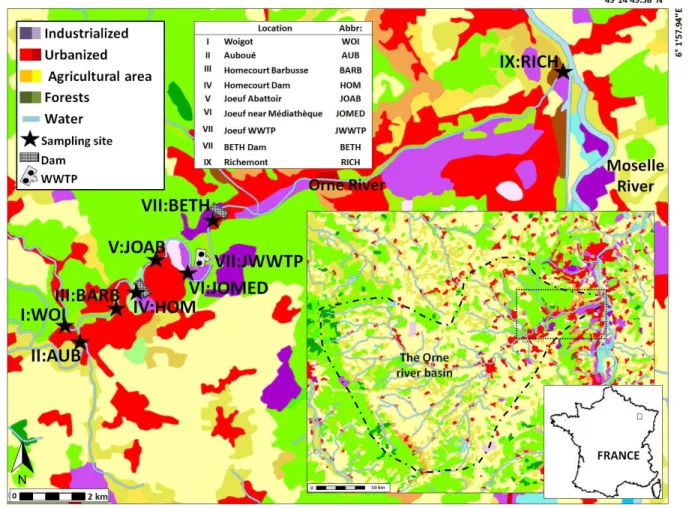
Chapter III
Figure III 1 Study Area land cover, showing the selected sampling sites. ... 63 Figure III 2 The population of the main urbanized area Orne river basin between 1850 -1910. . 64 Figure III 3 The monthly average flow (natural) L O eàMo eu e-Grande A8401010 station
during the period 2003 to 2016. ... 65
Figure III 4 The monthly average minimum and maximum temperature (oC) in the Lorraine region (records from Metz-Frescaty (57) metrological station)... 66
Figure III 5 PAHs concentration in air ambient [ng m-3], fraction particle PM10 at plaine de la Woëvre (Jonville) for the year 2015 (Air-lorraine 2016). BaP: Benzo(a)pyrene, BbF: Benzo(b) fluoranthene, BkF: Benzo(k) fluoranthene, IP: Indeno(1,2,3-cd) pyrene and BghiP: Benzo(g,h,i) Perylene. ... 66
Figure III 6 The iron basin of Lorraine - geological section east –west. ... 68 Figure III 7 The Orne River daily and monthly flow for all sampling campaigns and exact
sampling dates. ... 72
Figure III 8 Schematic representation for sampling and analytical laboratory steps. A)
Represent the SPM collected with CFC (SPM(CFC)) and B) Represent the SPM obtained with
filtration (SPM(FT)) . ... 73 Chapter IV
Fig. 1 Lower part of the Orne River catchment, showing the five selected sampling sites and
the land cover and use. ... 87
Fig. 2 Bo àplotsàofàΣPáH,àa dàΣO-PAC concentrations in SPMFT (a) and (c) and in SPMCFC (b)
and (d) for all samples.. ... 94
Fig. 3 Comparison of the ratios of PAH content in SPMFT over PAH content in SPMCFC (a) and
of polar PAC content (11 O-PACs+ 5 N-PACs) in SPMFT over polar PAC content in SPMCFC
Fig. 4: Ratios of individual PAH concentration in SPMFT over their concentration in SPMCFC
plotted against the log Kow of these PAHs. Black circles represent the campaigns of November 2014 and February 2015, and white circles represent the three other sampling campaigns. ... 100
Fig. 5 Ant/(Ant+Phe) vs Flt/(Flt+Pyr) diagnostic ratios calculated in SPMCFC and SPMFT. ... 102 Fig. 6: Distributions of 17 PAHs in µg g-1 in (a) the SPMCFC . (b) the SPMFTIn-CFC. (c) the SPMFT
Out-CFC and (d) in a linear combination of the distribution of SPMCFC and of ¼ SPMFTOut-CFC .. 104 Chapter V
Figure V 1 (a) Orne river flow record at L O eàMo eu e-Grande A8401010 station during
our study period (The number in the stars represent the sampling campaigns as found in Table V 1) and (b to e) River global parameters record at BETH dam site. ... 122
Figure V 2 Comparison between the normalized global parameters from different sampling
campaign. Each parameter was normalized to the highest value from the same sampling campaign, sites are in upstream to downstream order. global parameters. ... 123
Figure V 3 The automatically recorded daily average river flow measurements [m3 s-1] at BETH and JOAB site. ... 124
Figure V 4 The relation between water Temperature [oC] with the conductivity [mS cm-1]. .... 125
Figure V 5 The relation between water Temperature [oC] the dissolved O2 [DO; mg L-1]. ... 126 Figure V 6 The univariate plot for (a) dissolved PACTD ng L-1, (b) particulate PACSPM-FT and (c)
particulate PACSPM-CFC for all samples (JWWTP is not included) during all sampling
campaigns in the Orne River. ... 128
Figure V 7 (a) Dissolved PACs distribution and fractionation in all sampling campaigns in
addition to the four JWWPT efflunt samples at the right and (b) particulate PACs distribution and fractionation in all sampling campaigns in addition to the two JWWPT efflunt samples at the right . ... 137
Figure V 8 Ternary diagrams of the (a) dissolved PACs distribution and (b) particulate PACs
distribution for SPMFT and SPMCFC samples ... 138 Figure V 9 The ternary diagrams of temporal distribution of dissolved PAHs according to
their molecular weight. ... 145
Figure V 10 The ternary diagrams of temporal distribution of particulate PAHs according to
x ABUHELOU Fayez |PhD Thesis | Université de Lorraine| 2016
Figure V 11 The ternary diagrams of (a) dissolved O-PACs distribution (LMW 180:
DBF,Flone &Prone, 204 à MMW : Aone, CPdefpone, MAone and the HMW 230:à (BaFone, Baone, Badion, Ndione & BcdPone) and (b) the dissolved N-PACs distribution (LMW =129: Qui, MMW = 167: Car and HMW 179: BhQ, Ac and Npy). ... 149
Figure V 12 (a) The ternary diagrams of particulate O-PACs distribution . ... 150 Figure V 13 (a) and (b) the particulate 5 N-PACs distribution.in SPMFT and SPMCFC
respectively. ... 151 Figure V 14 Comparison of the dissolved PACTD distribution for (a) February 2015 and (b)
May 2015 sampling campaigns.. ... 153
Figure V 15 Comparison of the PAH distributions in SPMCFC (hatched bars) and SPMFT (plain
bars) in (a) February 2015 samples and (b) May 2015 samples). ... 155
Figure V 16 ΣPáHTD,àΣO-PACTD andΣN-PACTD vs the (a) average daily river flow [m3 s-1] and (b)
dissolved orgonic carbon (DOC) values [mg L-1] for different sampling sites at different sampling campaigns. ... 157
Figure V 17 ΣPáHSPM-FT,àΣO-PACSPM-FT andΣN-PACSPM-FT vs the (a) average daily river flow [m3 s -1
] and (b) particulate organic carbon (POC) values [mg g-1] for different sampling sites at different sampling campaigns. ... 158
Figure V 18 ΣPáHSPM-CFC,àΣO-PACSPM-CFC andΣN-PACSPM-CFC vs the (a) average daily river flow
[m3 s-1] and (b) particulate organic carbon (POC) values [mg g-1] for different sampling sites at different sampling campaigns. ... 159
Figure V 19 The concentrations of selected dissolved LMW PAC(TD)[ng L-1] against the
corresponding (a) dissolved origin carbon (DOC; mg L-1] and (b) the river daily flow [m3 s
-1
]. ... 162
Figure V 20 The concentrations of some particulate PACSPM [µgg-1] against the corresponding
(a) POC [mg g-1] and (b) the river daily flow [m3s-1]. ... 164
Figure V 21 Principal component analysis PCA where with the global parameters (i.e. POC,
DOC, Flow and Temperature) are used as variables against the dissolved and particulate ΣPáC.. ... 166
Figure V 22 Principal component analysis PCA where with the global parameters (i.e. POC,
DOC, Flow and Temperature) are used as variables with (a) the dissolved and (b) particulate SPMFT and (c) SPMCFC molecular weight ratios.. ... 167 Figure V 23 The temporal variation in the total PACs fluvial concentration (PAC(tot) [ng L-1]) at
Figure V 24 The partition coefficient (logKd; L g-1) for SPMFT and SPMCFC vs total suspended
solid content (TSS; mg L-1) for (a) PAHs and (b) polar PACs. ... 172
Figure V 25 The Koc values(log Koc ) [L g-1] plotted against the Log Kow vlaues for detected PAHs (i.e. LMW PAH < 6.11) for selcted SPMFT and SPMCFC AUB february and May 2015
samples. ... 174
Figure V 26 Isometric ratios molecular diagnostic ratios (MDRs) in particulate fraction: (a)
Flt/(Flt+Pyr) vs Ant/(Ant+Phe) in and (b) Flt/(Flt+Pyr) vs BaA/(BaA+Chr).. ... 176
Figure V 27 The River water flow [m3 s-1] vs the Aone/Ant ratio for (a) dissolved fraction and (b) the SPMFT and truly SPMCFC particulate samples. ... 178 Figure V 28 The ΣPAH concentration ranges in (a) [ng L-1] in water and (b) [µg g-1] in SPM
(when available) from different sites around the word, in comparison with the BETH site temporal record.. ... 182
Figure V 29 The loading ranges of PACs in Orne River [kg yr-1]. Naph is not included in the ΣPáHs.. ... 184
Figure V 30 The loading ranges of all PACs in Orne River [kg yr-1]. (a) for PAHs and (b) for OxyPAHs and NPAHs.. ... 186
Figure V 31 Risk quotient (RQ) assessment based on the comparison with negligible
concentrations (NCs) and the maximum permissible concentrations (MPCs) for PAHs in aquatic environment (a) in water [ng L-1] and (b)in particulate [µg g-1], with the use of sediment RQs. ... 189
xii ABUHELOU Fayez |PhD Thesis | Université de Lorraine| 2016
List of Tables
Table I-1 Polycyclic Aromatic Compounds (PACs) with their abbreviations (Detailed
physic-chemical properties are provided in Table II 1)... 12
Table II 1 PACs Compounds considered in this study with their: CAS registry number,
molecular formula, Molecular Weight (MW), octanol-water partitioning coefficient (log Kow) and aqueous solubility (S at 25oC]). ... 33
Table II 2 PAH Isomer ratios for Major emmisson sources. ... 55 Table II 3 Commonly used PAH molecular diagnostic ratios MDRs. ... 56 Table II 4 Part of The European Water Framework Directive (2000/60/CE) PAHs as priority
substances and proposed Environmental Quality Standards (EQS)... 59
Table II 5 The negligible concentrations (NCs) and the maximum permissible concentrations
(MPCs) for PAHs in aquatic environment. ... 61
Table III 1 Target PACs and their corresponding Quantification and Extraction Standard
compounds. ... 76
Chapter IV
Table 1 Physical-chemical parameters at each sampling campaigns ... 93 Table 1 PAC concentrations in SPMCFC [µg.g-1]. ... 97
Table 3 PAC concentrations in SPMFT [µg g-1]. ... 99 Table 4 PAC concentrations in µg g-1 in the SPMCFC and in the SPM collected by filtration of
the waters entering the CFC (SPM In-CFC) and of the waters collected at the outlet of the
CFC (SPMFTOut-CFC).. ... 103 Table 5 Comparison of PAH concentrations and LMW/HMW in SPM collected in the
literature according to the sampling methods. ... 106
Table V 1 The measurements of several river global parameters recorded during each site
visit. ... 118
Table V 2 Detailed results of the dissolved PACs (PACTD) concentration [ng L-1]. ... 129 Table V 3 Detailed results of particulate PACs (PACSPM) [µg g-1]. ... 131
Annexes
Table Annex 1 Descriptive statistics for (a) dissolved PACTD ng L-1, (b) particulate PACSPM-FT
and (c) particulate PACSPM-CFC for all samples ... 220 Table Annex 2 Descriptive statistics for the loading ranges of all PACs in Orne River [kg yr-1] . 221
Abbreviations
ASE : accelerated solvent extraction CAS : Chemical Abstracts Service CFC : Continues flow centrifuge DCM: dichloromethane
DOC dissolved organic carbon CCF : cross-flow ultrafiltration DOM : dissolved organic matter
EQS : Environmental Quality Standards FT: Filtration with fiber glass filters
GC-MS : Gas Chromatography- Mass spectrometry KOW :octanol water partition coefficient
LDPE : low density polyethylene LLE : liquid–liquid extraction log Kd :sorption coefficients
log Koc : organic carbon referenced sorption coefficients MW : Molecular weight
N-PAHs or (N-PACs): nitrogen heterocyclic polycyclic aromatic
NSO-PAC : PACs that somewhere in the molecule contain one (or several) nitrogen, sulfur, or oxygen atoms
OMP : organic micro-pollutants
O-PAC, OxyPAH : oxygenated polycyclic aromatic hydrocarbons PAC: Polycyclic aromatic compounds
PAH : Polycyclic aromatic hydrocarbons
PAHTD : Total dissolved polycyclic aromatic hydrocarbons PEC: Probable effect concentration
PNEC : Predicted no effect concentration POC: Particulate organic carbon
POM: Particulate organic matter POPs :Persistent organic pollutants RQ: Risk quotient
RQ NCs risk quotient negligible concentrations
RQMPCs risk quotient maximum permissible concentrations SPD size particulate disruption
SPE: Solid Phase Extraction
xiv ABUHELOU Fayez |PhD Thesis | Université de Lorraine| 2016
SQGs :Numerical sediment quality guidelines TD : Total dissolved compartment
TEC : Threshold effect concentration TOC: Total organic carbon
tot-PACs, ΣPAC :summation of total PACs (in our case: 16 PAHs +11 O-PAC+ 5 N-PAH). USE: ultra-sonication
2 ABUHELOU Fayez |PhD Thesis | Université de Lorraine| 2016
Vue d'ensemble et objectifs
Les composés aromatiques polycycliques (CAP) sont émis à partir de sources principalement de combustion et en moindre proportion de sources pétroligènes (Andersson et al. 2006 et Shi et
al. 2005). Ils sont transportés vers le système fluvial par les dépôts atmosphériques humides ou
secs ou pa àlesà ejetsàd efflue tsàda sàla rivière. Lorsque les CAP atteignent les masses d'eau, ils sont distribués entre la fraction dissoute sous forme libre ou associés à la matière organique dissoute et colloïdale (DOM), et la fraction particulaire, adsorbés ou associés aux matières en suspension en suspension pour finalement se déposer dans les sédiments du lit de la rivière
(Ademollo et al. 2012). La distribution des CAP dans les différents compartiments dépend de
leur hydrophobie, de la teneur totale en matières solides en suspension (TSS), de la teneur en colloïdes et en carbone organique (Moeckel et al. 2013, Moeckel et al. 2014 et Qin et al. 2014). Ainsi, les hydrocarbures aromatiques polycycliques (HAP) les plus hydrophobes seront associés aux particules et ensuite déposés dans les sédiments de la rivière, qui sont de ce fait des réservoirs et des sources potentielles de diffusion des contaminants en cas de remobilisation de ces sédiments (Jeanneau et al. 2007). De plus, les caractéristiques environnementales et hydrodynamiques (débit d'eau, température et vitesse de l'eau, etc.) interfèrent et contrôlent les variations spatiales et temporelles des CAP (Jeanneau et al. 2008).
En conséquence, le suivi des conce t atio sàtotalesàdeàCáPàda sàl e se leàdeàlaà olo eàd'eauà est essentiel pour la protection efficace des écosystèmes aquatiques. Cela nécessite des méthodes analytiques capables de mesurer les très faibles concentrations dans la phase aqueuse et dans les matières en suspension, respectivement en ng L-1 etàμgàg-1. Le choix des
thodesà deà s pa atio à e t eà f a tio sà dissouteà età pa ti ulai eà està aussià esse tielà puis u ilà o ditio eà ot eàapp o heàdeàlaàdist i utio àdesàCáPàda sàlaà olo eàd eauà(Namiesnik et al. 2005).à Ilà està gale e tà essai eà deà ett eà e à pla eà u à pla à d ha tillo ageà pe etta tà d app he de à lesà a iatio sà spatio-temporelles de la qualité des eaux de rivière. Les CAP polaires ont été récemment identifiés comme des polluants émergents dans l'environnement, mais ils ne sont toujours pas réglementés dans les milieux aquatiques. De plus, la quantification à l'échelle moléculaire et l'utilisation de rapports moléculaires permettent de distinguer les sources de polluants (Yunker et al. 2002 et Katsoyiannis & Breivik 2014), ce qui peut aider à la mise en place de mesures d'atténuation de la pollution.
L o je tifàdeà eàt a ailàestàd tudie àlaà a ia ilit àa uelleàdeàlaà ualit àdesàeau àd u eà i i eàauà t a e sà d u à sui ià ulti-sites et de a pag esà d ha tillo ageà guli esà ou a tà desà situatio sàh d ologi uesà a i esàsu àu eàp iodeàd u àa àetàde i.àLaà i i eà hoisieàpou à etteà tudeàestàl O e,àu àafflue tàdeàlaàMoselle,à oula tàda sàu eà all eàauàpass ài dust ielàlou dà marqué par un si leà deà sid u gie.àDa sàu à telà o te te,à l utilisatio àduà ha o à età duà okeà dans les différents procédés industriels a généré une forte contamination en composés aromatiques polycycliques encore très prégnante dans les sols de friches industrielles de cette vallée. Ce sont donc ces composés qui ont été ciblés dans cette étude en incluant les 16 HAP réglementaires et en y ajoutant des CAP polaires (11 oxygénés (O-CAP) et 5 composés azotés-PAC (N-CAP) (Table I 1). Les CAP polaires sont produits par les mêmes réactions que les HAP mais peuvent aussi être des produits de dégradation de ces mêmes HAP. Ils sont étudiés dans les sols pollués depuis quelques années (Lundstedt et al. 2007) et leur plus grande solubilité laisseàpe se à u ilsàso tàplusàfa ile e tàtransférés vers le milieu aquatique.
4 ABUHELOU Fayez |PhD Thesis | Université de Lorraine| 2016
Les principaux objectifs de cette thèse sont les suivants:
A- Réaliser un suivi qualitatif et quantitatif de long terme des CAP distribués dans la olo eàd eauàda sàdiff e tsà o te tesàh d ologi ues.
Par la description deà esà a iatio sàetàlaà o p he sio àdeàl o u e eàetàdeàlaàdist i utio àdesà CáPàda sàlaà olo eàd eau,àilàse aàpossi leàdeàd fi i àu à tatàdeà f e eàdeàlaà ualit àdesàeau à deà l O e.à Cetteà eilleu eà o p he sio à duà fo tio e e tà deà laà i i eà peut fournir, à terme, des critères pour une meilleure gestion de réseaux hydrographiques contaminés (Figure 1).à L a uisitio à deà tellesà do esà passeà pa à laà iseà e à pla eà d u à dispositifà deà te ai à permettant de suivre en continu les variations du débit et de paramètres globaux tels que la te p atu e,àlaà o du ti it à le t i ue,àleàpH…àIlàs appuieàaussiàsu àu eào ga isatio à igou euseà desà a pag esà deà te ai à pe etta tà l a uisitio à d ha tillo sà o u sà a al s sà pa à différentes équipes de recherche.
B- Comprendre ce que l'on mesure en explorant l'influence des méthodes d'échantillonnage sur la quantification des PAC dans le réseau hydrographique
(Chapitre IV).
Les techniques de séparation des matières en suspension sont déterminantes dans la compréhensio à deà l o u e eà desà o pos sà da sà lesà f a tio sà pa ti ulai esà età dissoutes.à “ià desà tudesàseàso tài t ess esà à etteà tapeà u iale,àpeuà oi eàau u eà eàl o tà tudi àda sàleà cas particulier des CAP. Notre étude nous a amené à utiliser deux méthodes de séparation des ati esà e à suspe sio ,à l u eà lassi ue e tà utilis eà pou à dose à lesà HáPà pa ti ulai es,à laà filt atio à età l aut e,à oi sà ou a te,à la centrifugation en flux continu de terrain (CFC) Les
concentrations et la répartition des PACs mesurés dans les particules en suspension collectées par filtration et par centrifugation seront comparées etàl i flue eàdeàlaàte h i ueàdeàs pa atio à sur la quantification et la distribution des CAP particulaires sera discutée.
C- Comprendre la concentration et la répartition spatio-temporelles des PAC dans une rivière dite industrielle (Chapitre V).
Desàp ospe tio sàdeàte ai àsu àleà ou sàdeàl O eào tàpe isàdeà ett eàe à ide eàu à e tai à o eàd a u ulatio sàs di e tai esàp se ta tàdesà i eau àdeà o ta i atio àe àCAP très élevés dès 10 cm de profondeur de sédiments. Par ailleurs, les nombreuses friches industrielles uiàjalo e tàlaà all eàdeàl O eà ep se te tàdesàsou esàpote tiellesàdeà o ta i atio s.àDa sà u àtelà o te te,à ousàa o sà tudi àl o u e eàdesàCáPàda sàlaà olo eàd eau,àleu à pa titio à entre la fraction dissoute et la fraction particulaire et la distribution moléculaire des CAP dans les différentes situations hydrologiques lors de nos 6 campagnes de terrain entre 2014 et 2015 su à à sitesà deà l O eà i dust ielle.à L o je tifà taità d tudie à l i flue eà desà o ditio sà h d ologi uesà su à lesà o e t atio sà e à CáPà da sà laà i i e,à d ide tifie à lesà sou esà desà CáPà selon les conditions hydrologiques et le cas échéant de proposer des processus déterminant ces concentrations.
Chapter I: Introduction
6 ABUHELOU Fayez |PhD Thesis | Université de Lorraine| 2016
1.
IntroductionWith the continuous development of human industrial and agricultural activities, concurrently with population increase and climate change, numerous natural and anthropogenic pollutants found their ways to natural water cycle and aquatic ecosystems. These pollutants have a great influence on the water quality, leading to aquatic ecosystem disturbance and cause a loss of habitats and reduce biodiversity (Lepom et al. 2009).Monitoring such pollutants, specifically in river systems, becomes an essential requirement to understand the consequence of the increasing anthropogenic impact on the environment and various water quality problems. Since the thirties of the last century, organic pollutants raised the top of the list of importance in water quality issues (Meybeck et al. 1996 and WHO 1996). Assessment of the polycyclic aromatic compounds (PACs) quality status, as part of persistent organic pollutants (POPs), provided an important and unique perspective on the effectiveness of reducing emissions and lowering of exposure (Lohmann & Muir 2010).
To formulate adequate pollutant control strategies, several aspects had to be taken into account, starting with the use of simple acceptable cost protocols for both quantification and qualification of different hazard pollutants at very low detection levels (WHO 1996). And since water quality parameters inherit the drainage basin characteristics and are highly controlled by the hydrological factors (Horowitz 2013), the spatial and temporal patterns of occurrence, partition and behavior of pollutants in all river compartment shall be included as well. This implies that while seeking a better assessment of the chemical quality status of rivers, the suspended particulate matter compartment must be included (Patrolecco et al. 2010 and
Chapter I: Introduction
8 ABUHELOU Fayez |PhD Thesis | Université de Lorraine| 2016
Chiffre et al. 2015), and samples must be spread at different times of the hydrological year or by
introducing long-term measurements (Vrana et al. 2014).
The development of environmental monitoring standards of legislations is a necessity to improve the elimination of such pollutants, by treatment and control of emissions (Greenwood
et al. 2007). As one of the important environmental legislations, the primary objective of the
European Unions Water Framework Directive (WFD) is to be able to prevent environmental deterioration and to protect the ecosystem degradation caused by dangerous substances affecting the flora and fauna (EU 2000). These objectives can be achieved by defining the pollutants and their concentrations in the environment, toxicity levels and the degree of availability and bio-availability and finally by enforcing adequate management plans and strategies. The successful WFD implementation involves reliable and comparable data, in which available low-cost tools technologies that provides appropriate quality are used by different EU member states (Mostert 2003 and Coquery et al. 2005). The successful application requires a clear understanding of what exactly is being measured in the field along with quality assurance structures and/or method validation that ensure reliability and comparability of data (Allan et
al. 2006).
The WFD provides Environmental Quality Standards (EQS) expressed as total concentrations in the whole-water sample, in [µg L-1], for priority substances and other pollutants. These EQSs are continuously updated. Meanwhile, monitoring is expected to follow a list of 45 priority substances, in which inorganic and organic pollutants are included (EU 2013). Still, more attention needs to be paid to the distribution of chemical pollutants between suspended
particulate matter and the liquid fraction (Lepom et al. 2009) and to the reduction of the over/underestimation of these pollutants. In the aquatic ecosystem assessment, the sediments and SPM compartments were more reliable than only taking surface water samples (Chiffre et
al. 2015). In addition to that, the frequencies of surveillance and monitoring period in rivers,
which were assigned to 1 month for organic pollutants, is also a critical issue to take into account the variability in parameters resulting from both natural and anthropogenic conditions
(EU 2000).
The PACs are already included in WFD regulation but with a major focus on only 16 parent PAHs, whereas other PAHs and heterocyclic-PACs are not yet included. This limits the potential toxicity description and therefore it is an initial step to include such potentially hazardous substances in surface water monitoring. Several methods and technologies were introduced and applied to assess PACs in environment. However, despite the limitation of temporal and spatial resolution and the absence of bioavailability information, the spot sampling followed by instrumental analytical measurements to determine pollutant concentrations have been significantly applied for water quality monitoring (Allan et al. 2006).
Chapter I: Introduction
10 ABUHELOU Fayez |PhD Thesis | Université de Lorraine| 2016
2.
Thesis Overview and ObjectivesPolycyclic aromatic compounds (PACs) are emitted from petrogenic and pyrogenic sources
(Andersson et al. 2006 and Shi et al. 2005), and brought to the river system through
atmospheric wet/dry deposition or loaded with runoff discharged into the river. However, when PACs reach water bodies they are partitioned between dissolved and suspended solid fractions to be eventually found in several forms: freely dissolved fraction, bounded to dissolved organic matter (DOM) and colloidal, adsorbed or associated to suspended particulate matter (SPM) then deposited in the river bed sediments (Ademollo et al. 2012). The PAC concentrations and distribution vary between the different water compartments according to their hydrophobicity and with the influence of total suspended solids (TSS) content, colloidal and organic carbon content (Moeckel et al. 2013). Indeed, PAHs and dissolved organic carbon (DOC) relation appeared partly dependent on the molecular weight of PAHs, particularly the five or more aromatic rings (Moeckel et al. 2014 and Qin et al. 2014).More hydrophobic PAHs are expected to be associated to particulate matter and then to be deposited in the river sediments, which are then expected to act as reservoirs and diffusive sources (Jeanneau et al. 2007). In addition, the environmental and hydrodynamic characteristics (river flow pattern, water temperature and velocity etc.) are also expected to interfere and control the PAC spatial and temporal variations
(Jeanneau et al. 2008).
Accordingly, the monitoring of the total PAC concentrations in the whole water column is essential for conducting concrete ecosystem protection. This requires capable analytical methods that measure the very low concentrations in aqueous and suspended matter fraction,
in ng L-1 and µg g-1 respectively. It is necessary also to conduct a combination of temporally monitoring based on spatial network of sampling sites. The dissolved concentrations of PACs using conventional methods are often overestimated due to the inclusion of PAHs associated with colloids and small particles (Namiesnik et al. 2005). Polar PACs were recently introduced as emergent pollutant in environment, but still not regulated in rivers systems. Furthermore, the use of common molecular diagnostic ratios (MDRs) allows to distinguish between sources of pollutants (Yunker et al. 2002 and Katsoyiannis & Breivik 2014), which is usefully applied in pollution mitigation measures.
This study aims to contribute in knowledge, data and records of water quality and quantity balances in the Orne River, a river in past industrial valley and tributary of Moselle River. This work contributes to a multidisciplinary integrated joint action within several cooperative programs concerned with qualitative impact of water flow modifications. This study is a first of its kind in this area. It is also featured with the extended list of target PACs explored in aqueous environment for the first time, which includes polar PACs (i.e. 11 Oxygenated -PACs (O-PACs) and 5 nitrogen-PACs compounds (N-PACs) in addition to the common 16 parent Polycyclic Aromatic Hydrocarbons (PAHs) (Table I 1).
Chapter I: Introduction
12 ABUHELOU Fayez |PhD Thesis | Université de Lorraine| 2016
Table I 1 Polycyclic Aromatic Compounds (PACs) with their abbreviations (Detailed physic-chemical properties are provided in Table II 1).
Compound Name Abbr. Compound Name Abbr.
PAHs N-PACs
1 Naphthalene Naph 1 Quinoline Qui
2 Acenaphthylene Acy 2 Benzo(h)quinoline BhQ
3 Acenaphthene Ace 3 Acridine AC
4 Fluorene Flu 4 Carbazole Car
5 Phenanthrene Phe 5 Nitropyrene NPy
6 Anthracene Ant O-PACs
7 Fluoranthene Flt 1 Dibenzofuran DBF
8 Pyrene Pyr 2 9H-fluorenone Flone
9 Benz[a]anthracene BaA 3 Perinaphtenone Prone
10 Chrysene Chr 4 Anthraquinone Aone
11 Benzo[b]fluoranthene Bbf 5 Cyclopenta(def)phenanthrone CPone 12 Benzo[k]fluoranthene Bkf 6 Methylanthracene-9,10-dione MAone
13 Benzo[a]pyrene BaP 7 Benzo(a)fluorenone BaFone
14 Indeno[1,2,3-c,d]pyrene IcdP 8 Benzanthrone BAone
15 Dibenzo(ah)anthracene DahA 9 Benzoanthracenedione BAdione 16 Benzo[ghi]perylene BghiP 10 Naphtacene-5,12-dione Ndione
11 Benzo(cd)pyrenone BcdPone
The main objectives of this thesis are the following:
A- Conducting a PACs quality assessment to provide generic elements for a better
management of possible contaminated river systems.
Overall, the aim is to provide generic elements for a better management of possible contaminated river system by better understanding the occurrence and distribution of released PACs into the water column (Figure 1). The outcome results shall be integrated with other multidisciplinary results for a better pollution assessment and prospective.
Figure I 1 Conceptual diagram showing (a) Possible PACs petrogenic and pyrogenic emission sources reaching the river system (the study area of the Orne river is taken as an example and further details and sampling sites are discussed later in Chapter III.1) and (b) The influence of the hydrodynamic conditions on the micropollutants PACs partition in the whole river column, between sediment and particulate matter, colloidal and dissolved compartments.
Chapter I: Introduction
14 ABUHELOU Fayez |PhD Thesis | Université de Lorraine| 2016
B- Better understanding what exactly is being measured by exploring influence of
sampling methods on the quantification of PACs in the river water system (Chapter IV). Up to know, none has reported the use of the field continuous flow centrifuging (CFC) in PACs studies, neither the inclusion of the polar PAC quantification in the river system. The particulate PAC concentrations and distribution will be compared between the simultaneous CFC and filtration suspended particulate matter (SPM) samples.
C- Better understanding of temporal and spatial PAC concentration and distribution in the
river compartment (Chapter V).
This study is based on river multi-compartment analysis in which total dissolved and particulate PAC concentrations are explored. It also extends to include the spatial and temporal variations in the occurrence, concentration, distribution of the PACs in the river water column. We explore the influence of the river hydrological condition and changes in other river parameters. We define the spatial and temporal occurrence and distribution of PACs at the molecular level content in the aqueous/water and particulate fraction, monitor the dissolved/particulate PACs partition behavior, identify molecular markers characteristics and link it with possible sources of pollutants. This was ensured by the six successive sampling campaigns at different times of the year, different hydrological conditions, at sequential sampling site along the river path.
CHAPTER II:
BIBLIOGRAPHIC SYNTHESIS
Chapter II: Bibliographic Synthesis
16 ABUHELOU Fayez |PhD Thesis | Université de Lorraine| 2016
1. Introduction
The partition of natural and anthropogenic chemicals between different fractions/ compartments in aquatic systems is considerably controlling their occurrence, transport, fate and biological effect. In order to understand the cycling of trace chemicals and to assess pollutants status in natural waters, an essential step is to define and functionally distinguish between the whole water column fractions. Understanding these various transport and transformation processes greatly depends on the capabilities of sampling, fractionation and isolation of what is being studied, in terms of relevant physicochemical properties of the system. However, the precise definitions of natural water size fractions, which may range from small molecules to particles in millimeters range, are yet not well established.
2. Definitions
The aquatic compartments are usually defined based on physical parameters and size considerations (Gustafsson & Gschwend 1997). The conventional distinction between dissolved and particulate fractions was first applied with the use of 0.5 µm cellulose acetate membrane filters by (Goldberg 1945). No natural cutoff exists between these two fractions and historically the separation was based on the arbitrary criteria of filter pore sizes neglecting the overlapping between them. It is generally operated through 0.45 µm filters cut-offs (Aiken et al. 2011)
(Figure II 1). However, natural organic matter is a highly complex mixture and can be found in
different fractions in hydro-systems and with different forms: grains, microparticles, macro molecules and nanoparticles and in the form of molecules and ions. The aquatic scientists have
already developed and worked with several based on size separation methods: sieving, sedimentation flow fractionation, filtration techniques and continuous flow centrifuging (CFC)
(Figure II 1). The particulate matter (PM), which is primarily composed of aggregates that settle
down due to gravity, can be separated from the total dissolved matter (TD) through filtration at 0.5 µm. The size range of colloidal matter (CM), all small aggregates that do not settle, extent from about 1nm to few µm, and can be operationally separated from the truly dissolved matter (tDM) at 20 nm (Jeanneau et al. 2007). Although, colloids can be found at 10nm (= 100 Å).
Figure II 1 Conceptual diagram showing the size distribution in natural water and several of the analytical techniques that are used to characterize them. modified after ((a):Kammer et al. 2003
Chapter II: Bibliographic Synthesis
18 ABUHELOU Fayez |PhD Thesis | Université de Lorraine| 2016
For a better understanding of pollutant partitioning in the water column, the dissolved organic carbon (DOC) and colloids were isolated by the use of Cross-flow ultrafiltration (CFF)(Liu et al. 2005), or by including both total and freely dissolved concentrations with the use of passive samplers (Dong et al. 2013) toà eàdefi edàasà third phase .
Many of aquatic studies are still following this separation, using the non filterable versus filterable particulate fractions with the use of membrane filtrations, i.e. >0.45 µm in size (Ran et
al. 2000). This separation is criticized arguing that colloidal matter is the major contributor of
filter-passing organic matter (Sharp 1973) and thus it does not allow to accurately trace chemical behaviors in environmental systems (Gustafsson & Gschwend 1997). Theoretically, the combination between CFC and membrane filtration might eliminate this deviation. The CFC utoffà≈à3 to 5 µm will exclude colloids contribution in the particulate fraction separated by CFC. This means that the effluent of CFC contains mainly colloids and small-sized particles which are possibly retained by filters (Figure II 1). Still this depends on several factors: physico-chemical properties of colloids, SPM content and the environmental and hydrological conditions.
3. Colloids
Recently more attention was paid for colloids in aquatic environment, due to their small size and large specific area, and thus higher reactivity, mobility and high adsorption potential
(Graham et al. 2008). An increasing number of studies included the nature and role of colloidal
material in marine biogeochemistry (Carlson et al. 1985; Buesseler et al. 1996; Guo & Santschi 1996 and Gustafsson & Gschwend 1997). Reports and field studies pointed out the important impact of colloids on the speciation of low solubility chemicals, such as n-alkanes and PAHs
(Boehm & Quinn 1973; Dong et al. 2013 ; Nielsen 2015), polychlorinated biphenyl (PCB) (Baker
et al. 1986), inorganic constituents and trace elements (Sholkovitz 1976; Orlandini et al. 1990
and Ran et al. 2000) and pharmaceuticals and estrogenic chemicals (Maskaoui & Zhou 2010 and
Duan et al. 2013). Still, the role of colloids is not fully understood and requires further
exploration in regard to their impacts on pollutants, interactions, transport and bioavailability
(Lead & Wilkinson 2006).
I àtheàt aditio alà he ist ,à olloidsà e eàsetàa o di gàtoàthei àsizeàli its,ài.e.à a ào ga i ào à inorganic entity large enough to have a supramolecular structure and properties that differ markedly from those of the aqueous fraction alo e à(Wilkinson & Lead 2007). Aquatic colloid definition was proposed by (Gustafsson & Gschwend 1997) asà a à o stitue tàthatàp o idesàaà molecular milieu into and onto which chemicals can escape from the bulk aqueous solution, hileàitsà e ti alà o e e tàisà otàsig ifi a tl àaffe tedà àg a itatio alàsettli g àasàe plai edài à
Figure II 2. This definition is based on two assumptions, first is distinguishing colloidal phases as
those that exhibit medium properties (e.g. nonpolar medium, surface potential) and second is separating gravitoidal phases based on their propensity to settle (i.e. large, favorable shape and dense enough). With this definition, the colloidal state is not limited to solids only, it might include liquid sorbent and gravitoids which are separated through gravitational settling may not be qualified as colloids.
Mostly, colloids were assigned to particles in the size range between of 1 nm to 0.4 µm (Sigleo
et al 1990; Chin et al 1991; Kammer et al. 2003) or 1nm to 1 µm (Gilbert et al. 2009).Colloidal
matter in natural waters can be collected by various separation methods including dialysis, reverse-phase separation adsorption and ultrafiltration (Liu et al. 2005 and refrences therin).
Chapter II: Bibliographic Synthesis
20 ABUHELOU Fayez |PhD Thesis | Université de Lorraine| 2016
Colloidal investigation is limited with the problem of obtaining sufficient amounts of colloidal material for physico-chemical analysis and chemical quantification (Whitehouse et al. 1990) and the undesired fractionation of colloidal components when using the cross-flow ultrafiltration
(Gustafsson et al. 1996). Colloids were practically distinguished with the use of reversed-phase
C18 solid phase extraction disks (Brown & Peake 2003)and by cross-flow ultrafiltration 20 nm to
0.5 µm (Jeanneau et al. 2007). An equilibrium dialysis procedure was used to assess the distribution coefficients of major and trace elements between formally defined colloidal or high molecular weight (1 kilo Dalton – 0.22 µm) and truly dissolved low molecular weight (<1 kDa) forms (Vasyukova et al. 2012).
Figure II 2 A chemocentric speciation diagram. Two trace substances , phenanthrene and copper are used to illustrate how much chemical interactions with various constituents may affect their functional speciation (Gustafsson & Gschwend 1997).
Theà dis ussio à a ou dà theà te sà pa ti les à a dà olloids à et ee à diffe e tà dis ipli esà a d different researchers is continuous. The true size distribution of naturally occurring colloids and particles is not confirmed. However, as shown in Figure II 1, a simplified size distribution based on approximate size ranges of several colloidal characterization techniques was given. Apparently, homogeneous colloid types are often spread over several orders of magnitude
(Wilkinson & Lead 2007).
4. Accessible fraction
Overall, total extraction techniques were found unable to distinguish between contaminants that are irreversibly adsorbed to particle fraction and those that can be easily partitioned and released to the water column (Vrana et al. 2014).
Another important question while studying the water column is also how to distinguish the chemicals bioavailable fraction to obtain a realistic risk assessment. The realistic assessment must include the consideration of bioavailability, that can be measured with explainable chemical method, such as passive sampling (PS) approach (Akkanen & Kukkonen 2003;
Greenwood et al. 2007; Vrana et al. 2014; Ortega-Calvo et al. 2015).à Theà te à ioa ailable
o pou d àisàdefi edà àse e alà ultidis ipli a à esea he sàasàtheàf eel àa aila leàtoà ossàa à o ga is sà ellula à e a eà f o à theà ediu à theà o ga is à i ha itsà atà aà gi e à ti e.à However, bioavailability process was considered by the National Research Council (NRC) committee only in aqueous or dissolved contaminant (Ehlers & Luthy 2003). Semple et al. 2004
had found that this can be somehow limited and does not provide the best assessments for polluta tsài àe i o e t.àThe ài t odu edàaà ide àdefi itio àofà a essi leà o pou ds àthatà
Chapter II: Bibliographic Synthesis
22 ABUHELOU Fayez |PhD Thesis | Université de Lorraine| 2016
does not limit our investigation to time frame where pollutants are physically or temporally constrained (see Figure II 3).
Figure II 3 This conceptual diagram illustrates the bioavailable and bioaccessible fractions of a contaminant in soil as defined by physical location. It also describes the relationship of soil-associated contaminant molecules in relation to bioaccessible fraction (Semple et al. 2004). With the development of passive samplers, the concept of bioavailability was amended by including jointly the accessibility and chemical activity (Eichenberg & Ayer 2006), in which the potential physicochemical processes, such as diffusion and sorption, are quantified. Thus, the fraction of chemicals that is available to uptake and causing effects to biota within a given time span, should be explicitly considered (Figure II 4) (Ortega-Calvo et al. 2015).
Figure II 4 Overview of scientific concepts of the bioavailability of organic chemicals (
Chapter II: Bibliographic Synthesis
24 ABUHELOU Fayez |PhD Thesis | Université de Lorraine| 2016
CHAPTER II:
1.
Introduction:
River acts as a drainage system of the catchment area, which collects and transfers water loaded with a mix of industrial, agricultural and domestic pollutants including: microorganisms (pathogens), organic, inorganic and macroscopic contaminants. Organic pollutants have been found causing significant contamination problems in several rivers all over the world, and raised the top of the list of importance water quality issues (WHO 1996). A major concern with such persistent organic pollutants (POPs) is their high mobility and ubiquitous presence in the environment due to their physico-chemical properties. As well as their bio-accumulation at high level of concentration in the food chain, causing adverse effects on humans and wildlife (UNEP 2001 and 2007). Tracking and monitoring POPs, such as polycyclic aromatic compounds (PACs), in river water systems provides an important and unique perspective to understand the system in order to find effective reducing emission and lowering exposure plans (Lohmann & Muir
2010).
1.2 Polycyclic Aromatic hydrocarbons
PACs are a large group of diverse organic chemicals, distinguished by at least two fused aromatic rings, and was mostly recognized by the parent polycyclic aromatic hydrocarbons (PAHs) (Figure III 5) (Blumer 1976; Menzie et al. 1992 ; Kim et al. 2013).
Chapter II: Bibliographic Synthesis
26 ABUHELOU Fayez |PhD Thesis | Université de Lorraine| 2016
Figure II 5 The structure of the sixteen PAHs included in the priority list of the USA Environmental Protection Agency (EPA) (USEPA 1993). The 8 PAHs included in the European Water Framework Directive (EU 2013) are in the frames. (Detailed physic-chemical properties are provided in Table II 1).
The PAHs are one of the most important POPs. They are constituted by hundreds of individual substances with 2 to 7 fused aromatic rings (Latimer & Zheng 2003). They have been pointed as toxic and potentially teratogenic, mutagenic and carcinogenic pollutants in the environment
(Jones & de Voogt 1999; Ross & Nesnow 1999 ; IARC 2010). Generally, they are divided into two
HMW).The major input of these compounds in the environment is the result of combustion of organic material. The pyrolytic sources of PAHs include incomplete combustion of fossil organic matter or biomass such as domestic coal combustion, coal-fired power stations and vehicle exhausts and coal tar (Maliszewska-Kordybach 1999; Biache et al. 2008 and 2011). The coal tar is an organic material mainly composed of aromatic compounds including PAHs. It is formed as a by-product when heating coal at high temperature (1,100 -1,300 oC) under an oxygen-free atmosphere. Spillage of petroleum or of refinery products introduces PAHs and are classified as petrogenic source (Gogou et al. 2000). Natural sources such as forest fires and volcanic eruptions are also listed (Zhang & Tao 2009). In Figure III 6, the European Environment Agency (EEA) summarized the possible PAHs emission sources according to the sector share attributing the major contribution to households energy and industry processes.
Figure II 6 Sector share of polycyclic aromatic hydrocarbons (EEA 2012).
Agriculture 8% Energy Industries 1% Fugitive Emissions 2% Industry (Energy) 5% Industry (Processes) 17% Other (Energy) 41% Other (Non Energy) 9% Other Transport 4% Road Transport 11% Waste 2%

![Table II 1 PACs considered in this study with their: CAS registry number, molecular formula, Molecular Weight (MW), octanol-water partitioning coefficient (log Kow) and aqueous solubility (S at 25 o C])](https://thumb-eu.123doks.com/thumbv2/123doknet/14495282.718195/52.918.106.819.170.1014/considered-registry-molecular-formula-molecular-partitioning-coefficient-solubility.webp)