Electronic Supplementary Information: ‘Superresolution Microscopy of the Volume Phase Transition of pNIPAM Microgels’
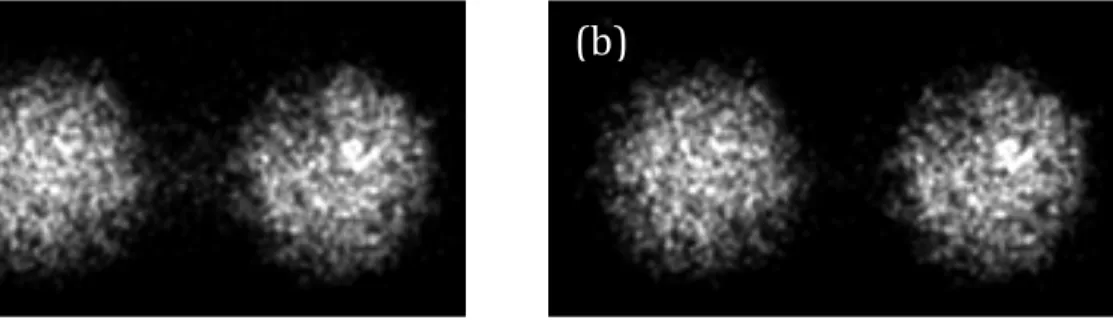
Gaurasundar M. Conleya, Sofi Nöjdb, Marco Braibantia, Peter Schurtenbergerb, and Frank Scheffolda (a) Department of Physics, University of Fribourg, CH-1700 Fribourg, Switzerland, and (b) Physical Chemistry, Department of Chemistry, Lund University, 221 00 Lund, Sweden Threshold for rejecting dSTORM localizations The image analysis software detects fluorescent spots and determines their position as well as the uncertainty associated to it. In a typical experiment it can happen that molecules in close proximity emit at the same time resulting in overlapping point spread functions. Such events are interpreted as a single one by the software which wrongly assigns a position somewhere between the individual ones, resulting in artifacts in the final reconstructed image. Due to their irregular shape such events have a higher uncertainty associated to them. By setting a threshold on uncertainty we can discard them and obtain a better quality image. An example is shown in Fig. S1 (a,b). Removing data points with uncertainty >15nm results in the removal of fictitious ‘bands’ that seem to connect nearby microgels, while the relevant structure is not altered. By choosing such threshold we still keep a large majority of about 70% of the detected localizations. Fig. S1 (a) dSTORM image using all detected localization showing artifacts. (b) Selecting a threshold of 15nm results in improved quality dSTORM images. Measured single particle 2D density profiles and fits Fig. S2 Measured single particle 2D density profiles ρ2D(r) for three different microgel particles. From left to right: R[nm]= 248, 225, 227 and 2σsurf[nm]= 54, 80, 81nm.
(a)
(b)
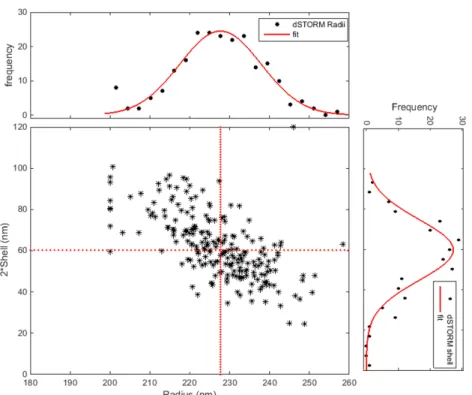
Fig. S3 Characteristic density parameters derived from imaging individual microgel particles. Symbols: Values for the core radius R and the shell 2σsurf obtained from fits to the density profiles of individual microgels as shown in Fig. S2. The distributions are shown on the top and on the right of the scatter graph. The mean core radius R = 231nm and shell thickness 2σsurf = 60nm are shown as dashed lines. The relatively large spread is due to the strong correlation between σsurf and R. The spread for the particle size R + 2σsurf is very narrow with a standard deviation of 3.1% as shown in Fig. 3(c).