Effect of aging on thermal conductivity of fiber-reinforced aerogel
composites: An X-ray tomography study
Subramaniam Iswar
a,b, Michele Griffa
c,d, Rolf Kaufmann
d, Mario Beltran
d, Lukas Huber
a,
Samuel Brunner
a, Marco Lattuada
b, Matthias M. Koebel
a,∗, Wim J. Malfait
a,∗∗aLaboratory for Building Energy Materials and Components, Swiss Federal Laboratories for Materials Science and Technology, Empa, Überlandstrasse 129, 8600, Dübendorf, Switzerland
bUniversity of Fribourg, Department of Chemistry, Chemin du Musée 9, 1700, Fribourg, Switzerland
cConcrete/Construction Chemistry Laboratory, Swiss Federal Laboratories for Materials Science and Technology, Empa, Überlandstrasse 129, 8600, Dübendorf, Switzerland
dCenter for X-ray Analytics, Swiss Federal Laboratories for Materials Science and Technology, Empa, Überlandstrasse 129, 8600, Dübendorf, Switzerland
A R T I C L E I N F O Keywords: Aerogel Aging Thermal conductivity X-ray micro-tomography Macro-porosity A B S T R A C T
Silica aerogels display an ultra-low thermal conductivity (λ) and are used as thermal superinsulators. Here, we study the influence of aging and drying processes on the microstructure and thermal conductivity of fiber-reinforced silica aerogel composites. Glass wool-silica gel composites were aged for variable times, hydro-phobized, and dried either at ambient pressure or from supercritical CO2(scCO2). The X-ray micro-tomographic data display three distinct phases: silica aerogel, glass fibers, and macroscopic pores and cracks. The silica aerogel appears as a continuous medium in the tomograms because the spatial resolution (6–11 μm) is in-sufficient to resolve the aerogel mesopores (∼0.02–0.10 μm). For the composites prepared by ambient pressure drying, insufficient aging led to prominent drying shrinkage and cracking, and a high macro-porosity, as quantified by 3D image analysis. Insufficient aging also led to an increase in λ from 15.7 to 21.5 mW m−1K−1. On the contrary, composites that were nearly free of cracks and displayed a constant λ of 16.3 ± 0.8 mW m−1K−1could be prepared by scCO
2, independent of aging time. The thermal conductivity was reproduced from the macro-porosity to within 0.7 mW m−1K−1using simple thermal transport models con-sisting of thermal elements connected in series or parallel. Our results illustrate the usefulness of X-ray micro-tomography to quantify the 3D microstructure and its effects on the bulk composite properties and the data highlight the importance of aging for the production of low λ aerogel-fiber composites by ambient pressure drying.
1. Introduction
Silica aerogels are mesoporous materials with low to ultra-low densities (0.02–0.2 g/cm3), ultra-low thermal conductivity (12–18 mW m−1K−1 STP) and high specific surface areas (500–1000 m2/g) [1–4]. Because of these outstanding properties, they find their use in a variety of applications such as thermal insulation [5], drug-delivery [6], oil adsorbents [7], optical waveguides [8] and cat-alyst support [9]. To overcome their inherent brittleness and fragility, different reinforcement strategies have been employed, either by making aerogel composites with macroscopic fibers [10,11] or by hy-bridization with (bio)polymers at the microscopic or even molecular scale [12–17].
Evaporative, ambient pressure drying (APD) is a simple alternative to conventional supercritical drying (SCD), although a hydrophobiza-tion treatment of the silica surfaces, most typically a silylahydrophobiza-tion, is es-sential to promote a “spring-back” effect that restores the porosity of the gel after solvent evaporation [18–20]. In addition to hydro-phobization, aging is an essential condition for the synthesis of low density silica aerogels by ambient pressure drying, as reported in our recent study [21–23]. There, we demonstrated that aging within the gelation liquid, i.e., without additional solvent exchanges, effectively strengthens the gel network and enables the production of low density silica aerogels by APD. We also concluded that the drying process magnifies the effect of aging on the gel structure and stability, with an irreversible pore collapse for poorly aged samples due to the strong
∗Corresponding author. ∗∗Corresponding author.
E-mail addresses:[email protected](M.M. Koebel),[email protected](W.J. Malfait).
http://doc.rero.ch
Published in "Microporous and Mesoporous Materials 278(): 289–296, 2019"
which should be cited to refer to this work.
capillary forces that occur during APD but are mostly absent during SCD.
Silica aerogels owe their extremely low thermal conductivity to the unique combination of low density, small pores and a tortuous particle network structure [2]. Thanks to the Knudsen effect in the aerogel's mesopores, the thermal conductivity of silica aerogels is only half that of standing air. Thus, the presence of macropores or air-filled cracks in a composite or component leads to an increase in thermal conductivity, in contrast to conventional insulation materials. X-ray micro tomo-graphy (μCT) can visualize and quantify the 3D morphology of com-posite materials. A few studies have aimed at imaging the particle network and the (meso)pore structure of the aerogel themselves with synchrotron radiation-based X-ray coherent diffraction imaging ap-proaches achieving tens of nm spatial resolution [24], which is much higher than what achievable with laboratory-scale μCT but generally still insufficient to resolve the majority of the mesopores (20–50 nm) and specifically the primary silica nanoparticles (∼5 nm diameter) in the silica aerogel, even under optimal imaging conditions. Therefore, imaging probes reaching even higher resolution such as electron to-mography are typically required to fully resolve the aerogel's inner structure [25]. However, laboratory scale μCT, achieving spatial re-solution ranges from a few tens of μm down to a few μm, has been successfully exploited in several studies to investigate other features in the micrometer range, i.e. larger than those of the silica aerogel's in-ternal structure. In these studies, the aerogel appears as a continuous, low density medium and the features of interest have covered a wide spectrum, e.g., stardust impact tracks in aerogels [26,27], properties of granular aerogel materials under compression [28], cellulose foams [29], cellulose-silica hybrid aerogels [30], wood-templated silica aerogel hybrid materials [31], aerogel-filled metals [32] and density gradients in divinyl benzene aerogels [33,34].
In this study, we systematically investigate the influence of different aging times (from 2 to 24 h) and drying processes (SCD, APD) on the structure and thermal conductivity of fiber-reinforced silica aerogel. The trends in thermal conductivity are correlated to the structure and in particular the crack volume determined by μCT analysis.
2. Experimental section
2.1. Synthesis of fiber-reinforced silica aerogel composites
Fiber-reinforced silica aerogel composites were prepared according to the process scheme depicted inFig. 1. The hydrophobized glass wool (SAGER, SA25, Switzerland) used for the synthesis had a bulk density of approximately 25 kg/m3 and a thermal conductivity of 35 mW m−1K−1, whereas the polyester fiber (PES) blanket (Ridan Sp. z o.o, Poland) had a thermal conductivity of 40 mW m−1K−1. 9 ml of polyethoxydisiloxane (PEDS), a prepolymerized form of tetraethyl or-thosilicate (TEOS) containing 20 wt% SiO2equivalents (PEDS-P750E20 [35]) was diluted with 21 ml of ethanol (A15-A-MEK, absolute ethanol denatured with 2 vol% methyl ethyl ketone) and 1 ml of distilled water
under constant stirring for 5–10 min at room temperature. Gelation was initiated by the addition of 0.36 ml of 5.5 M ammonium hydroxide solution (NH4OH in water) with a gelation time of approximately 10 min. The gelation-initiated sol was cast into glass wool or PES fiber blankets (volume ∼50 × 50 × 10 mm3) placed in polystyrene boxes. The samples were covered after gelation with an additional 0.4 ml of ethanol, and the boxes closed with a tight-fitting lid (but not sealed) to prevent exposure to the air due to solvent evaporation during aging, and aged at 65 °C and atmospheric pressure for different times (2, 4, 6, 8, 16 and 24 h). The aged gel composites were then hydrophobized by soaking in a mixture of 60 ml of hexamethyldisiloxane (HMDSO), 0.24 ml of hydrochloric acid (37% in water) and 2.2 ml of ethanol at 65 °C for 24 h. The hydrophobized gel composites were dried at ambient pressure for 2 h at 150 °C. An additional series of hydrophobized gel composites (glass wool only) was dried in an autoclave (4334/A21−1, Separex, France) from supercritical carbon dioxide (SCD). The auto-clave of the supercritical dryer was filled with ethanol prior to loading the samples. Once the chamber was tightly closed, the remainder of the chamber was filled with liquid CO2and the ethanol was slowly released from the bottom of the dryer. After multiple solvent extraction steps to exchange the ethanol with liquid CO2during ∼24 h, the autoclave was isolated from the CO2 supply and heated for 3 h to 48 °C, which in-creased the pressure to 150 bar and brought the liquid CO2to the su-percritical state. Subsequently, the dryer was gradually depressurized by releasing gaseous CO2over approximately one hour and allowed to cool before the samples were removed from the chamber.
2.2. Thermal conductivity (λ)
Thermal conductivity at ambient conditions (EN 12667 @ 10 °C) was determined with a custom built guarded hot plate device designed for small samples of low λ materials [36]. The menisci from the sol-gel process were polished off prior to analysis, and a small weight was placed on the top plate of the device (330 g, including the top plate, corresponding to a pressure of 1.3 kPa) to ensure a good thermal con-tact between the sample and the instrument.
2.3. Scanning electron microscopy
Scanning electron microscopy (SEM) images were obtained with a FEI Nova NanoSEM 230 instrument (FEI, Hillsboro, Oregon, USA) at an accelerating voltage of 10 kV and a working distance of 5 mm. The aerogel-fiber composites were fixed on the sample holder using a carbon pad and subsequently coated with 15–20 nm of platinum (monitored by QCM) for SEM analysis. Because of the high surface area and high surface roughness of silica aerogel, the effective thickness of the Pt coating is much lower, but hard to evaluate.
2.4. X-ray micro-tomography
Glass wool-silica aerogel composite cuboids (10 × 10 × 15 mm3)
Fig. 1. Process scheme for the synthesis of fiber-reinforced silica aerogel composites.
were cut out of the bulk materials with a razor blade and attached to cylindrical sample holders with silicon glue. The PES-silica aerogel composites sustained severe damage during cutting and were therefore not analysed by μCT. X-ray micro-tomography was performed at the Empa Center for X-ray Analytics with a laboratory scale custom-made system with an effective spatial resolution of 5–10 μm (Fig. S3). 2D radiographs were acquired with a Perkin Elmer XRD 1621 aN14 CN2 ES flat panel detector that consists of a 2048 × 2048 array of amorphous Si pixels (p = 200 μm), covered with a 700 μm–thick layer of a CsI(Tl) scintillator. The X-ray source is a VISCOM XT9160 TXD (VISCOM AG) micro-focus X-ray tube with a 6 μm–thick W target and a minimum focal spot size of a few μm for the collimated electron beam. All mea-surements were performed with an accelerating voltage Vsource= 50 kV and a current I = 190 μA. A tomographic dataset consists of 1440 radiographs over 360° rotation, acquired with an exposure time of 1500 ms each. A 3D image (tomogram) was obtained by the Feldkamp-Davis-Kreiss cone beam filtered back-projection tomographic re-construction algorithm [37] in the Octopus Reconstruction(™)software (Inside Matters, www.octopusimaging.eu). The raw tomogram was saved as a stack of 2D images (tomographic “slices”, 16 bit TIFF, each voxel with discretized value within the interval [0; 65535]). The voxel size isp˜=Mp, whereM ddSD
Ss is the geometrical magnification factor due to the cone geometry of the beam,dSD is the source-to-detector
distance (1042 mm), anddSsis the source-to-sample distance (adjusted
for the highest magnification compatible with the field of view). Section
3.3describes the 3D image analysis workflow used to compute the bulk porosity and pore size distribution of the sample, implemented with the open source platform ImageJ/Fiji [38], with in house-developed soft-ware (the Empa Bundle of ImageJ Plugins for Image Analysis, EBIPIA [39] and Avizo 3D (FEI Visualization Sciences Group)).
3. Data analysis and results
3.1. Sample appearance and volume shrinkage
The volume shrinkage of APD fiber-reinforced silica aerogel com-posites is strongly affected by the aging conditions, in contrast to the composites prepared by SCD (Fig. 2andFigs. S1a and S1b). The volume shrinkage is approximately 28–30% more for a 2 h aged APD glass wool aerogel composite when compared to a long aged (24 h) sample while
the volume shrinkage is less than 5% irrespective of aging time for SCD glass wool composites. Also, the dense nature and texture of the silica aerogels and the relatively more discontinuous cracks in the APD aerogel composites are prominent for short aging times (2–6 h) (Fig. 2
andFig. S1a) as observed in our previous study [21].
3.2. SEM analysis
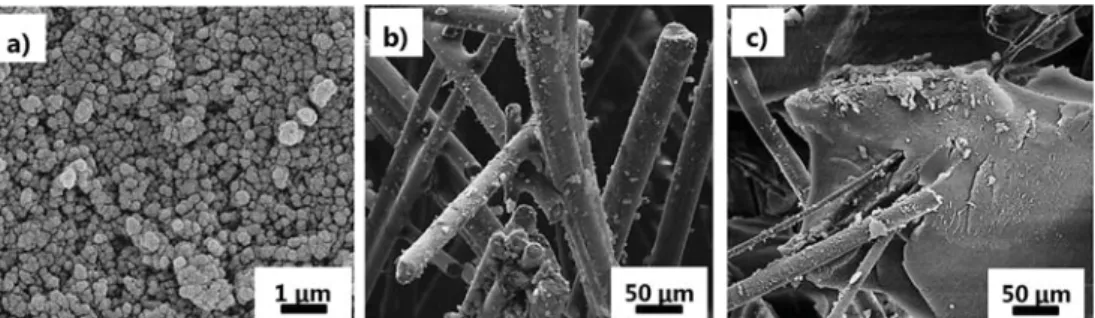
The high magnification SEM images from our recent study of aging of silica aerogel granulates [21] display a typical morphology with mesopores enclosed by secondary particle aggregates of 20–50 nm in diameter (Fig. 3a andFig. S2a). The SEM images at lower magnification show that the glass fibers are incorporated well into the silica network and confirm the reinforcement of silica aerogel (Fig. 3b and c andFigs.
S2b–d). However, no microstructural variations could be observed
ei-ther for a short aged (2 h) or long aged sample (24 h) for both APD and SCD aerogel composites with SEM, presumably because the information provided by SEM images is restricted only to a (fracture) surface de-scription. Hence, μCT was used to analyse the structure of the glass wool-silica aerogel composites over the entire sample volume. 3.3. X-ray micro-tomography
μCT provides the 3D distribution of the X-ray local linear attenua-tion coefficientμ of the material phases composing the samples under study. The differences in attenuation for different materials are related to the chemical compositions and density: the tomogram voxel values are semi-quantitativeμ values that are linearly proportional to the local volumetric mass density of the material and toZn, whereZ is the
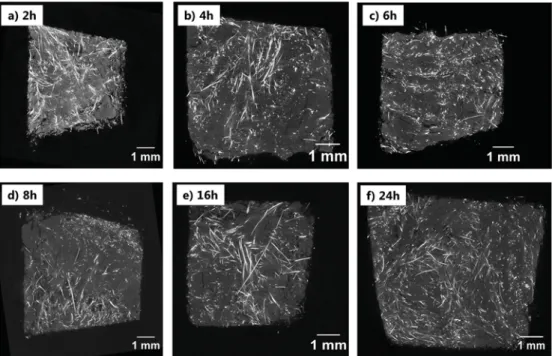
atomic number of the locally most abundant chemical element andn is typically between 3 and 4 [40].Figs. 4 and 5display representative μCT slices from the tomograms of APD and SCD glass wool-silica aerogel composites prepared with different aging times. There are 3 material phases clearly distinguishable in the images: the bright white tone is associated with the largest voxel values, corresponding to the largestμ values of the glass wool fibers (density ∼2.5 g/cm3); the silica aerogel appears in a light grey tone, due to its lower μ values (density ∼0.1–0.3 g/cm3); finally, air-filled cracks and other macropores appear as dark grey-to-black due to the near-zero X-ray attenuation of air. Note that the silica aerogel appears as a homogenous medium because the
Fig. 2. Ambient pressure dried (APD) glass wool-silica aerogel composites for different aging times.
characteristic length scales of its internal mesoporous structure (0.005–0.1 μm) are much smaller than the tomogram's average spatial resolution (10 μm). For the APD aerogel composites, we can observe shrinkage crack patterns typical of drying shrinkage and respective cracking processes in porous media, e.g., soils, colloidal suspensions and gels [41] (Fig. 4). The cracks are wider and more pronounced at short aging times (Fig. 4a, b and c), but become more narrow and less abundant for aging times of 8 h and above (Fig. 4d, e and f). The SCD aerogel composites display a nearly crack-free (within the limits of the tomograms' spatial resolution) monolithic aerogel morphology, irre-spective of the aging time (Fig. 5).
The complex 3D fiber orientation, crack patterns and aerogel frag-mentation for a 2 h aged APD glass wool-silica aerogel composite can be observed in the 3D rendering of a tomogram (Fig. 6) and in its computer graphics animations where the rendered tomogram is rotated in space (Section4of the Supplementary Information). In the tomogram, the fibers appear to act as crack nucleating sites, and the size of the aerogel grains correlates with the local density of fibers in the sample, parti-cularly for short aging times (Figs. 4and6). The process of crack for-mation and initiation is not the focus of this study, but X-ray tomo-graphy would be the ideal tool to study sample and fiber deformation and crack initiation during drying, for example with in situ, time-re-solved tomography.
μCT not only allows for a qualitative visual inspection of the structure (Fig. 6) but also enables the quantitative analysis of the
internal structure of the aerogel composites. A statistical characteriza-tion of the crack size, in addicharacteriza-tion to the bulk porosity of each sample, was obtained with the image analysis workflow shown inFig. 7and briefly summarized in this Section. A more detailed description of each step of such workflow is provided in Section3of the Supplementary Information. The first step (Fig. 7a) consisted of selecting a 3D region-of-interest (ROI) of the tomogram excluding the parts of the sample volume close to the boundaries, i.e., the parts where the cracks were more likely perturbed/enhanced by the sample preparation. The second step (Fig. 7b) consisted in applying to that ROI, an edge-preserving smoothing filter to increase the signal-to-noise ratio of the tomogram without smoothing the boundaries between different material phases, such that the volume of each phase would be preserved as much as possible despite the smoothing of the remaining parts of the 3D image. For such purpose, we used the implementation of the Perona-Malik anisotropic diffusion filter [42] in Avizo 3D. In the third step (Fig. 7c), the voxels corresponding to cracks were automatically identified (“segmented”) by using an unsupervised machine learning algorithm (K -means clustering) [43]. The segmentation created a 3D binary image (“mask”) identifying the voxels corresponding to the crack phase with a specific value, mapped to “white” inFig. 7c, while all the other voxels, corresponding to aerogel matrix and fibers, were assigned a distinct value, rendered in black inFig. 7c. The binary mask of the crack volume allowed then to compute not only the bulk porosity (ratio of the number of white voxels to the total number of voxels of the ROI) but
Fig. 3. SEM images of (a) 2 h aged APD silica aerogel [21], (b) glass wool and (c) 2 h aged APD glass wool-silica aerogel composite. Note that the aerogel appearance at high magnification (Fig. 3a) may be affected by the Pt coating prior to SEM analysis.
Fig. 4. 2D cross-sections (“slices”) from 3D images (tomograms), obtained with X-ray micro-tomography, of APD glass wool-silica aerogel composites. The brightest
features are the glass wool fibers.
also to compute the cumulative size distribution of the crack widthS using an algorithm inspired by the physical principles used for mea-suring a pore size cumulative distribution by mercury intrusion por-osimetry (MIP) [44] and based upon the concept of a continuous size distribution [45]. Such a continuous cumulative crack size distribution is represented inFigs. 7d and8as the cumulative, macro-porosity of the sample,c (S), due to cracks with size larger thanS, for differentS values.
The 3D image analysis workflow was carried out for all 12 samples resulting in crack width cumulative distributions for both the APD and SCD aerogel composites with different aging times. For the APD aerogel composites, the cumulative volume fraction of pore space due to any crack sizeS, i.e., the macro-porosity in between the aerogel grains, strongly decreases as the aging time increases (Fig. 8a). A similar trend is seen for the cumulative volume fraction values for largerSvalues,
indicating that also the crack width decreases with increasing aging. Such quantitative results are consistent with a simple visual inspection of the tomograms (Fig. 4for examples of slices only). In contrast to the APD results, there is no significant variation in the cumulative porosity for the SCD aerogel composites as a function of aging time (Fig. 8b), again consistent with a qualitative visual inspection of the 2D cross sections (Fig. 5). The total macro-porosity (c S( =0μm) xair) of the aerogel composites dried at ambient pressure decreases from 58% to 6% with increasing aging time, while the total macro-porosity is less than 10% for all aging times for the SCD aerogel composites (Fig. 9a
andTable 1).
3.4. Thermal conductivity
The thermal conductivity (λmeasured) of fiber reinforced-silica aerogel composites prepared by APD is strongly affected by the aging conditions in contrast to the aerogel composites prepared by SCD
(Fig. 9b, Table 1and Table S1). The APD aerogel-fiber composites’
thermal conductivity decreases with increasing aging time and the decrease in λ is most pronounced at short aging times with a nearly constant λ for aging times of 8 h and above (Fig. 9b). This aging time dependence was observed for both the glass wool and polyester fiber APD aerogel composites but with slightly lower thermal conductivities for the glass wool composites. Importantly, the λ of a long aged APD fiber reinforced-aerogel composite approaches that of the SCD aerogel composites. Even more importantly, the 3D quantitative characteriza-tion of drying shrinkage cracking in the aerogel composites correlates very well with the thermal conductivity trend. As the macro-porosity decreases with increasing aging time, the thermal conductivity also decreases (Fig. 9a and b andTable 1).
The 3D distribution of materials (fibers, aerogel, air) as derived from the tomograms and the segmentation of the respective phases could serve as input for advanced 3D numerical simulations of heat transport [46–48]. In this study however, we have limited ourselves to a simpler, analytical approach to predict the macroscopic thermal con-ductivity. We calculated thermal conductivity for the composites for two end-member scenarios: a parallel case, where the materials are aligned in layers parallel to the heat flow (maximizing thermal bridges) and a series case, where the materials are aligned in layers
Fig. 5. 2D cross-sections from 3D images, obtained with X-ray micro-tomography, of SCD glass wool-silica aerogel composites. The brightest features are the glass
wool fibers.
Fig. 6. Computer graphics-based rendering of the X-ray tomogram for 2 h aged
APD glass wool-silica aerogel composite.
perpendicular to the heat flow (minimizing thermal bridges) (Fig. 10). The thermal conductivity for these end-member cases can be calculated from the simple analytical expressions given in Fig. 10. The actual distribution of materials (Figs. 4 and5), and thus the thermal con-ductivity, lies in between these two extremes. The calculation requires several inputs. The total macro-porosity, i.e., the volume fraction of air (xair) in the aerogel composites is obtained from the 3D image analysis as described before (Fig. 9a andTable 1). The volume fraction of silica aerogel is approximated by (1 - xair), ignoring the minor volume frac-tion of glass fibers (∼1.5% for our glass wool density). The thermal conductivity of air inside the macropores was approximated to 26 mW m−1K−1 STP, assuming that air is stationary inside the
macropores (no convection). The thermal conductivity of the aerogel (λaerogel) as a function of aging time was approximated by those mea-sured (Table S2) on silica aerogel granulate (APD) and monoliths (SCD) prepared under the same conditions. A detailed description of the aging dependence of the thermal conductivity of the silica aerogel granulate will be reported in a separate publication. The contribution of the solid thermal conduction of glass wool is very low (< 0.2 mW m−1K−1), as determined from thermal conductivity measurements in vacuum for glass wool densities of > 0.150 g/cm3used for VIP cores, and by ac-counting for radiative contributions [49,50]. Since the density of the glass wool used in the current study is even lower (0.025 g/cm3), we have assumed the solid thermal conduction through the glass fibers is
Fig. 7. Schematic representation of the different steps of the 3D image analysis workflow to calculate the bulk porosity due to pores resolved within the tomograms,
i.e., above about 10 μm in pore size, being mainly cracks, and the crack size distribution. Only images and data from the analysis of the 2 h aged APD glass wool-silica aerogel composite are shown. (a): representative tomographic slice from the 3D ROI extracted from the raw tomogram. (b): corresponding slice from the same ROI of (a) but extracted from the edge-preserved smoothed tomogram. (c): corresponding slice from the 3D binary image of the pore (crack) space. White voxels indicates pore space and black voxels indicates aerogel matrix and fibers. Pore size (S) cumulative distribution in the form of cumulative porosity (c , as a function of S) due to
pores (cracks) with size larger thanS. The value of c S( ) for S = 0 μm corresponds to the macro-porosity of the ROI.
Fig. 8. Continuous cumulative volume fraction of pore, i.e., crack space (c ) due to cracks with size larger than S, for (a) APD and (b) SCD glass wool-silica aerogel
composites for different aging times.
Fig. 9. Influence of aging time on (a) the
total macro-porosity of glass wool-silica aerogel composites and (b) the thermal con-ductivity of PES and glass wool-silica aerogel composites. Note that even the small varia-tions in thermal conductivity for the SCD composites (Δλ ∼ 0.8 mW m−1K−1) track the small variations in macro-porosity (Δxair∼ 5%), confirming the precision of both the image analysis and thermal con-ductivity measurements.
negligible. The thermal conductivities calculated for both the parallel and series cases are listed inTable 1. As expected, the values calculated for the parallel case are systematically higher than for the series case but the differences are limited (≤1.2 mW m−1K−1STP) and similar to the uncertainty on the calculations. The thermal conductivities calcu-lated from the tomography data reproduce the experimental values to within 0.7 mW m−1K−1STP (one standard deviation), demonstrating the strength of the approach (Fig. 10andTable 1).
4. Discussion
The decrease in λ and macro-porosity for the APD composites and its approach to λ and macro-porosity values typical for SCD composites for the longest aging times, is similar to the decrease in bulk density with increasing aging time for APD silica aerogel granulates as observed in our previous study [21]. The strengthening of gels during aging due to dis-solution-re-precipitation process akin to Ostwald ripening allows the gel network to withstand the capillary stresses during ambient pressure drying, resulting in a more complete spring-back effect, a reduced shrinkage and a lower envelope density of the APD silica aerogel with increasing aging time [21,51]: with increasing aging time, the density of APD silica aerogel granulate decreases from 0.3 to 0.1 g/cm3[21]. At short aging times, the increase in solid thermal conduction due to higher densities is partially offset by the decrease in thermal conduction through the thinner inter-particle necks (no Ostwald ripening), but the thermal conductivity of the aerogel phase is nevertheless the highest for the shortest aging times: 17.6 mW m−1K−1STP for 2 h of aging (∼0.3 g/ cm3), compared to 15.4 mW m−1K−1STP for a sample that experienced near full spring-back (24 h aging, ∼0.1 g/cm3) (Table S2). Thus, shrinkage of the aerogel phase increases the thermal conductivity of the glass wool-aerogel composites in two ways, i) by increasing λaerogel(Table
S2) [2,4]; and ii) more importantly, by increasing the volume fraction of macro-pores and cracks with a relatively large λ (Fig. 9).
Our results highlight the importance of aging to reduce aerogel
shrinkage and macroporosity, and to produce low thermal conductivity fiber-reinforced aerogel composites by ambient pressure drying. In con-trast, there is no difference in the bulk density with different aging times for SCD silica aerogels (density ∼ 0.09 g/cm3) [21] because the supercritical drying process eliminates the capillary stresses during drying, which leads to very little shrinkage and hence, the aerogel thermal conductivity re-mains mostly unaffected regardless of the aging time for the SCD aerogel composites (Fig. 9b). The small thermal conductivity variations as a func-tion of aging time for the SCD aerogel composites ( ± 2 mW m−1K−1STP,
Fig. 9b) appear to track the variations in macroporosity observed for the
same samples (Fig. 9a), but it is not clear from the present dataset if these co-variations in macroporosity and thermal conductivity reflect a true de-pendence on aging time, or are simply due to sample-to-sample variability that would average out if more samples were to be analysed. A complex propensity for crack formation on aging time, as perhaps hinted at by
Fig. 9a, is not unlikely given the complex dependency of silica aerogel's
mechanical properties (stiffness, brittleness) on various processing para-meters [4], but further study would be required to test this hypothesis. 5. Conclusions
X-ray micro-tomography provided the means to qualitatively and quantitatively characterize the structure of glass wool fiber-aerogel composites. The 3D quantitative characterization of drying shrinkage cracking enables the prediction of the composite thermal conductivity. Thus, our results demonstrate the value of X-ray micro-tomography to probe the structure of aerogel-based composites and to explain their bulk properties. Our findings confirm the role of aging to strengthen the gel network, reduce shrinkage and enable the production of low thermal conductivity fiber-reinforced silica aerogel composites by am-bient pressure drying. This overall result is important especially for the industrial scale production and adoption of fiber-reinforced aerogel composites in thermal insulation applications.
Table 1
Influence of aging time on the total macro-porosity and thermal conductivity (λ) of APD and SCD glass wool-silica aerogel composites.
Aging time (hrs.) λmeasured(mW·m−1·K−1) Series – λcalculated(mW·m−1·K−1) Parallel – λcalculated(mW·m−1·K−1) Total macro-porosity (xair) (%)
APD SCD APD SCD APD SCD APD SCD
2 21.5 ± 0.4 17.1 ± 0.4 21.7 ± 0.9 15.9 ± 1.0 22.5 ± 0.8 16.5 ± 1.1 58 10 4 20.1 ± 0.4 15.5 ± 0.4 18.2 ± 1.0 16.0 ± 1.1 19.4 ± 0.9 16.3 ± 1.1 38 4 6 16.6 ± 0.4 16.0 ± 0.4 16.3 ± 1.0 15.8 ± 1.0 16.9 ± 1.0 16.1 ± 1.1 15 2 8 16.1 ± 0.4 17.1 ± 0.4 15.4 ± 1.1 16.2 ± 1.0 15.8 ± 1.1 16.7 ± 1.1 7 8 16 16.1 ± 0.4 16.1 ± 0.4 16.7 ± 1.0 16.5 ± 1.0 16.9 ± 1.1 16.9 ± 1.1 6 6 24 15.7 ± 0.4 16.7 ± 0.4 15.8 ± 1.0 16.9 ± 1.0 16.0 ± 1.1 17.3 ± 1.1 6 4
Fig. 10. Comparison of measured and calculated thermal conductivity values for APD and SCD glass wool-silica aerogel composites (for series and parallel cases).
Acknowledgements
We would like to thank Shanyu Zhao for the assistance in the ex-perimental design, and Sandra Galmarini and Nithin Mallya for dis-cussions on the thermal conductivity calculations. SAGER is acknowl-edged for providing hydrophobized glass wool and Ridan Sp. z o.o for providing PES blankets. Marco Lattuada gratefully acknowledges fi-nancial support from the Adolphe Merkle Foundation and from the Swiss National Science Foundation, with grant numbers PP00P2133597/1 and PP00P2_159258. Part of this work was per-formed by the use of the Empa Platform for Image Analysis (http://
empa.ch/web/s499/software-/-imaging-platform) at Empa's Center for
X-ray Analytics.
Appendix A. Supplementary data
Supplementary data to this article can be found online athttps://
doi.org/10.1016/j.micromeso.2018.12.006.
References
[1] S.S. Kistler, Nature 127 (1931) 741.
[2] N. Hüsing, U. Schubert, Angew. Chem. Int. Ed. 37 (1998) 22–45.
[3] M.A. Aegerter, N. Leventis, M.M. Koebel, Aerogels Handbook, Springer, New York, 2011.
[4] J.C.H. Wong, H. Kaymak, S. Brunner, M.M. Koebel, Microporous Mesoporous Mater. 183 (2014) 23–29.
[5] M. Koebel, A. Rigacci, P. Achard, J. Sol. Gel Sci. Technol. 63 (2012) 315–339. [6] I. Smirnova, S. Suttiruengwong, W. Arlt, J. Non-Cryst. Solids 350 (2004) 54–60. [7] J.G. Reynolds, P.R. Coronado, L.W. Hrubesh, J. Non-Cryst. Solids 292 (2001)
127–137.
[8] Y. Özbakır, A. Jonas, A. Kiraz, C. Erkey, Micromachines 8 (2017) 1–22. [9] G.M. Pajonk, Appl. Catal. 72 (1991) 217–266.
[10]C.Y. Kim, J.K. Lee, B.I. Kim, Colloid. Surfaces A Physicochem. Eng. Asp. 313–314 (2008) 179–182.
[11] J. Wang, J. Kuhn, X. Lu, J. Non-Cryst. Solids 186 (1995) 296–300. [12] N. Leventis, C. Sotiriou-Leventis, G. Zhang, A.-M.M. Rawashdeh, Nano Lett. 2
(2002) 957–960.
[13] F. Ilhan, E.F. Fabrizio, L. McCorkle, D. a. Scheiman, A. Dass, A. Palczer, M.B. Meador, J.C. Johnston, N. Leventis, J. Mater. Chem. 16 (2006) 3046. [14] M.A.B. Meador, S.L. Vivod, L. McCorkle, D. Quade, R.M. Sullivan, L.J. Ghosn,
N. Clark, L. a. Capadona, J. Mater. Chem. 18 (2008) 1843.
[15] S. Zhao, W.J. Malfait, A. Demilecamps, Y. Zhang, S. Brunner, L. Huber, P. Tingaut, A. Rigacci, T. Budtova, M.M. Koebel, Angew. Chem. Int. Ed. 54 (2015) 14282–14286.
[16] S. Zhao, W.J. Malfait, E. Jeong, B. Fischer, Y. Zhang, H. Xu, E. Angelica, W.M. Risen, J.W. Suggs, M.M. Koebel, ACS Sustain. Chem. Eng. 4 (2016) 5674–5683. [17] S. Zhao, Z. Zhang, G. Sèbe, R. Wu, R.V. Rivera Virtudazo, P. Tingaut, M.M. Koebel,
Adv. Funct. Mater. 25 (2015) 2326–2334.
[18] G.M. Pajonk, S.J. Tichner, Proceedings of the First International Symposium on Aerogels, Springer-Verlag, Wurzburg, 1985.
[19] D.M. Smith, R. Deshpande, J.C. Brinker, Mater. Res. Soc. 271 (1992) 567–572. [20] S.S. Prakash, C.J. Brinker, A.J. Hurd, S.M. Rao, Nature 374 (1995) 439–443. [21] S. Iswar, W.J. Malfait, S. Balog, F. Winnefeld, M. Lattuada, M.M. Koebel,
Microporous Mesoporous Mater. 241 (2017) 293–302.
[22] M.-A. Einarsrud, E. Nilsen, A. Rigacci, G.M. Pajonk, S. Buathier, D. Valette, M. Durant, P. Chevalier, P. Nitz, F. Ehrburger-Dolle, J. Non-Cryst. Solids 285 (2001) 1–7.
[23] S. Hæreid, E. Nilsen, V. Ranum, M.-A. Einarsrud, J. Sol-Gel Sci. Tech. 8 (1997) (1997) 153–157.
[24] A. Barty, S. Marchesini, H.N. Chapman, C. Cui, M.R. Howells, D.A. Shapiro, A.M. Minor, J.C.H. Spence, U. Weierstall, J. Ilavsky, A. Noy, S.P. Hau-Riege, A.B. Artyukhin, T. Baumann, T. Willey, J. Stolken, T. Van Buuren, J.H. Kinney, Phys. Rev. Lett. 101 (2008) 1–4.
[25] L. Roiban, G. Foray, Q. Rong, A. Perret, D. Ihiawakrim, K. Masenelli-Varlot, E. Maire, B. Yrieix, RSC Adv. 6 (2016) 10625–10632.
[26] D.S. Ebel, M. Greenberg, M.L. Rivers, M. Newville, Meteorit. Planet. Sci. 44 (2009) 1445–1463.
[27] A. Tsuchiyama, T. Nakamura, T. Okazaki, K. Uesugi, T. Nakano, K. Sakamoto, T. Akaki, Y. Iida, T. Kadono, K. Jogo, Y. Suzuki, Meteorit. Planet. Sci. 44 (2009) 1203–1224.
[28] A. Neugebauer, K. Chen, A. Tang, A. Allgeier, L.R. Glicksman, L.J. Gibson, Energy Build. 79 (2014) 47–57.
[29] K. Ganesan, A. Dennstedt, A. Barowski, L. Ratke, Mater. Des. 92 (2016) 345–355. [30] M. Sedighi Gilani, M.N. Boone, J.L. Fife, S. Zhao, M.M. Koebel, T. Zimmermann,
P. Tingaut, Compos. Sci. Technol. 124 (2016) 71–80.
[31] M. Sedighi Gilani, S. Zhao, S. Gaan, M.M. Koebel, T. Zimmermann, RSC Adv. 6 (2016) 62825–62832.
[32] A. Orth, S. Steinbach, A. Dennstedt, L. Ratke, Mater. Sci. Technol. 33 (2017) 299–306.
[33] N.G. Borisenko, W. Nazarov, C.S.A. Musgrave, Y.A. Merkuliev, A.S. Orekhov, L.A. Borisenko, J. Radioanal. Nucl. Chem. 299 (2014) 961–964.
[34] L. Borisenko, A. Orekhov, C. Musgrave, W. Nazarov, Y. Merkuliev, N. Borisenko, J. Phys. Conf. Ser. 713 (2016) 1–7https://doi.org/10.1088/1742-6596/713/1/ 012009.
[35] G.M. Pajonk, E. Elaloui, P. Achard, B. Chevalier, J.-L. Chevalier, M. Durant, J. Non-Cryst. Solids 186 (1995) 1–8.
[36] T. Stahl, S. Brunner, M. Zimmermann, K. Ghazi Wakili, Energy Build. 44 (2012) 114–117.
[37] L.A. Feldkamp, L.C. Davus, J.W. Kress, Opt. Soc. Am. 1 (1984) 612–619. [38] J. Schindelin, I. Arganda-Carreras, E. Frise, V. Kaynig, M. Longair, T. Pietzsch,
S. Preibisch, C. Rueden, S. Saalfeld, B. Schmid, J.-Y. Tinevez, D.J. White, V. Hartenstein, K. Eliceiri, P. Tomancak, A. Cardona, Nat. Methods 9 (2012) 676–682.
[39] B. Münch, The Empa Bundle ImageJ Plugins Image Anal. (EBIPIA), (2015)http:// imagej.net/Xlib”.
[40] J. Banhart, Advanced Tomographic Methods in Materials Research and Engineering, Oxford University Press, Oxford, UK, 2008.
[41] L. Goehring, A. Nakahara, T. Dutta, S. Kitsunezaki, S. Tarafdar, Desiccation Cracks and Their Patterns: Formation and Modelling in Science and Nature, Wiley-VCH, Weinheim, Germany, 2015.
[42] P. Perona, J. Malik, IEEE Trans. Pattern Anal. Mach. Intell. 12 (1990) 629–639. [43] T. Kanungo, D.M. Mount, N.S. Netanyahu, C.D. Piatko, R. Silverman, A.Y. Wu, IEEE
Trans. Pattern Anal. Mach. Intell. 24 (2002) 881–892. [44] B. Münch, L. Holzer, J. Am. Ceram. Soc. 91 (2008) 4059–4067.
[45] S. Torquato, Random Heterog. Mater. Microstruct. Macrosc. Prop, Springer New York, New York, NY, 2002, pp. 48–50.
[46] M.A. Tahir, H.V. Tafreshi, S.A. Hosseini, B. Pourdeyhimi, Int. J. Heat Mass Tran. 53 (2010) 4629–4637.
[47] J. Martinez-Garcia, L. Braginsky, V. Shklover, J.W. Lawson, Phys. Rev. B 84 (2011) 54208-1–8.
[48] J.J. Zhao, Y.Y. Duan, X.D. Wang, B.X. Wang, J. Non-Cryst. Solids 358 (2012) 1287–1297.
[49] J. Kim, T.H. Song, Int. J. Heat Mass Tran. 64 (2013) 783–791.
[50] Z. Chen, Z. Chen, Z. Yang, J. Hu, Y. Yang, L. Chang, L.J. Lee, T. Xu, Energy 93 (2015) 945–954.
[51] G.W. Scherer, J. Non-Cryst. Solids 100 (1988) 77–92.