HAL Id: hal-02498428
https://hal.archives-ouvertes.fr/hal-02498428
Submitted on 14 Dec 2020HAL is a multi-disciplinary open access archive for the deposit and dissemination of sci-entific research documents, whether they are pub-lished or not. The documents may come from teaching and research institutions in France or abroad, or from public or private research centers.
L’archive ouverte pluridisciplinaire HAL, est destinée au dépôt et à la diffusion de documents scientifiques de niveau recherche, publiés ou non, émanant des établissements d’enseignement et de recherche français ou étrangers, des laboratoires publics ou privés.
Second-Harmonic Scattering Can Probe Hydration and
Specific Ion Effects in Clay Particles
Pierre-Marie Gassin, Benedicte Prelot, Brian Gregoire, Gaelle Martin-Gassin
To cite this version:
Pierre-Marie Gassin, Benedicte Prelot, Brian Gregoire, Gaelle Martin-Gassin. Second-Harmonic Scat-tering Can Probe Hydration and Specific Ion Effects in Clay Particles. Journal of Physical Chem-istry C, American Chemical Society, 2020, 124 (7), pp.4109-4113. �10.1021/acs.jpcc.9b10284�. �hal-02498428�
Second Harmonic Scattering can Probe Hydration
and Specific Ion Effects in Clay Particles
Pierre-Marie Gassin*a, Benedicte Prelota, Brian Gregoireb, Gaelle Martin-Gassina
a) ICGM, ENSCM, CNRS, Univ Montpellier, Montpellier, France
, CNRS, UMR 7285 IC2MP, Equipe HydrAsa, 5 rue Albert Turpain, Bâtiment B8, TSA 51106, 86073 Poitiers Cedex 9, France
AUTHOR INFORMATION
Corresponding Author: *[email protected]
ABSTRACT: We report Montmorillonite (MMT) particles organization in aqueous solution using polarization resolved second harmonic scattering (SHS). This technique can probe specifically the organization of water in this system. The effect of the colloidal stability of the particle and the nature of the interlayer cations on the SHS Intensity is highlighted. The
interlayer hydration has been probed and changes with the order Mg2+ > Ca2+ > Li+, Na+, K+ >
Cs+. Real time SHS evolutions during cesium exchange have been monitored, and different
pathways are discussed in regards with the experimental results.
1. Introduction
Clay minerals and in particular Montmorillonite (MMT) particles are nanostructured materials composed by stacks of negatively charged layers compensated by solvated cations. These materials are currently involved in many environmental and industrial processes because of their
catalytic and retention properties.1-4 Understanding the fundamentals of clay-water interfaces is a
crucial point for the success of those applications. Numerous computational5-6, experimental
works using XRD7, quasi-elastic neutron scattering8 or infrared spectroscopy9 studied the
swelling, water adsorption and cation exchange properties on MMT under controlled humidity conditions. Those studies contributed to our current-day understanding of the MMT hydration, thickness and interactions between cations. Roughly, MMT crystalline hydrates with one, two, or three molecular layers of water separating the stack layers depending on the controlled relative humidity and the nature of interlayer cations. In aqueous solution, the behavior of MMT colloidal system is quite more complicated because complex chemo-mechanical properties involving competitive effects, determine the whole organization of the mineral plates into an exfoliated or stacked arrangement. The precise interplay between interfacial water structure and ion adsorption/exchange remains experimentally poorly characterized using in situ and in real time probes that are non- invasive, label-free and specific to interfacial water.
Nonlinear optics and Second Harmonic Scattering (SHS)10-11 have been previously used to
studied MMT particles in suspension.12 This first study demonstrated the contribution of the
oriented water around the charged plate in the whole SHS intensity and its dependence with the ionic strength. The colloidal transition between the delaminated/stacked plate and the change in the interlayer hydration during cation exchange was not explored in this former work and will be investigated in this article. In particular, the results presented here will be discussed in term of coherent contribution in the SHS Intensity coming from water correlation induced by the MMT
particles. Indeed, in the last three years, numerous works have significantly improved our understanding of the SHS signals concerning the contribution of organized or correlated water in
the whole SHS intensity13-16, particularly in the domain of electrolyte solution17-20. Based on this
general framework, the global SHS intensity I, for N molecules, each located at position ri, can
be written as18, 21
(1)
Where βlabo is the hyperpolarizability tensor expressed in the laboratory frame, q is the scattering
wavevector q=ks-2ki where ki is the fundamental incident wave vector, ks is the harmonic
scattered one, u and v are the polarization directions of the incoming and outgoing beams described by the angles γ, Γ (see figure 1 for the notation), and Ω is the orientation of the molecule, define with three Euler angles, in the laboratory frame (XYZ). The brackets <..> stand for the time average. The first part of equation 1 is referred as the incoherent contribution and the second term is referred as the coherent contribution in the SHS intensity. In the case of correlated scattered molecule, this second term can overcome the first term, as it will be the case in systems presented here. Otherwise, for the case of uncorrelated molecule, this second term is zero.
2. Experimental Methods
2.1. Experimental Optics setup:
The figure 1 depicts the notation together with the experimental setup22. Briefly, this setup was
built on a femtosecond Ti-sapphire oscillator laser source providing pulses with a duration of about 100 fs at a repetition rate of 80 MHz (coherent, model Chameleon ultra II). After passing through a low-pass filter, the fundamental beam, set to a fixed wavelength at 800 nm and an
averaged power of 600 mW, was focused by a microscope objective (Ealing x10, numerical
aperture 0.25.) onto the sample at 2 mm close to the output cell window (Hellma QS 10 mm).
The SH light was collected at 90° by a 10 cm focal length lens and separated from its fundamental counterpart by a high-pass filter. The SH light was detected with a water-cooled CCD camera (Andor, Newton) placed after a spectrometer (Andor, Shamrock 193). The fundamental input beam was linearly p la z a h pu p la za a gl γ wa l c with a rotating half-wave plate. An analyzer, placed in front of the spectrometer, was used to separate w p la za a : cal u pu a fu h am I(γ,V u , h z al output a f I(γ,H u . I fac l a h a g a c h w h h
works13, 15, 18-19, the SHS intensity I(0°,Vout) is also referred to ISSS and I(0°, Hout) to IPSS, figure
1A summarizes these notations. The experimental data of figure 1 were recorded during 10 seconds for each point. The experimental data of figure 2 were recorded during 10 seconds, each point are repeated 5 times, and the errors bar represents +/- 2 standard deviation. In figure 3,
each point is recorded during 10 s in the ISSS configuration and the global time monitoring is
about 4500 s. All experiment were conducted at 20°C and under stirring condition (a magnetic stirrer operates in the cell measurement). For figures 1 and 2, the solution were equilibrated 12h prior the measurement.
2.2. Materials
In all experiments, the MMT particles are prepared in 18 MΩ.cm water (MilliQ) at the same concentration of 0.25 g/L and two types of MMT particles were used. The particles named in the manuscript as Na-MMT are the SWy-3 montmorillonite from the Source Clay Repository of The
Clay Mineral Society with structural formula [(Al2.99 Fe0.43 Mg0.52)(Si7.97 Al0.03)O20(OH)4] M+0.7.
substitution.23 Size fractionation was performed by centrifugation to extract the <1µm size fraction. Prior to the measurement, the particles were sonicated during 10 min and kept under permanent agitation. The particles named Ca-MMT in the manuscript were prepared by
ion-exchange reaction of Na-MMT at room temperature with 1 mol/L aqueous solutions of CaCl2.
The suspensions solution was first allowed to stir for 24h and then, the solid fraction was removed from the saline solution by centrifugation and dispersed again in a fresh saline solution
at the same concentration. These steps were repeated three times. The excess of CaCl2 was
removed by rinsing several times the solid using distilled water until no Cl anions were measured in solution as indicated by a negative silver nitrate test. For the figure 2 data, the following ions
are added in the solution: LiNO3, KNO3, CsNO3, NaNO3, Ca(NO3)2, Mg(NO3)2, from Sigma
Aldrich. For the figure 3, ions addition is carried out using a microvolume injection (18 µL)of a
0.8 M solution of NaNO3 in a 2 ml suspension of 0.25g/L of Na-MMT (figure 3A) or 0.8 M
solution of CsNO3 in a 2 ml suspension of 0.25g/L of Ca-MMT (figure 3B), in such way, the
dilution factor is negligible. The solution is rapidly homogeneous thanks to a magnetic stirrer place in the measuring cell.
Figure 1. Sketch of the SHS experiment, SHS intensities are recorded at a scattering angle of 90° for an input polarization described by the angle γ, and output polarization states described by Γ=V (Vertical) or H (Horizontal). The four circles represent the different systems probed : A)
Na-MMT particles at 0 M ionic strength, B) Na-MMT particles at 10-3 M ionic strength, C) pure
water and D) Ca-MMT particles at 0 M ionic strength. In the four graphs on the right, the full circles represent the experimental I(γ,V u a h mp y qua s h xp m al I(γ,H u . The full and dashed lines are fits using equation (2).
Figure 1 presents the polarization resolved SHS intensity for different systems: pure water, initially exfoliated or delamined Na-MMT particles at various Ionic Strength (IS) and initially stacked Ca-MMT particles. The experimental data in figure 1 have been normalized by the SHS
intensity of pure water, it means that all points have been divided by the ISSS water intensity. The
derivation of equation 1 gives the following expression for the polarization resolved SHS intensity: (2) 90°
g
Einc(ω) ki(ω) ks(2ω) X Y Γ=V Γ=H Z Na+ NO3-A) B) C) D) IPSSwater ISSSwater D) Ca-MMT IS=0M IPSS ISSSwhere Γ=V H. The subscript ‘inc’ and ‘coh’ means -respectively- incoherent and coherent contribution and the different values obtained by the fits presented on figure 1 are given in SI.
When MMT particles are introduced in water, the SHS intensity is globally enhanced by a factor around two, which is explained by coherent contribution of water coming from its organization around and inside the mineral sheet. The coherent term of equation 1 is thus not zero and contributes in the same order of magnitude as the incoherent term coming from “bulk” water. No contribution in the SHS intensity of the mineral materials is considered here, as it will be justified below with the cesium results. When the ionic strength is modified, the behavior of the polarization plot changes with a small decrease in the I(γ,H u y wh a h I(γ,Vout) remains more or less stable. For the case of stacked Ca-MMT particles, h I(γ,Vout) intensity is higher compared to exfoliated Na-MMT system. To study the transition between exfoliated/stacked particles and the possible specific ion effects, figure 2 shows the SHS intensity evolution for initially exfoliated Na-MMT particles by varying ionic strength with different cations.
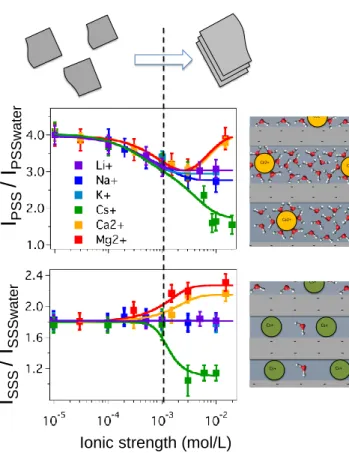
Figure 2. Evolution of the normalized SHS intensity in the PSS and SSS polarization states as a function of the ionic strength for different mono and divalent cations. On the top, illustration of the different organization probed in the experiment. On the right, a microscopic view showing the different hydration states in the interlayer domains.
To interpret those curves, two domains of ionic strength (IS) can be considered, low IS (IS<10
-3
M) and high IS (IS>10-3M). In the first domain, no specific ion effects are observed since all
curves seem to follow globally the same evolution: the intensity ISSS is nearly constant and
intensity IPSS decreases. These evolutions are explained by the interference between water
molecules oriented by the electric field induced by the surface charge onto the platelet. This
contribution is referred as Diffuse Double Layer (DDL) contribution15. This evolution in the 10-5
- - - -- - - -- - - -- - - -Cs+ - - - -- - - -- - - -- - - -Cs+ Cs+ Cs+ Cs+ Ca2+ - - - -- - - -- - - -- - - -- - - -- - - -Ca2+ Ca2+ Ca2+ Ca2+ Ca2+
I
S S S/
I
SS S w a te rI
P S S/
I
PS S w a te r- 10-3M IS range is in agreement with both theoretical model15 describing the interference in the
DDL and with previous experimental work presented by Eisenthal12. At higher IS (10-3-10-2 M),
the DDL contribution tends toward zero and the colloidal stability of the MMT particles changes
with a transition to a stacked organization24-25. This transition is observed both on the two
polarization states IPSS and ISSS. Depending on the cation added in the system, the experimental
data exhibit different behaviors coming from the supposed cation exchange and leading to different water organization in the system.
When Li+ or K+ ions are added, no significant deviations are observed experimentally in the
SHS evolution compared to the case of sodium ion. When Ca2+ or Mg2+ ions are introduced, the
IPSS and ISSS increase significantly. The cation exchange induced a stacking of the layer with
more correlated water in the interlayer domain. The data obtained at 10-2 ionic strength may be
compared with the case of Ca-MMT presented in fig 1D. The global polarization plots are
consistent even if prepared Ca-MMT intensity is a little bit higher, 2.5 compared to 2.2 with the
data coming from the in situ Ca-exchange. In the case of prepared Ca-MMT, the stacking is likely better than the organization obtained by in situ cation exchange. When Cesium ion are
added, the SHS intensity decreases and the ratio I/Iwater falls very close to 1 for ISSS and close to
1.4 for IPSS. This probably means that the coherent contribution in equation 1 becomes very small
compared to the initial condition. It is interesting to note that the ratio IPSS is slightly higher but
nevertheless close to the value measured by Roke and coworker in electrolyte solution at high
ionic strength19. These two ratios may be interpreted as the electrolyte contribution and the
contribution of organized water around or inside Cs-MMT particles seems negligible. These results likely show that few correlated water molecules are involved in the interlayer domain and around the particles. This is in agreement with a zero water model in the interlayer and with the
Moreover, the cesium results are also consistent with a negligible contribution of the mineral material compared to water contribution. Indeed if the material itself exhibits an intrinsic significant nonlinear response, this contribution would be measured in that case.
To summarize this part, increasing ionic strength in the system induces a decrease in the DDL SHS contribution, which is a non-specific ion effect, and induces also a transition from exfoliated to stacked particles. When particles are stacked, the water organization in the
interlayer domains exhibits specific ion effect, with an hydration effect varying in the order Cs+<
K+, Na+ ≈ Li+< Ca2+ < Mg2+. To get in situ information about the transition state during the
cation exchange and the global organization of the system, the SHS real time intensity is recorded during the ion exchange.
Figure 3. Real time evolution of ISSS for two cases: Cs injection on exfoliated Na-MMT at 0 ionic
strength (A), and Cs injection on stacked Ca-MMT at 0 ionic strength (B). In all curve, the initial time is the injection time. Top, a microscopic view showing the different steps during the Cs exchanges process on the exfoliated Na-MMT. Bottom, a microscopic view showing the
Na+ Cs+ Na+ Na+ Cs+ Cs+ Cs+ Na+ Cs+ Cs+ Ca2+ - - - -- - - -- - - -- - - -- - - -- - - -Ca2+ Ca2+ Ca2+ Ca2+ Ca2+ Cs+ Ca2+ - -- -- -- -- -- - - - --- - - - -- - - -- - - -Cs+ - - - -- - -- - - - -Cs+ Cs+ Cs+ Cs+
Figure 3 shows the real-time evolutions when Cs is injected in the system at zero ionic strength for the two different kinds of MMT particles: exfoliated Na-MMT or stacked Ca-MMT. In both
cases, the final ionic strength is 7.10-3M, and SHS signal evolutions with time are well
reproduced. For the case A, the time dependent plot exhibits a first increase during around 1000 seconds. This duration could be considered as the characteristic time of exfoliated/stacked transition. It contains both the ions diffusion/adsorption signal and the stacking platelet characteristic time. This characteristic time is consistent with the SHS evolution obtained for the case of calcium injection onto exfoliated Na-MMT (see additional in the SI). This first increase is followed by an abrupt decrease, which is interpreted as a dehydration step where water is expelled from the interlayer domains. This time duration is likely in the same order of magnitude observed for the previous diffusion/exchange/stacking characteristic times. The equilibrium is reached in around 3000 seconds. In the case B, the evolution shows a more fluctuating decrease and reached an equilibrium state of the same order of magnitude than in case A. These
fluctuations27 are the highest during the time interval 1000-3000 seconds and are comprised in
the range between 2.5 and 1.5 value. We interpreted these fluctuations as a signature of the cation exchange: the cesium cations close progressively the sheet when calcium cations are expelled. Those results are remarkable in the context of recent works about cesium adsorption in
clays1 concerning the discussion between different pathway referred a “ c xcha g ”
“ c llap –driven exchange ». In the case of exfoliated Na-MMT (figure 3A), the Cs-exchange seems to follow the sequence « collapse induced dehydration ». In the case of initially stacked Ca-MMT the nature of the fluctuation in the experimental data seems to sign the coexistence between calcium hydrated / cesium dehydrated stacked domain in the system. The sequence “ c llap xcha g ” a llu a bottom figure 3, may be in agreement with this fluctuating evolution. Nevertheless, these data cannot clearly determine if one pathway between
“ c xcha g ” “ c llap –driven exchange » is really preferred. These real time SHS data show that for the two different initial states studied here, the characteristic time of ion exchange is nearly the same. In other words, h “ p g” f h ack arrangement (see bottom figure 3) seems not to be a limiting step in the kinetics.
4. Conclusions
In conclusion, this work demonstrates that SHS is able to probe MMT particles organization and interlayer hydration. The nature of the compensating cation strongly changes this interlayer hydration. Real time SHS has been used to monitor the cation exchange for two different initial states. For initially exfoliated particles, a specific evolution with two steps involving a collapse before dehydration has been highlighted. For initially stacked particles, fluctuations in the SHS intensity are observed during the cation exchange. Future works involving other type of clays particles, for example clays nanotube, are currently planned in order to study the effect of other
geometrical water arrangements in such material. Overall, we hope that these studies will
stimulate the use of SHS to probe hydration and molecular organization around and inside porous materials.
ASSOCIATED CONTENT
Supporting Information. Additional information about the fit parameters presented in figure 1 and complementary real time SHS evolution. The following files are available free of charge.
AUTHOR INFORMATION Notes
Any additional relevant notes should be placed here. The authors declare no competing financial interests.
ACKNOWLEDGMENT
The financial support of this work by the ANR project CAMOMILS (ANR-15-CE21-0002) is greatly acknowledged.
REFERENCES
1. Okumura, M.; Kerisit, S.; Bourg, I. C.; Lammers, L. N.; Ikeda, T.; Sassi, M.; Rosso, K.
M.; Machida, M., Radiocesium interaction with clay minerals: Theory and simulation advances Post–Fukushima. Journal of Environmental Radioactivity 2018, 189, 135-145.
2. Wang, W.; Wang, A., Nanoscale Clay Minerals for Functional Ecomaterials: Fabrication,
Applications, and Future Trends. In Handbook of Ecomaterials, Martínez, L. M. T.; Kharissova, O. V.; Kharisov, B. I., Eds. Springer International Publishing: Cham, 2019; pp 2409-2490.
3. Benny, K. G. T., Clay Mineral Catalysis of Organic Reactions. CRC Press: Boca Raton,
2019; p 440.
4. Clays in Sedimentary Environments. In Clays, Springer Berlin Heidelberg: Berlin,
Heidelberg, 2005; pp 295-327.
5. Ho, T. A.; Criscenti, L. J.; Greathouse, J. A., Revealing Transition States during the
Hydration of Clay Minerals. The Journal of Physical Chemistry Letters 2019, 10 (13), 3704-3709.
6. Honorio, T.; Brochard, L.; Vandamme, M., Hydration Phase Diagram of Clay Particles
from Molecular Simulations. Langmuir 2017, 33 (44), 12766-12776.
7. Ferrage, E.; Lanson, B.; Sakharov, B. A.; Drits, V. A., Investigation of smectite hydration
properties by modeling experimental X-ray diffraction patterns: Part I. Montmorillonite hydration properties. American Mineralogist 2005, 90 (8-9), 1358-1374.
8. Bordallo, H. N.; Aldridge, L. P.; Churchman, G. J.; Gates, W. P.; Telling, M. T. F.;
Kiefer, K.; Fouquet, P.; Seydel, T.; Kimber, S. A. J., Quasi-Elastic Neutron Scattering Studies on Clay Interlayer-Space Highlighting the Effect of the Cation in Confined Water Dynamics. The
Journal of Physical Chemistry C 2008, 112 (36), 13982-13991.
9. Y ş l aş, M.; H lm , M.; B ly, J.-F., Cohesive Vibrational and Structural Depiction
of Intercalated Water in Montmorillonite. ACS Earth and Space Chemistry 2018, 2 (1), 38-47.
10. Roke, S.; Gonella, G., Nonlinear Light Scattering and Spectroscopy of Particles and
Droplets in Liquids. Annual Review of Physical Chemistry 2012, 63 (1), 353-378.
11. Eisenthal, K. B., Second Harmonic Spectroscopy of Aqueous Nano- and Microparticle
Interfaces. Chemical Reviews 2006, 106 (4), 1462-1477.
12. Yan, E. C. Y.; Eisenthal, K. B., Probing the Interface of Microscopic Clay Particles in
Aqueous Solution by Second Harmonic Generation. The Journal of Physical Chemistry B 1999,
103 (29), 6056-6060.
13. Tocci, G.; Liang, C.; Wilkins, D. M.; Roke, S.; Ceriotti, M., Second-Harmonic Scattering
as a Probe of Structural Correlations in Liquids. The Journal of Physical Chemistry Letters 2016,
14. T cc , G.; L a g, C.; W lk , D. M.; R k , S.; C , M., C c “S c -Ha m c Sca g a a f S uc u al C la L qu ”. The Journal of Physical
Chemistry Letters 2019, 10 (3), 524-525.
15. Gonella, G.; Lütgebaucks, C.; de Beer, A. G. F.; Roke, S., Second Harmonic and
Sum-Frequency Generation from Aqueous Interfaces Is Modulated by Interference. The Journal of
Physical Chemistry C 2016, 120 (17), 9165-9173.
16. Shelton, D. P., Long-range orientation correlation in water. The Journal of Chemical
Physics 2014, 141 (22), 224506.
17. Duboisset, J.; Brevet, P.-F., Salt-induced Long-to-Short Range Orientational Transition
in Water. Physical Review Letters 2018, 120 (26), 263001.
18. Borgis, D.; Belloni, L.; Levesque, M., What Does Second-Harmonic Scattering Measure
in Diluted Electrolytes? The Journal of Physical Chemistry Letters 2018, 9 (13), 3698-3702.
19. Chen, Y.; Okur, H. I.; Gomopoulos, N.; Macias-Romero, C.; Cremer, P. S.; Petersen, P.
B.; Tocci, G.; Wilkins, D. M.; Liang, C.; Ceriotti, M.; Roke, S., Electrolytes induce long-range orientational order and free energy changes in the H-bond network of bulk water. Science
Advances 2016, 2 (4), e1501891.
20. Shelton, D. P., Water-water correlations in electrolyte solutions probed by
hyper-Rayleigh scattering. The Journal of Chemical Physics 2017, 147 (21), 214505.
21. Bersohn, R.; Pao, Y. H.; Frisch, H. L., Double‐Quantum Light Scattering by Molecules.
The Journal of Chemical Physics 1966, 45 (9), 3184-3198.
22. Gassin, P.-M.; Prelot, B.; Grégoire, B.; Martin-Gassin, G., Second-Harmonic Scattering
in Layered Double Hydroxide Colloids: A Microscopic View of Adsorption and Intercalation.
Langmuir 2018, 34 (40), 12206-12213.
23. Stucki, J. W.; Golden, D. C.; Roth, C. B., Effects of reduction and reoxidation of
structural iron on the surface charge and dissolution of dioctahedral smectites. Clays and Clay
Minerals 1984, 32 (5), 350-356.
24. Abend, S.; Lagaly, G., Sol–gel transitions of sodium montmorillonite dispersions.
Applied Clay Science 2000, 16 (3), 201-227.
25. Lagaly, G.; Ziesmer, S., Colloid chemistry of clay minerals: the coagulation of
montmorillonite dispersions. Advances in Colloid and Interface Science 2003, 100-102, 105-128.
26. Yamamoto, T.; Takigawa, T.; Fujimura, T.; Shimada, T.; Ishida, T.; Inoue, H.; Takagi,
S., Wh ch yp f clay m al f x c um ff c ly? h “ca y-charge matching ff c ”. Physical Chemistry Chemical Physics 2019, 21 (18), 9352-9356.
27. Martin-Gassin, G.; Gassin, P. M.; Couston, L.; Diat, O.; Benichou, E.; Brevet, P. F.,
Second harmonic generation monitoring of nitric acid extraction by a monoamide at the water-dodecane interface. Physical Chemistry Chemical Physics 2011, 13 (43), 19580-19586.
Ca2+ - - - -- - - -- - - -- - - -- - - -- - - -Ca2+ Ca2+ Ca2+ Ca2+ Ca2+ - - - -- - - -- - - -- - - -- - - -- - - -- - - -- - - -Cs+ Cs+ Cs+ Cs+ Cs+