Cerebral pressure autoregulation and carbon dioxide reactivity
during propofol-induced EEG suppression
B. F . MATTA, A. M. L A M , S. STREBEL AND T . S. MAYBERG
Summary
We studied cerebral pressure autoregulation and carbon dioxide reactivity during propofol-induced electrical silence of the electroencephalogram (EEG) in 10 patients. Anaesthesia was induced with propofol 2.5 mg kg"1, fentanyl 3 ug kg"1 and vecuronium 0.1 mg kg"1, and a propofol infusion of 250-300 ug kg"1 min"1 was used to induce EEG silence. Cerebral pressure autoregulation was tested by increasing mean arterial pressure (MAP) by 24 (SEM 5) mm Hg from baseline with an infusion of phenylephrine and simultaneously recording middle cerebral artery blood flow velocity (i/mca) using transcranial Doppler. Carbon dioxide reactivity was tested by varying PaCo2 between 4.0 and 7.0 kPa
and recording ymca simultaneously. Although ab-solute carbon dioxide reactivity was reduced, relative carbon dioxide reactivity was within normal limits for all patients studied (mean 8.5 (SEM 0.8) cm s"1 kPa"1 and 22 (2)% kPa~1, respect-ively). No significant change in i/mca (34 (2) and 35 (2) cms"1) was observed with the increase in MAP (77 (4) to 101 (4) mm Hg) during auto-regulation testing. We conclude that cerebral car-bon dioxide reactivity and pressure autoregulation remain intact during propofol-induced isoelectric
EEG. {Br. J. Anaesth. 1995; 74: 159-163) Key words
Anaesthetics i.v., propofol. Brain, blood flow.
Cerebral pressure autoregulation and vasoreactivity to carbon dioxide, two homeostatic mechanisms important for the control of cerebral blood flow (CBF), are impaired by pathology and some drugs used commonly during anaesthesia [1-5]. With the exception of ketamine, most commonly used i.v. anaesthetic agents depress also cerebral metabolism in a dose-dependent manner. As typified by the barbiturates, this depression is associated with a reduction in cerebral metabolic requirements for oxygen (CMRo2) and CBF, which stabilize when electroencephalographic (EEG) activity becomes isoelectric [6, 7]. Barbiturate-induced cortical sup-pression has been advocated as a method of cerebral protection during temporary occlusion of any vessel that provides nutrients to the central nervous system [8]. Although such use is well documented, it is
associated with prolonged awakening which is un-desirable in neurosurgical patients. Propofol has similar cerebrovascular effects as thiopentone [9] and because of its pharmacokinetic profile, it may be suitable for this purpose. If propofol is to be used for cerebral protection, in high enough doses to produce EEG suppression, it is important to know the effects of complete EEG suppression on cerebral pressure autoregulation and carbon dioxide reactivity. The purpose of this study was to determine if cerebral carbon dioxide reactivity and pressure auto-regulation remain intact during propofol-induced isoelectric EEG.
Patients and methods
After obtaining local Ethics Committee approval and informed written consent, we examined carbon dioxide reactivity and pressure autoregulation dur-ing propofol-induced isoelectric EEG in 10 patients (ASA I or II, mean age 37 (range 23-44) yr, weight 76 (SD 10) kg) undergoing anaesthesia for non-neurosurgical procedures. Patients who had car-diovascular, respiratory or neurological disease, and those receiving psychotropic drugs were excluded. After commencing routine monitoring (ECG, non-invasive arterial pressure and pulse oximetry), anaesthesia was induced with propofol 2.5 mg kg"1 and fentanyl 3ugkg"'. Neuromuscular block was produced with vecuronium 0.1 mg kg"1 and the lungs ventilated with an air-oxygen mixture to maintain normocapnia (PaC02 5.3 (SD 1) kPa). Anaesthesia was maintained with a propofol infusion of either 250 or 300 u.g kg"1 min"1 to produce isoelectricity of the EEG and the rate of infusion remained unchanged for the duration of the study. Repeated doses of vecuronium were used to maintain neuromuscular block. A radial arterial catheter was then inserted for continuous monitoring of mean arterial pressure (MAP) and repeated sampling for measurement of blood-gas tensions.
BASIL F. MATTA, MB, FRCA, ARTHUR M. LAM, MD, FRCPC, STEPHAN STREBEL*, MD, TERESA S. MAYBERG, MD, Department of
Anes-thesiology, University of Washington School of Medicine, Harborview Medical Center, 325 Ninth Avenue, ZA-14, Seattle, WA 98104, USA. Accepted for publication: September 2, 1994. *Present address: University of Basel/Kantonsspital, Depart-ment of Anaesthesia, CH-4031, Basel, Switzerland.
Cerebral blood flow velocity was measured by insonating the right middle cerebral artery (MCA) using a 2-MHz transcranial Doppler probe (Multidop by DWL, Sipplingen, Germany) through the tem-poral window. This method has been reported previously [10]. Briefly, the probe was secured in position so that the angle of insonation remained constant throughout the study. Doppler signals from the right MCA were identified and measured at a depth of 45—50 mm. The shift in frequency spectra of the Doppler signals converted into time—mean peak flow velocity (zimca) were displayed on a video monitor. To reduce ventilatory effects, measure-ments were obtained only during end-expiration and averaged over 3-4 cycles. Brain electrical activity was monitored using a two-channel fronto-occipital montage (Spacelab, Redmond, WA, USA), using a module which displayed unprocessed EEG signals. In all patients, an infusion of 0.01 % phenylephrine was used to maintain mean MAP within the normal range of 70-90 mm Hg.
After 5-15 min of isoelectric EEG, relatively stable arterial pressure and normocapnia, the infusion rate of phenylephrine was increased so as to elevate MAP by approximately 20 mm Hg from baseline and vmca was recorded simultaneously. The infusion rate of phenylephrine was then decreased and MAP allowed to return to baseline. Carbon dioxide reactivity was then tested by varying Pacc>2 between 4.0 and 7.0 kPa and recording vmca simultaneously. Arterial Pacc,2 was varied by altering minute ventilation, primarily by changing the rate so that inspiratory pressure remained relatively constant. A minimum of 5 min for stabilization (unchanged end-tidal carbon di-oxide) was allowed at each PaCo2 before
measure-ments were made. Three pairs of PaC02-vmca data were obtained in each patient for determination of carbon dioxide reactivity.
The index of autoregulation (IOR) was denned as the ratio of percentage change in estimated cerebral vascular resistance to percentage change in MAP. Estimated cerebral vascular resistance (CVRe) was calculated using the equation CVRe = MAP/vmca, where MAP = mean arterial pressure at the time of wmca measurement. An unchanged vmca would theoretically occur if the percentage change in CVRe was equal to the percentage change in MAP. Thus an IOR of 1 implies perfect autoregulation and an IOR of 0 complete absence of autoregulation (IOR =
%ACVRe/%AMAP). Based on a dynamic auto-regulation study [11], we considered a 15% change in IOR to be clinically insignificant. For a power of 0.80, an a error of 0.05 and a P error of 0.20, the required number of patients to reject the null hypothesis was 10. The computed IOR and data recorded before and after the phenylephrine-induced increase in MAP were analysed using Student's paired t test. P < 0.05 was considered statistically significant.
To determine carbon dioxide reactivity, regression lines were constructed for the paired PaCO2-vmca data for each patient. Relative vmca was expressed also as a percentage of timca at a Pacc,2 of 5.3 kPa for all patients. Carbon dioxide reactivity was expressed in both absolute (change in vmca per kPa change in
PaC02) and relative values (percentage change in vmca per kPa change in Pacc,2). For percentage changes, vmca was normalized to vmca at a Pacc,2 of 5.3 kPa.
Results
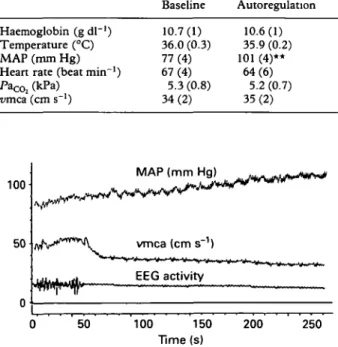
The major findings of the study are shown in table 1 and figures 1-3. There was no significant change in patients' body temperature, haemoglobin concen-tration or partial pressure of oxygen (PaO2) in arterial blood during the course of the study (table 1). There was no change in PaCO2 during the autoregulation part of the study and no change in MAP during the carbon dioxide reactivity part of the study. The autoregulation data are shown in table 1. An increase in MAP of mean 24 (SEM 5) mm Hg had no effect on vmca. IOR was 0.93 (0.02) and was not significantly different from 1, indicating near perfect autoregulation. A representative trace is shown in figure 1.
Linear regression analysis demonstrated a close relationship between vmca and Pacc,2, with cor-relation coefficients greater than 0.90 in all instances (P < 0.001). Although absolute cerebral vaso-reactivity to carbon dioxide derived by linear regression analysis was lower than reported awake values, relative cerebral vasoreactivity to carbon dioxide was within normal limits for all patients studied (8.5 (SEM 0.8) cm s"1 kPa"1 and 22 (2) % kPa"1, respectively). Absolute vmca vs PaCo2 for all paired data and the respective linear regression lines (slopes) are shown in figure 2. Figure 3 shows
Table I Temperature and haemodynamic data during pressure autoregulation (mean (SEM)). ** P < 0.01 compared with baseline (Student's paired t test)
Haemoglobin (g dl~') Temperature (°C) MAP (mm Hg) Heart rate (beat min"1) PaC0; (kPa) vma (cm s ') Baseline 10.7(1) 36.0 (0.3) 77(4) 67(4) 5.3(0.8) 34(2) Autoregulation 10.6(1) 35.9 (0.2) 101 (4)** 64(6) 5.2 (0.7) 35(2) 100 50 MAP (mm vmca (cm s"1) E E G a c t i v i t
v
50 100 150 Time (s) 200 250Figure 1 Representative trace of autoregulation during propofol-induced EEG silence showing mean arterial pressure (MAP), mean cerebral blood flow velocity (nmca) and unprocessed EEG activity. Because of flow-metabolism coupling, the onset of EEG silence is associated with a sudden decrease in Dmca.
161
Figure 2 Absolute cerebral blood flow velocity rmca; is the corresponding Paco. value for all patients studied. The dashed lines indicate individual patient absolute carbon dioxide reactivity, the solid line represents mean (SEM) carbon dioxide reactivitv. 200 150 -jo 50 3 4 5 6 7 PaC0?(kPa»
Figure 3 Composite plot of relative middle cerebral artery velocity (umca) vs the corresponding PaCo2 value for all patients
studied. Relative wnca was calculated by expressing flow velocity values as a percentage of wnca at a Pacc,2 of 5.3 kPa.
The respective linear regression is shown.
relative cerebral vasoreactivity (relative wmca vs PaCo2). Normalization is necessary to allow pooling of data with different baseline values.
Discussion
We have shown that during propofol-induced iso-electric EEG, both cerebral pressure autoregulation and carbon dioxide reactivity are intact. This suggests that both of these mechanisms are not dependent on cortical activity. The findings have important clinical implications as there is some experimental evidence which suggests that propofol has cerebral protective properties when used in high enough doses to induce EEG suppression [12].
There was no significant difference in patients' body temperature or haemoglobin concentration during the course of the study. Haemoglobin can affect flow velocity as haemodilution decreases viscosity and increases CBF and flow velocity [13]. Steady-state conditions were maintained during both parts of the study; MAP was maintained constant during the carbon dioxide reactivity part of the study, whereas P a ^ was unchanged between normo-tension and phenylephrine-induced hypernormo-tension phases. The only other drug used was fentanyl, which has no direct cerebrovascular effects [14].
Using transcranial Doppler ultrasonography (TCD) it is possible to measure CBF velocity in a
non-invasive continuous manner. However, CBF velocity is not a direct measure of CBF. Although techniques to measure CBF, such as radioactive xenon, are available, these are cumbersome and slow, require steady state and allow only a limited number of measurements. TCD recordings, on the other hand, may be obtained continuously. Although correlation between absolute flow velocity and CBF in any given population is poor, largely because of variation in MCA diameter, good correlation be-tween relative changes in flow velocity and CBF has been demonstrated [15, 16]. Moreover, TCD studies on carbon dioxide reactivity indicated that this may be a particularly suitable tool for such investigations, as multiple paired measurements are taken and linear regression lines can be constructed more accurately than with a limited number of conventional blood flow measurements [15, 17, 18]. The validity of TCD rests on the assumption that the MCA is a con-ductance vessel and its diameter does not change significantly with changes in P ac o. Changes in cerebral vascular resistance occur primarily by dilatation of arterioles and not the arteries of the circle of Willis [19]. Consequently, the MCA as a conductance vessel is unlikely to be affected by vasoactive agents. These assumptions have been confirmed recently by Giller and colleagues who observed during operation that the diameter of the proximal MCA does not dilate more than 4 % during variations in PaCO2 or arterial pressure, nor does it change appreciably with systemic administration of nitroprusside or phenylephrine [20]. The lack of change in diameter with change in Pacc,2 has also been reported previously by Huber and Handa [21]. If we accept the assumption that the MCA region that TCD insonates does not change in diameter, then the change in blood flow velocity is proportional to changes in CBF. Indeed, Kirkham and co-workers have shown that carbon dioxide reactivity deter-mined with TCD correlates well with carbon dioxide reactivity determined using direct methods of measuring CBF [18].
Normal wmca varies from 35 to 90 cm s~' with a mean of approximately 60 cm s~' during the awake and resting states [22]. This range of umca probably reflects individual differences in MCA diameter, baseline CBF and the angle of insonation. The low absolute carbon dioxide reactivity seen during propofol-induced EEG silence can be explained by the cerebral vasoconstrictive effect of propofol and is consistent with results we reported previously during propofol anaesthesia [10]. Therefore, as baseline ornca is low, the change per kPa change in PaCOa in absolute numbers is similarly reduced. When this is normalized to a wmca at a PaC02 of 5.3 kPa, the relative slope expressed as a percentage approximates the awake value. Compared with the absolute change, the percentage change in amca with change in Pac o shows less dependence on baseline values, is there-fore more appropriate for statistical analysis [23], and consequently is a more valid indicator of carbon dioxide reactivity.
Normalizing all iraca values by expressing them as a percentage of wmca at a Pacc,2 of 5.3 kPa also allows comparisons with previously published
studies. As we measured wmca and not CBF, we could only estimate cerebral vascular resistance (CVRe). This assumes that the changes in CBF correlate with changes in vmca. This is not an unreasonable assumption as changes in CBF have been shown to correlate well with changes in wmca [15, 16]. The index of autoregulation is then cal-culated by dividing the percentage change in CVRe by the percentage change in MAP. If the percentage change in CVRe is the same as the percentage change in MAP, no change in CBF results. Thus an autoregulation index of 1 indicates perfect auto-regulation, and an IOR of 0 signifies complete absence of autoregulation. Mean IOR was 0.93 (SEM 0.02), indicating that good autoregulation was present during propofol-induced EEG silence. We considered a 15% deviation from IOR of 1 to be unimportant clinically and within normal limits, as dynamic autoregulation in normal volunteers has been shown to have a SD of 15 % [11]. Power analysis ensured that 10 patients were sufficient to reject the null hypothesis with a power of 0.80. Based on this, we found the autoregulatory capacity to be intact during propofol-induced EEG suppression. Al-though we only examined autoregulation in one direction (increase in MAP), we chose a level of MAP in the middle of the autoregulatory curve. Therefore, there is no reason to assume that a decrease instead of an increase in MAP would have yielded different results.
A hallmark of normal cerebral vasculature is an intact autoregulatory response to changes in cerebral perfusion pressure (CPP). In the normotensive human, autoregulation is operative over a range of mean CPP of 50-150 mm Hg. Within this range, cerebrovascular resistance varies directly with MAP to maintain CBF constant. In the event of an abrupt change in CPP, blood flow initially changes correspondingly for a brief period (1-5 s) before the autoregulatory mechanism returns flow to control levels [11]. Some pathological states and pharma-cological interventions can modify or abolish auto-regulation. Moreover, there is evidence to suggest autoregulation is more susceptible to perturbation than carbon dioxide reactivity. Okuda and colleagues have demonstrated that in baboons made hypo-tensive by haemorrhage to an MAP beyond the lower limit of autoregulation (MAP of 40 mm Hg), and subsequently rendered normotensive, there was rebound cerebral hyperaemia (i.e. lost auto-regulation) which responded to hypocapnia (i.e. intact carbon dioxide reactivity) [24]. In contrast, mild to moderate head injury often impairs auto-regulation without affecting carbon dioxide reac-tivity [25]. In this study we investigated carbon dioxide reactivity and autoregulation while mini-mizing the effect of metabolic activity by rendering the EEG isoelectric. Cerebal blood flow and metabolism coupling is assumed generally to be intact during i.v. anaesthesia. It has been shown that i.v. agents such as the barbiturates produce cerebral vasoconstriction indirectly by reducing cerebral metabolism. Maximum reduction in CMRo2 co-incides with the development of electrical silence in the EEG, and additional administration of
bar-biturates results in no further reduction in CMRo2 or CBF [26]. Thus a flat EEG is considered the point at which metabolic activity and CBF are depressed maximally and has been used as the end-point for cerebral protection. Although recent studies suggest that metabolic suppression may play only a small role in the overall scheme of cerebral protection [27], it continues to be used clinically as a method of cerebral protection and for reducing ICP [8, 28]. It seems logical that in situations of reduced oxygen delivery, keeping CMRo2 to a minimum would increase the margin of safety in those patients at risk of cerebral ischaemia. The use of barbiturates for cerebral protection is associated with profound cardiovascular depression and prolonged awakening which may be undesirable in neurosurgical patients. Propofol, with similar cerebral vascular effects as thiopentone, has a relatively short duration of action and is useful for producing short periods of cerebral metabolic suppression without delayed awakening. Indeed, the protective effect of propofol has been demonstrated in an experimental ischaemic model [12]. The effect of suppressing cortical activity to the point of EEG silence with barbiturates has been shown not to significantly affect carbon dioxide reactivity in humans [29] or autoregulation in sheep [30]. We have now confirmed that high-dose propofol, sufficient to produce EEG silence, also preserved carbon dioxide reactivity and auto-regulation. The preservation of these normal homeo-static mechanisms increases the safety of intra-operative manipulation of arterial pressure and carbon dioxide, at least in neurologically normal patients. Because of its pharmacokinetic profile, propofol may be preferable to thiopentone when EEG suppression is indicated clinically.
We conclude that in patients without neurological pathology, cerebral pressure autoregulation and carbon dioxide reactivity are intact during propofol-induced EEG silence. Whether this is true for neurosurgical patients with intracranial pathology requires investigation.
References
1. Miletich DJ, Ivankovich AD, Albrecht RF, Reimann CR, Rosenberg R, Mckissic ED. Absence of autoregulation of cerebral blood flow during halothane and enflurane anes-thesia. Anesthesia and Analgesia 1976; 55: 100-105. 2. Smith AI, Neigh JL, Hoffman JC, Wollman H. Effects of
general anesthesia on autoregulation of cerebral blood flow in man. Journal of Applied Physiology 1970; 29: 665-669. 3. Olsen KS, Henriksen L, Owen-Falkenberg A, Dieg-Peterson
H, Rosenorn J, Chraemmer-Jorgensen B. Effect of 1 or 2 MAC isoflurane with or without ketanserin on cerebral blood flow autoregulation in man. British Journal of Anaesthesia 1994; 72: 66-71.
4. Drummond JC, Todd MM. The response of the feline cerebral circulation to PaCOl during anesthesia with isoflurane
and halothane and during sedation with nitrous oxide. Anesthesiology 1985; 62: 268-273.
5. Matta BF, Lam AM, Mayberg TS, Eng CC. CO2 reactivity during isoflurane and sodium nitroprusside-induced hypo-tension. Anesthesia and Analgesia 1994; 78: S272. 6. Michenfelder JD, Milde JH, Sundt TM jr. Cerebral
protection by barbiturate anesthesia: Use after middle cerebral artery occlusion in Java monkeys. Archives of Neurology 1976; 33: 345-350.
7. Shapiro HM. Barbiturates in brain ischaemia. British Journal of Anaesthesia 1985; 57: 82-95.
8. Spetzler RF, Hadley MN. Protection against cerebral is-chemia : the role of barbiturates. Cerebrovascular and Brain Metabolism Reviews 1989; 1: 212-229.
9. Artru AA, Shapira Y, Bowdle TA. Electroencephalogram, cerebral metabolic, and vascular responses to propofol anesthesia in dogs. Journal of Neurosurgical Anesthesiology 1992;4: 99-109.
10. Eng C, Lam AM, Mayberg TS, Lee C, Mathisen T. The influence of propofol with and without nitrous oxide on cerebral blood flow velocity and CO2 reactivity in humans. Anesthesiology 1992; 77: 872-879.
11. Aaslid R, Lindegaard KF, Sorteberg W, Nornes H. Cerebral autoregulation dynamics in humans. Stroke 1989; 20: 45-52. 12. Kochs E, Hoffman WE, Werner C, Thomas C, Albrecht RF, Schulte am Esch J. The effects of propofol on brain electrical activity, neurologic outcome, and neuronal damage following incomplete ischemia in rats. Anesthesiology 1992; 76: 245-252.
13. Brass LM, Pavlakis SG, DeVivo D, Piomelli S, Mohr JP. Transcranial Doppler measurements of middle cerebral artery. Effect of hematocrit. Stroke 1988; 19: 1466-1469. 14. Milde LN, Milde JH, Gallagher WL. Cerebral effects of
fentanyl in dogs. British Journal of Anaesthesia 1989; 63: 710-715.
15. Bishop CCR, Powell S, Rutt D, Brouse NI. Transcranial Doppler measurement of the middle cerebral flow velocity: A validation study. Stroke 1986; 17: 913-915.
16. Newell WD, Aaslid R, Lam AM, Mayberg TS, Winn HR. Comparison of flow and velocity during dynamic auto-regulation testing in humans. Stroke 1994; 25: 793-797. 17. Hirst RP, Slee TA, Lam AM. Changes in cerebral blood flow
velocity after release of intraoperative tourniquets in humans: A transcranial Doppler study. Anesthesia and Analgesia 1990; 71: 503-510.
18. Kirkham FJ, Padayachee TS, Parsons S, Seargent LS, House FR, Gosling RG. Transcranial measurements of blood flow velocities in the basal arteries using pulsed Doppler ultra-sound: Velocity as an index of flow. Ultrasound in Medicine and Biology 1986; 12: 15-21.
19. Aaslid R. Transcranial Doppler examination techniques. In: Aaslid R, ed. Transcranial Doppler Sonography. New York: Springer-Verlag, 1986; 39-59.
20. Giller CA, Bowman G, Dyer H, Mootz L, Krippner W. Cerebral arterial diameters during changes in blood pressure and carbon dioxide during craniotomy. Neurosurgery 1993; 32: 737-741.
21. Huber P, Handa J. Effect of contrast material, hypercapnia, hypoventilation, hypertonic glucose and papaverine on the diameter of the cerebral arteries—angiographic determination in man. Investigative Radiology 1967; 2: 17-32.
22. Aaslid R, Huber P, Nornes H. Evaluation of cerebrovascular spasm with transcranial Doppler ultrasound. Journal of Neurosurgery 1984; 60: 37^2.
23. Kaiser L. Adjusting for baseline: change or % change? Statistics in Medicine 1989; 8: 1183-1190.
24. Okuda Y, McDowell DG, Ali MM, Lane JR. Changes in CO2 responsiveness and in autoregulation of the cerebral cir-culation during and after halothane-induced hypotension. Journal of Neurology, Neurosurgery and Psychiatry 1976; 39: 221-230.
25. Newell DW, Aaslid R, Stoos R, Reuben HJ. Evaluation of closed head injury patients using transcranial Doppler monitoring. In: Avezaat CJJ, van Eijndhoven JHM, Maas AIR, Tans JTJ, eds. ICP VIII International Symposium. Heidelberg: Springer-Verlag, 1993; 309-312.
26. Michenfelder JD. The interdependency of cerebral function and metabolic effects following massive doses of thiopental in the dog. Anesthesiology 1974; 41: 231-236.
27. Drummond JC. Brain protection during anesthesia. A reader's guide. Anesthesiology 1993; 79: 985-992.
28. McDermot MW, Durity FA, Boronzny M, Mountain MA. Temporary vessel occlusion and barbiturate protection in cerebral aneurysm surgery. Neurosurgery 1989; 25: 54-61. 29. Pierce EC jr, Lambertson CJI, Deutsch S, Chase PE, Linde
HW, Dripps RD, Price HL. Cerebral circulation and metabolism during thiopental anesthesia and hyperventilation in man. Journal ofClinical Investigations 1962;41: 1664-1671. 30. Donegan JH, Traysman RJ, Koehler RC, Jones MD jr,
Rogers MC. Cerebral vascular, hypoxic, and autoregulatory responses during reduced brain metabolism. American Journal of Physiology 1985; 249: 421^29.