A post-processed 3D visualization tool
for forest fire simulations
Alexandre MUZY
CNRS LISA laboratory
Università di Corsica
Pasquale Paoli
22, av. Jean Nicoli
20250 Corti
[email protected]
David RC HILL
Mathieu JOUBERT
UMR CNRS 6158
Blaise Pascal University
BP 10125
AUBIERE Cedex FRANCE
[email protected]
Eric INNOCENTI
Università di Corsica
Pasquale Paoli
UMR CNRS 6134
Campus Grossetti, BP 52
20250 Corti
[email protected]
ABSTRACT
A collaboration between simulationists and scientists working on fire spread and ecology led to the design of a 3D visualization tool. This tool is a post-processor which can be linked to existing discrete event fire spread models. An object-oriented analysis and design has been retained to produce flexible open source software. The tool developed can produce realistic 3D landscape rendering of fire spread on regular PC. This software is now used in Corsica to help in prospective studies around the region of Montegrosso.
Keywords
3D visualization, discrete-event simulation, forests, fire spread.
1. INTRODUCTION
Nowadays, computers are commonly used by scientists to reproduce landscapes, store experimental data and reproduce trajectories of dynamic systems. Reproducing 3D landscapes on computers screens is a metaphor construction of reality. The user can thus build truly virtual landscape and observe their structure. It has been studied extensively in the computer graphics community [1][2]. When dealing with the visualization of simulations results, many details have to be abstracted according to the question the scientist wants to answer. A background history bibliography of graphics and animation for simulation can be found in the fifth chapter of [3].
Beyond 3D visualization on a single PC, Virtual Reality (VR) immersive tools are even more powerful metaphors which consist in being able to move dynamically into the landscape observing trees and rocks (existing or not). People immerged in this kind of environments are not just facing data, they are surrounded by data. To achieve real-time rendering of large-scale terrains enclosing numerous trees, shrubs and grass, fire, smoke, massive data have to be grasped in a distributed and optimized way requiring specific software developments. Such approach is currently investigated for visualizing real-time simulations of fire spread [12].
However, when dealing with 3D landscape, we do not always need immersive techniques such as VR. Reflecting on a screen the dynamics of a landscape with simulation tools, is considered useful by scientists and decision makers. Like in many other
domains, visualization tools helps in validating and analyzing results and provide a good mean of communication. Very sophisticated tools such as VistaPro and Bryce are incredibly efficient for landscape rendering1. The animation of simulation models is undoubtedly a considerable asset when presenting results. The advantages of such an approach are mainly to be able to present more realistically, situations that would have cost too much to setup in terms of in time, physical efforts, and money. To observe a forest fire spread, we do not have to burn forests… For instance, a traditional way to train forest fire fighters is to setup an outdoor training, involving many human and material resources including airplanes. New simulation technique, using parallel computing have been developed by ParallelGraphics and were used by the EMI company to create a complete collaborative 3D environment for forest fire fighting training (http://www.parallelgraphics.com/products/sdk/success/fire/). This kind of environment enables the display of components, such as firefighters, canadairs and their firefighting dynamics, it is not the purpose of our rendering tool.
The objective of this work is not for training or to focus on landscape rendering but for simply and efficiently visualizing simulation experimentations. Hence, we wanted to develop a fast 3D visualization tool able to run on a single personal computer. This visualization tool is able to post-process simulation results issued from real-time fire simulations we have developed [4], the algorithms when given using DEVS (Discrete EVent Specification), a well known formalism introduced by Bernie Zeigler . Another objective is to give a realistic rendering of forest fire spreading at low cost. Even if we have modest objectives, we wanted to be able to represent various forests (according to tree species, height and coordinates) and various landscapes (with rocks, slopes and elevations). Besides, this visualization tool can be coupled with other discrete-event simulations, where events affect the growth or the existence of a tree. If the forest ecological model is extremely simplified, the reader more interested in this aspect of forest simulation will be able to refer to [5].
Considering the previous objectives, we are proposing a small software tool with a sound object-oriented design able to display realistic landscape fires on a regular PC. This software is available for scientists working on forest dynamics without high
1
http://www.daz3d.com/i.x/software/bryce/
Permission to make digital or hard copies of all or part of this work for personal or classroom use is granted without fee provided that copies are not made or distributed for profit or commercial advantage and that copies bear this notice and the full citation on the first page. To copy otherwise, to republish, to post on servers or to redistribute to lists, requires prior specific permission and/or a fee. SIMUTOOLS 2008, March 03-07, Marseille, France
Copyright © 2008 ICST 978-963-9799-20-2 DOI 10.4108/ICST.SIMUTOOLS2008.3028
computer performances. It is the result of a collaboration between researchers working in forest fire simulation [6], ecological simulations [7] and software developers.
The paper is organized as follows. First, a brief description of the tool is provided. Then, we explain the choices made during the object-oriented analysis and design and for forest fire and landscape rendering. After, the application of this tool to a Corsican region is considered. Lastly, conclusions and perspectives are drawn.
2. TOOL DESCRIPTION
The visualization tool has been designed to easily account for many digital data files obtained from both fire spread simulations and field (heights and textures.) Users can define their files in well-defined and generic formats.
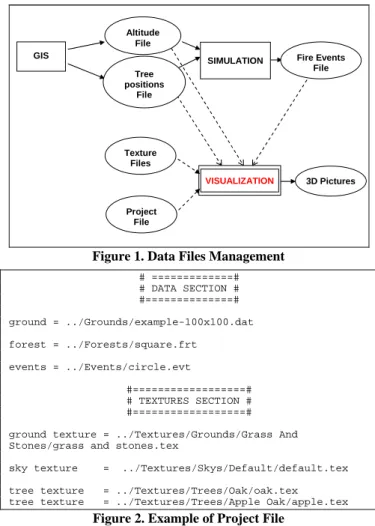
Figure 1 depicts the management of data files. Both Altitude File and Ground Cover Files are common to the simulation and visualization modules. The Altitude File, in ASCII format, corresponds to the height map of the experiment. The Tree
Position File, also in ASCII format, indicates the kind, position
and height of trees. The Simulation module generates a Fire
Events File. The Texture Files correspond to tree, sky, rocks and
grass pictures, in bitmap format. Finally, using a Project File, the
Visualization interface generates 3D pictures, which represent the
field-scale experiment and the simulated fire spread. More details on the file generic formats are given here after.
In the Data section, paths and files containing data are specified. The Ground file contains a height map. In this file, the first line indicates the number of lines, the number of columns and the height map step, which represents the distance between two successive points in the grid (in meters.) Values are separated by spaces or tabs. The viewer initial position (0,0) corresponds to the first value of the last line.
The Forest file contains tree positions (x,y), tree height and tree species. The first line contains the number of trees which are described in the file. After, every line corresponds to one tree characteristics. Spaces or tabs break up information in every line. Trees species refers to the alias of a texture file. The Events file contains information about fire events. One event is described per line. Each line contains: the event date, the event position (x,y), event operating range and event types ("STARTING", "BURNING" and "BURNED" which refers to tree textures states,
cf. sub-section 4.2).
In the Texture section, paths of files containing paths of bitmap files are indicated. The Ground texture file specifies bitmap files used as ground textures. Two expected and necessary keywords are used: "flat" (for flat grounds) and "leaned" (for sloppy grounds.) The Sky texture specifies bitmap files used to texture the sky. Six keywords are expected: "down", "up", "east", "west", "north" and "south." These bitmaps are used to texture the six faces of the sky box. The Tree texture keyword can be used several times. Tree texture files contain paths of tree texture bitmaps. There are nine keywords. First, the "alias" keyword gives the alias used in a forest file to refer to this tree. Then, eight
keywords are grouped by two. They correspond to tree fire states. For each state, the application needs a path to a texture and to the corresponding mask. Here are the different pair keywords: "initial texture" and "initial mask", "starting texture" and "starting mask", "burning texture" and "burning mask" and to finish "burned texture" and "burned mask".
SIMULATION Altitude File 3D Pictures VISUALIZATION Tree positions File Texture Files Fire Events File Project File GIS
Figure 1. Data Files Management # =============# # DATA SECTION # #==============# ground = ../Grounds/example-100x100.dat forest = ../Forests/square.frt events = ../Events/circle.evt #==================# # TEXTURES SECTION # #==================# ground texture = ../Textures/Grounds/Grass And Stones/grass and stones.tex
sky texture = ../Textures/Skys/Default/default.tex tree texture = ../Textures/Trees/Oak/oak.tex tree texture = ../Textures/Trees/Apple Oak/apple.tex
Figure 2. Example of Project File
To map 3D abstractions of reality in a coherent and reusable way, an object-oriented design has been proposed.
3. OBJECT-ORIENTED ANALYSIS &
DESIGN
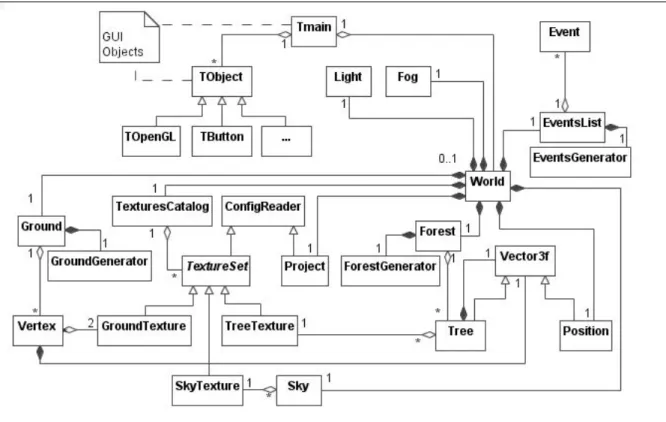
Figure 3 depicts the global class diagram in UML (Unified Modeling Language.) For sack of simplicity every part of the diagram is described sub-section after sub-section.
A World class contains all object abstractions to build a 3D metaphor of reality (a forest here.) A precise (from high to low-level) and reliable description of every class allows one to understand easily the program architecture. Technical choices for an efficient visualization are discussed precisely. The whole
Figure 3. UML Class Diagram Reflecting the Design of Visualization Tool
program has been implemented using both C++ and OpenGL languages. In order to achieve real-time rendering of large-scale terrains enclosing numerous trees, shrubs and grass, lots of terrain optimized rendering techniques have been developed over the past years [8-10].
Our objective here is not to use such deep techniques but to develop original and simple ones in accordance with our software architecture.
To separate data objects (model) from user interface objects (view), the object-oriented design is inspired by the classical « Model View Controller » (MVC) [11]. According to this design, we separate data, treatments and presentation, which give three main categories of objects in the final application: model objects (Ground Cover Objects, Textures Management Objects …), view objects (Graphical User Interface Objects) and controller objects (Events Simulation Objects). Change on the user interface will not affect model objects which can be reorganized without changing the User Interface Objects. Model Objects and Controller Objects are decoupled from User Interface and then user interaction. Hence, we are able to reduce relationships between the main components of the tool. The advantage is the clearness of the hierarchical object architecture which facilitates maintenance and improvements tasks.
3.1 Graphical User Interface Objects
UML classes for the graphical interface are on top of figure 3. As explained above, relationships between the program core (used for visualization) and its graphical interface have been reduced to the minimum.
Tmain is the main class. The latter aggregates two kinds of
objects. First, the objects necessary to the interface (buttons, menus, scroll bars, the world visualization window, etc.) Second, the World class is used to obtain data information on world structures.
3.2 Ground Cover Objects
On the left corner of figure 3 we find classes dealing only with data visualization entities. According to this diagram, we find a ground aggregates (Ground class) and a set of squares, every square being composed of two triangles. Triangles are composed of three vertexes. Every triangle represents a Groundtexture. Every vertex contains a vector normal (to reflect light): Vector3f. Lastly a Groundgenerator is used to create a parameterized ground structure.
Points have been stored in a matrix of the Ground object. To display a triangle from one point, we find the two other ones in the matrix. The link between triangles and textures is achieved associating two textures to each point. Except points on the top and right borders of the matrix, a point stores all information on
the square it defines with the three neighboring points (on the right, top and diagonal top right of the matrix.) The UML class diagram of Figure 6 is thus obtained.
3.3 A Forest “Composed of Trees”
On the right part of figure 3 we find the six main classes used to represent a forest. As for the ground, a forestGenerator class has been defined. A Forest is thus composed of Trees Concerning the class Vector3f, a tree having all the characteristics of a space vector, the Tree class inherits from Vector3f. Indeed, a tree contains two coordinates and a height. Coordinate computations being overheady, they are all achieved when the forest is loaded. Inheritance of access methods to these data avoids for rewritings. Concerning the composition relationship, a Tree owns, as all points in a field, a normal vector which defines the way to reflect light. Lastly, every Tree is related to a Tree texture. The latter represents combustion phases of the tree.
3.4 Events Simulation Objects (Controller)
On the top right of figure 3, we find the classes related to events management. An event is a phase modification of a tree. They lead to texture changes (fire, ambers, etc.)
An eventsGenerator is integrated in the environment. Hence, events can be obtained as simulation results, or they can be generated to observe fire influences on a forest.
3.5 Textures Management Objects
At the bottom of figure 3, we present the classes for Textures managements (many classes, except the World class to be more precise, are found in the middle left). First, the World class contains a class dedicated to the management of many textures: the TexturesCatalog. The latter aims to upload files and to sort out their access once uploaded. To achieve this goal, it uses the
TexturesSet. The latter is a set of basic structures grouped in
categories. The sets are built reading a file containing the names of the texture files to upload (cf. *.tex extensions of Figure 2.) Hence, they inherit properties from the ConfigReader class. For example, concerning the TexturesSet, when the landscape is displayed, the field can take two appearances according to the slope: vegetation or rocks. Both are independent textures. Concerning the SkyTexture and the TreeTexture classes, the first one contains six basic textures and the second one height basic textures. This allows simplifying relationships between objects and basic display structures. Hence, in the global analysis, the basic texture object does not appear as it is a simple integer.
3.6 Other Classes
The Project class allows the initialization of objects through the configuration file. Hence, it inherits from the ConfigReader file. The Sky class contains a method for displaying the sky. The sky borders the whole visualization scene. It is a cubic object accessing to the SkyTexture class. The Light class contains light parameters. The light corresponds to sunlight. This allows increasing the scene realism through shadows. Lastly, the Fog class can be implemented to represent fog.
4. Forest Fire and Landscape Rendering
When the user is moving across a forest fire, optimizations have to be achieved at the implementation level. Besides, original solutions (following and reducing the vision distance) can be designed. Forest fire rendering is presented through tree textures.
4.1 Activity Tracking
Because of the numerous data to be displayed, optimization of the visualization has to be achieved. In a more coherent way, visualization activity of the user has been tracked. Elements out of his vision (behind him) do not have to be computed and displayed.
Another optimization consists in reducing the vision distance and thus the number of objects to be displayed. The user can dynamically change this distance through the graphical interface).
4.2 Fire Visualization
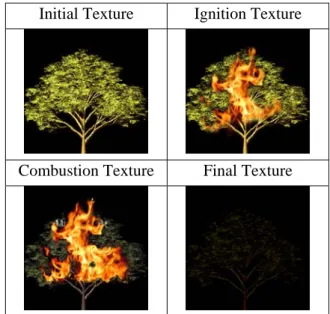
The event types ("STARTING", "BURNING" and "BURNED") correspond to texture phases : (“IGNITION”, “COMBUSTION”, and “FINAL.”) Obviously, an initial unburned texture has been added (cf. Figure 4.)
Figure 4. Combustion Phases of a Tree
5. REAL DATA APPLICATION
The tool developed allows the combination of many cases: 1. Representing actual or simulated landscape elevations, 2. Representing actual or simulated forest data (from a
simulation model or randomly generated), and
3. Representing actual or simulated fire spreading data (from a simulation model or randomly generated).
Initial Texture
Ignition Texture
We present here the combination of an actual landscape, randomly generated forest data, and randomly generated fire spreading data.
5.1 Ground Data
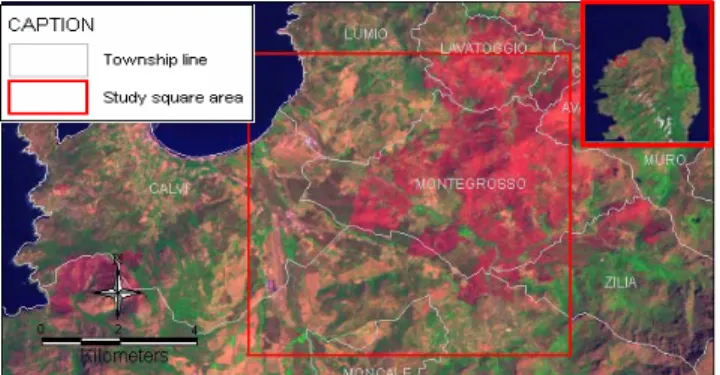
The study area corresponds of the region of Montegrosso in the north-west of the island of Corsica (cf. Figure 5). The position in the island is indicated on the top-right corner of the picture. GIS data represent a satellite picture of the area.
Figure 5. GIS Data of the Study Area of Montegrosso
5.2 Simulation Example
An example of the interface and of a forest fire propagation is presented in Figure 6a;b;c (up to 15000 trees have been generated).
On the interface arrows allow the user to move in through the scene. Speed and view distance can be increased or decreased. Many numbers of tree and fire events can be specified.
The visualization tool read a flat text file produced by the external simulator. Each line gives an individual based event showing the state of the fire spreading. Each event has an impact on the rendering, applying texture and sprite masks to blacken the display. The generator class handles the event list and the fire evolution only consists in reading successive events like in a trace based simulation, the tree position file enables to light a fire at a given position (see table 1 and 2 for file excerpts).
Table 1. Example of a simulation trace (file of fire events) – with the time stamp, the position, the kind of tree and the current state of the tree
1 50 -50 3 BURNING
1 50 -50 0 BURNED
2 50 -50 4 BURNING
2 50 -50 1 BURNED
3 50 -50 5 BURNING
Table 2. Example of a tree position file
30 30 1 OAK
31 30 0,8 SLIM
32 30 1 OAK
33 30 0,8 OAK
6. CONCLUSION
In this paper, we have presented the object-oriented analysis and design of an original simulation tool for 3D visualization of forest and fire metaphors. The objective was to provide a simple tool at low cost, sound and generic enough to help researchers working on forest fires with regular personal computers. By achieving many optimizations and design choices, the tool proved to be efficient, easy to use and to modify. All source codes were carefully documented using the Doxygen tool from Dimitri van Heesch2. Developed with an open source policy, this software is freely available on request. It is currently being tested in Corsica in the Montegrosso region and the visual rendering is satisfactory for scientists in charge of the project. This visualization tool is easily extensible, the post-processor approach, facilitates the tool use and coupling with different fire models, i.e. physicists can use this tool to calibrate their models or to compare experimental and simulated fire fronts.
Perspectives of this simulation tool are twofold. First, we will consider other textures of tree species, depending on the region we will have to handle. Then, concrete terrain experience will tell if we can facilitate the link with different Geographical Information Systems or if we just keep an interface with basic digital elevation models.
7. ACKNOWLEDGEMENTS
The main authors want to thank particularly one of their co-author, Mathieu JOUBERT, who worked hard as a software engineer for the implementation of this tool, as well as Julien MADARY who worked very efficiently, as a GIS specialist, to provide us geographic data.
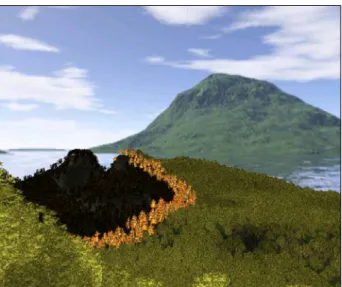
Figure 6a. Snapshot of a Forest Fire Simulation on a Regular PC
2
Figure 6b. Snapshot of Another Forest Fire Simulation
Figure 6c. Another View with a Different Angle and 3 Different Tree Species
8. REFERENCES
[1] Watt A., Watt M., Advanced Animation and Rendering
Techniques, Theory and Practice, Addison Wesley, 1992.
[2] Foley J., van Dam A., Feiner S., Hughes J. Computer
Graphics, Principles and Practice, 2nd Edition in C, Addison Welsey, 1996.
[3] Hill D.R.C., Object-oriented analysis and Simulation, 1996, Addison-Wesley.
[4] Muzy A., Innocenti E., Aïello A., Santucci J.F., Santoni P.A and Hill D.R.C., Modelling and simulation of ecological
propagation processes: application to fire spread,
Environmental Modelling & Software, Volume 20, Issue 7, July 2005, p. 827-842.
[5] Hill D.R.C., Coquillard P., “Ecological Modelling and Simulation”, in Handbook of Dynamic System Modeling, Paul Fishwick Editor, CRC Press, Chapitre 29, 18p, 2007. [6] Muzy, A., E. Innocenti, D.R.C. Hill, A. Aïello, J.F.
Santucci, and P.A. Santoni. Dynamic structure cellular
automata in a fire spreading application. Chosen as one of the best papers of the conference. in First International Conference on Informatics in Control, Automation and Robotics. 2004. Setubal, Portugal: IEEE/CSS/IFAC/ACM/
AAAI/APPIA. p. 143-151.
[7] Coquillard, P. and D. Hill, Modélisation et Simulation des
Ecosystèmes. Masson ed. 1997.
[8] Losasso, F. and H. Hoppe. Geometry clipmaps: Terrain
rendering using nested regular grids. in SIGGRAPH. 2004.
Los Angeles, USA. p. 769-776.
[9] Lindstrom, P., D. Koller, W. Ribarsky, L.F. Hodges, N. Faust, and G.A. Turner. Real-Time, Continuous Level of
Detail Rendering of Height Fields. in SIGGRAPH. 1996.
New Orleans, USA. p. 109-118.
[10] Duchaineau, M., M. Wolinsky, D.E. Sigeti, M.C. Miller, C. Aldrich, and M.B. Mineev-Weinstein. ROAMing terrain:
real-time optimally adapting meshes. in IEEE Visualization.
1997. Phoenix, USA. p. 81-88.
[11] Kasner G.E. and Pope S.T., A cookbook for using the model
view controller user interface paradigm in Smalltalk-80.
Journal of Object-Oriented-Programming, Vol 1, N°3, p. 26-49, August/September 1988.
[12] Muzy, A., N. Fauvet, P. Bourdot, F. Bosseur, and C. Gouinaud. A VR Platform for Field-scale Phenomena: An
application to Fire Spread Experiments. in Graphite, ACM SIGGRAPH. 2005. Netherland. p. 155-158.