HAL Id: hal-00302274
https://hal.archives-ouvertes.fr/hal-00302274
Submitted on 1 Jan 2003
HAL is a multi-disciplinary open access
archive for the deposit and dissemination of
sci-entific research documents, whether they are
pub-lished or not. The documents may come from
teaching and research institutions in France or
abroad, or from public or private research centers.
L’archive ouverte pluridisciplinaire HAL, est
destinée au dépôt et à la diffusion de documents
scientifiques de niveau recherche, publiés ou non,
émanant des établissements d’enseignement et de
recherche français ou étrangers, des laboratoires
publics ou privés.
Time-dependent prediction degredation assessment of
neural-networks-based TEC forecasting models
Th. D. Xenos, S. S. Kouris, A. Casimiro
To cite this version:
Th. D. Xenos, S. S. Kouris, A. Casimiro. Time-dependent prediction degredation assessment of
neural-networks-based TEC forecasting models. Nonlinear Processes in Geophysics, European Geosciences
Union (EGU), 2003, 10 (6), pp.585-587. �hal-00302274�
Nonlinear Processes in Geophysics (2003) 10: 585–587
Nonlinear Processes
in Geophysics
© European Geosciences Union 2003
Time-dependent prediction degredation assessment of
neural-networks-based TEC forecasting models
Th. D. Xenos1, S. S. Kouris1, and A. Casimiro2
1Department of Electrical and Comp. Eng., Univ. of Thessaloniki, Greece 2Department of Electrical and Comp. Eng., Univ. do Algarve, Faro, Portugal
Received: 5 March 2003 – Revised: 31 July 2003 – Accepted: 1 September 2003
Abstract. An estimation of the difference in TEC
predic-tion accuracy achieved when the predicpredic-tion varies from 1 h to 7 days in advance is described using classical neural net-works. Hourly-daily Faraday-rotation derived TEC measure-ments from Florence are used. It is shown that the prediction accuracy for the examined dataset, though degrading when time span increases, is always high. In fact, when a relative prediction error margin of ±10% is considered, the popula-tion percentage included therein is almost always well above the 55%. It is found that the results are highly dependent on season and the dataset wealth, whereas they highly depend on the foF2 – TEC variability difference and on hysteresis-like effect between these two ionospheric characteristics.
1 Introduction
The prediction of ionospheric total electron content (TEC) is a complex problem. The greatest contribution to the TEC is from the ionospheric F-layer, which is a significantly vari-able ionized region of the atmosphere, where the electron concentration and distribution is governed by not only solar and geomagnetic influences, but also by neutral-wind effects. The use of neural networks to predict values of ionospheric peak electron density or foF2 is now well established (Xenos, 2002). However, the variability of TEC is not governed by exactly the same factors as foF2, since important contribu-tors to the TEC are also the topside ionosphere and influ-ences from the plasmasphere above the F2-region (Ciraolo and Spalla, 1997).
In this paper, forecasting assessment of TEC, 1 h, 1-, 2-and 7-days ahead, using neural networks is performed. TEC recorded at Florence has been divided into two groups, one for training the neural network and the other for testing the predictions. The two periods include the peaks of solar cy-Correspondence to: Th. D. Xenos
cles 21 and 22. The accuracy of forecasting TEC using a neural-network approach is assessed.
2 Data and analysis
Faraday-rotation measurements from geostationary satel-lites, recorded at Florence (Spalla et al., 1987), have provided a valuable archive of TEC over a long period. Hourly-daily values of TEC from the time period 1975–1982 have been used to train the neural network. Hourly-daily TEC values from a separate time period (1989–1991) have been used for testing the prediction accuracy of the models. Four models were developed for each month; namely a model for one-hour (1-h), one-day (1-d), two-days (2-d) and seven-days (7-d) ahead. No prediction was attempted for April, due to the fact that there were no measured values available for this month during the years 1989–1991. To compensate for the solar and geomagnetic activity effects on the ionosphere, the corresponding F2-layer critical frequencies (foF2) measured at Rome, a vertical incidence ionospheric station close to Flo-rence, were also used as inputs to the neural networks. The characteristics of the neural networks used are summarized in Table 1.
The normalized differences (DTEC) between the predicted and the measured values have been calculated as:
DTEC = (TECpred−TECobs)/TECobs (1)
where:
TECpred the predicted TEC values
TECobs the observed TEC values
The results have been classified in steps of 10% between
−40% and 40% and the distributions have been computed. Then, the results of all four models for each month were compared with respect to the accuracy degradation observed together with the population completeness.
586 Th. D. Xenos et al.: Neural-networks-based TEC forecasting models
Table 1. Neutral Network characteristics
Neural Network type Multilayer perceptron
Training procedure Back propagation. Batching with adaptable learning rate.
Number of Layers 1 input – 2 hidden – 1 output
Neuron activation functions Linear for the input and for the output layer, tanh for the hidden ones.
Table 2. Prediction error distribution of 1-h, 1-d, 2-d and 7-d predicted TEC-values
−20% −10% 0% 10% 20% 1h 1d 2d 7d 1h 1d 2d 7d 1h 1d 2d 7d 1h 1d 2d 7d 1h 1d 2d 7d Jan 3.1 4.9 12.2 7.0 42.5 12.8 30.6 16.8 35.3 41.4 44.4 41.4 11.5 19.0 0.7 19.9 1.9 5.6 0.0 4.2 Feb 4.9 5.5 6.7 6.6 36.6 25.3 24.5 15.5 33.3 34.9 34.4 25.2 10.8 16.4 12.3 38.8 2.5 6.6 10.3 1.6 Mar 15.9 10.2 17.1 10.2 28.2 18.8 22.6 30.5 32.7 23.7 21.2 18.1 10.2 26.0 12.9 15.9 0.0 6.9 12.9 10.2 May 1.9 8.3 5.1 12.3 17.5 17.5 13.8 17.3 36.5 22.4 32.7 23.7 28.4 26.2 33.9 18.3 10.1 13.7 7.1 8.3 Jun 1.1 9.7 10.2 10.9 9.3 27.4 18.7 19.0 31.9 26.6 20.0 20.3 39.1 14.0 17.4 21.0 13.2 8.2 14.5 13.5 Jul 0.0 6.9 8.8 7.0 1.7 17.8 26.3 21.7 28.3 31.3 30.8 29.0 47.6 28.5 19.2 22.6 15.2 6.0 6.6 6.9 Aug 0.0 8.1 9.2 6.0 6.1 25.4 22.8 18.6 39.1 27.2 30.0 28.2 44.5 23.4 23.4 23.4 5.3 7.5 7.1 14.7 Sep 6.7 14.2 12.7 10.3 18.9 23.9 34.0 26.0 52.3 25.2 24.4 19.5 14.4 16.3 6.0 10.1 0.0 4.8 2.5 7.3 Oct 0.7 7.9 10.0 8.4 37.9 13.9 14.2 9.2 16.9 19.3 20.4 19.7 15.6 20.6 23.5 24.8 9.0 17.4 7.3 19.3 Nov 5.7 3.5 3.7 10.8 39.0 15.7 20.5 11.1 25.6 44.6 22.8 21.3 15.9 13.6 18.2 15.9 1.5 10.7 11.8 11.9 Dec 4.5 5.2 3.9 9.2 32.9 16.3 10.0 25.1 32.5 55.0 56.6 26.0 21.6 5.4 14.5 16.8 1.6 1.8 4.1 11.2
3 Results and discussion
The results obtained are summarized in Table 2. In this table, the prediction error distribution of 1-h, 1-d, 2-d and 7-d in ad-vance predicted TEC-values is presented in steps of 10% for the relative accuracy margin of ±20%. A positive value indi-cates that the TEC has been underpredicted by the neural net-work. It can be seen that the accuracy of the models though degrading as the prediction time span increases, is very satis-factory in the ±10% accuracy margin since it is always above 55% and in several cases it reaches 89.5%. The maximum prediction accuracy for the 1-h model was obtained for Jan-uary and August. This is not the general case though, since maximum prediction accuracy highly depends on the TEC-foF2 variability difference (Xenos, 2002) and given that TEC-foF2 is a key factor in the neural network prediction model, the above result is evident. The worst case for all models is found to be in March and September or October. This can be partly attributed to the fact that the available datasets for these months were very poor. This result, though reasonable considering the operation of the neural network method, cer-tainly merits further investigation. It is also possible that the cause of this variation in the prediction error is linked to the approach of training the neural network on TEC from one solar cycle and predicting on a consecutive one (Feichter and Leitinger, 1997). On the other hand, this could be due to the fact that both TEC and foF2 exhibit stronger variability during the equinoxes (Kouris et al., 1999). It is also known that the foF2 and TEC variabilities differ, to some extent at
Table 3. Prediction accuracy (p%) and database completeness
1-h 1-d 2-d 7-d Winter p% 91.8 85.4 88.4 88.4 Population % 40.4 38.6 37.1 30.5 Spring p% 90.7 86.9 89.7 82.4 Population % 30.3 30.3 29.9 29.9 Summer p% 94.1 89.3 88.3 88.2 Population % 78.0 75.6 73.2 60.5 Autumn p% 86.7 83.9 77.3 75.2 Population % 84.8 82.4 79.8 65.8
least due to the fact that the topside ionosphere and influ-ences from the plasmasphere above the F2-region are impor-tant contributors to the TEC (Ciraolo and Spalla, 1997). If this is taken into account, then the error increase seems rea-sonable. Table 3 shows the overall predicted TEC population percentage lying within the ±20% margin with respect to the database completeness. It can be seen here that generally the prediction accuracy depends more on the ionospheric vari-ability that on the database completeness. Yet, this correla-tion, although evident, it is very difficult to be expressed by a closed form, since the TEC-foF2 seasonal variability is not accounted for here.
Th. D. Xenos et al.: Neural-networks-based TEC forecasting models 587 8 -0,06 -0,04 -0,02 0,00 0,02 0,04 0,06 1 2 3 4 5 6 7 8 9 10 11 12 months averag e mo n th ly rel at ive d evi at io n 1-h 1-d 2-d 7-d
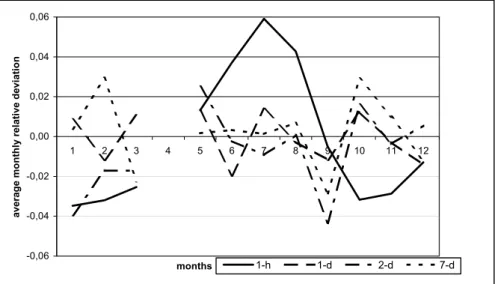
Fig. 1. Presentation of the monthly –10%,+10% prediction error variation for each model.
Fig. 1. Presentation of the monthly
−10%, +10% prediction error variation
for each model.
error variation. It can be seen that the 1-h before model, although more accurate (on the average) than the rest of the models, presents almost always the strongest variability. Moreover, from this figure it can also be observed that the av-erage relative deviation becomes smallest for the 1-d model, whereas it is getting larger as the prediction margin increases, though it never reaches the accuracy of the 1-h model. This is very interesting, since it could give some evidence on the correlation distance of the TEC data. It seems that it is max-imized when values with 24-h difference are considered. Of course this could be valid in all cases except for those of a disturbed ionosphere; yet since no discrimination between quiet and disturbed ionosphere is done in the present study, this assumption cannot be proved. On the other hand this could be due to the hysteresis like effect between foF2-TEC (Kouris and Fotiadis, 2002). In fact (Kouris et al., 2003) it was shown that there are two different values of TEC (or foF2) for a given value of foF2 (or TEC) and it is evident that for a given value of TEC the afternoon values of foF2 are higher than the morning ones and vice-versa. Of course, this is not easily interpreted and certainly deserves more in-vestigation.
Acknowledgements. We herewith would like to thank Dr Paolo
Spalla from IROE-Florence both for providing the TEC dataset and for helping us in understanding it in depth.
References
Ciraolo, L. and Spalla P.: Comparison of ionospheric total electron content from the navy Navigation Sattelite System and the GPS, Radio Science, 32.3, 1071–1080, 1997.
Feichter E. and Leitinger R.: A 22-year cycle in the F-layer ioni-sation of the ionosphere, Ann. Geophysicae, 15, 8, 1015–1027, 1997.
Kouris, S. S. and Fotiadis, D. N.: Ionospheric variability: A com-parative statistical study, Adv. Space Res., 29(6), 977–985, 2002. Kouris, S. S., Fotiadis, D. N., and Xenos, T. D.: On the day to day variation of foF2 and M(3000)F2, Adv. Space Res., 22.6, 873– 876, 1998.
Kouris, S. S., Fotiadis, D. N., and Zolesi, B.: Specifications of the F-region variations for quiet and disturbed conditions, Phys. Chem. Earth, 24.4, 321–327, 1999.
Kouris, S. S., Xenos, T. D., Polymeris, K., and Stergiou D.: Some remarks on the relationship between TEC and foF2, 2nd Work-shop COST 271 on Products for ITU-R and other radiocommu-nication applications, Faro Portugal, Oct., 2002.
Spalla, P., Capannini, E., and Ciraolo, L.: Sirio: A good Chance for Eight Years of Ionospheric Research, Alta Frequenza, LVI, 1-2, 167, 1987.
Xenos, Th. D.: Neural Network Based Single Station Models of the foF2 and M(3000)F2 Ionospheric Characteristics, URSI 99, XXVI General Assembly, 1999.
Xenos, Th. D., Spalla, P., and Mitchell, C.: Neural Network based TEC forecasting models, paper 0940 presented at AP-2000 meet-ing at Davos, Switzerland, 2000.
Xenos, Th. D.: The effects of foF2 variability on TEC prediction accuracy, Annals of Geophysics, 45.1, 191–200, 2002.