HAL Id: hal-00303370
https://hal.archives-ouvertes.fr/hal-00303370
Submitted on 27 Feb 2008HAL is a multi-disciplinary open access
archive for the deposit and dissemination of sci-entific research documents, whether they are pub-lished or not. The documents may come from teaching and research institutions in France or abroad, or from public or private research centers.
L’archive ouverte pluridisciplinaire HAL, est destinée au dépôt et à la diffusion de documents scientifiques de niveau recherche, publiés ou non, émanant des établissements d’enseignement et de recherche français ou étrangers, des laboratoires publics ou privés.
Repeatability and randomness in heterogeneous freezing
nucleation
G. Vali
To cite this version:
G. Vali. Repeatability and randomness in heterogeneous freezing nucleation. Atmospheric Chemistry and Physics Discussions, European Geosciences Union, 2008, 8 (1), pp.4059-4097. �hal-00303370�
ACPD
8, 4059–4097, 2008 Repeatability and randomness in freezing nucleation G. Vali Title Page Abstract Introduction Conclusions References Tables Figures ◭ ◮ ◭ ◮ Back Close Full Screen / EscPrinter-friendly Version Interactive Discussion Atmos. Chem. Phys. Discuss., 8, 4059–4097, 2008
www.atmos-chem-phys-discuss.net/8/4059/2008/ © Author(s) 2008. This work is distributed under the Creative Commons Attribution 3.0 License.
Atmospheric Chemistry and Physics Discussions
Repeatability and randomness in
heterogeneous freezing nucleation
G. Vali
Department of Atmospheric Science University of Wyoming Laramie, WY 82071, USA Received: 3 January 2008 – Accepted: 18 January 2008 – Published: 27 February 2008 Correspondence to: G. Vali ([email protected])
ACPD
8, 4059–4097, 2008 Repeatability and randomness in freezing nucleation G. Vali Title Page Abstract Introduction Conclusions References Tables Figures ◭ ◮ ◭ ◮ Back Close Full Screen / EscPrinter-friendly Version Interactive Discussion
Abstract
This study is aimed at clarifying the relative importance of the specific character of the nuclei and of the duration of supercooling in heterogeneous freezing nucleation by immersed impurities. Laboratory experiments were carried out in which sets of water drops underwent multiple cycles of freezing and melting. The drops contained sus-5
pended particles of mixtures of materials; the resulting freezing temperatures ranged from−6◦C to−24◦C. Rank correlation coefficients between observed freezing temper-atures of the drops in successive runs were>0.9 with very high statistical significance,
and thus provide strong support for the modified singular model of heterogeneous im-mersion freezing nucleation. For given drops, changes in freezing temperatures be-10
tween cycles were relatively small (<1◦C) for the majority of the events. These frequent small fluctuations in freezing temperatures are interpreted as reflections of the random nature of embryo growth and are associated with a nucleation rate that is a function of a temperature difference from the characteristic temperatures of nuclei. About a sixth of the changes were larger, up to±5◦C, and exhibited some systematic patterns. These 15
are thought to arise from alterations of the nuclei, some being permanent and some transitory. The results are used to suggest ways of describing ice initiation in cloud models that account for both the temperature and the time dependence of freezing nucleation.
1 Introduction
20
While it is widely recognized that ice nucleation in tropospheric clouds is of critical concern for weather and climate models, there are major shortcomings in our ability to treat this process reliably. Lack of adequate measurement capabilities, enormous variability of conditions and weaknesses in theory all contribute to this situation. These issues lead to rather different and uncertain assumptions in cloud models about how to 25
ACPD
8, 4059–4097, 2008 Repeatability and randomness in freezing nucleation G. Vali Title Page Abstract Introduction Conclusions References Tables Figures ◭ ◮ ◭ ◮ Back Close Full Screen / EscPrinter-friendly Version Interactive Discussion and Curry, 2004; Diehl and Wurzler, 2004; Morrison et al., 2005; Liu and Penner, 2005;
Prenni et al., 2007).
One of the areas of uncertainty in the formulation of heterogeneous ice nucleation is the separation between temperature dependence and time dependence. This paper attempts to clarify that issue for immersion freezing. Based on laboratory experiments, 5
the relative roles of temperature and time-dependence are assessed. It is shown that the former has primary importance, and the possible contribution of the second is quantified.
2 Underlying concepts
The fundamental percept of nucleation is that it takes place by the fluctuating growth 10
of an embryo of the stable phase from the metastable parent phase. Fluctuations in size are, principally, molecule by molecule and growth becomes favored over diminu-tion once the embryo reaches a critical size that is defined by macroscopic condidiminu-tions – temperature in the case of freezing. At a given temperature, fluctuations lead to a certain probability that a critical embryo develops. In the classical nucleation theory 15
(CNT), as formulated by Volmer (1939), this is usually expressed as a nucleation rate,
J, which is the number of embryos reaching critical size, on average, per unit volume
and per unit time. An expression for the nucleation rate as a function of tempera-ture, with appropriate values for the ice/water interfacial energy and other constants, is adequate to describe homogeneous freezing nucleation; observations and theory 20
converge to indicate a value ofJ=1 cm−3 s−1 in the range−35 to −40◦C. For a given volume, the nucleation rate is a direct predictor of the probability of nucleation within unit time interval.
In heterogeneous freezing nucleation, a substrate immersed in the supercooled liq-uid facilitates the phase transition by providing the possibility for an ice embryo to form 25
ACPD
8, 4059–4097, 2008 Repeatability and randomness in freezing nucleation G. Vali Title Page Abstract Introduction Conclusions References Tables Figures ◭ ◮ ◭ ◮ Back Close Full Screen / EscPrinter-friendly Version Interactive Discussion on it and reach critical size1with a lower free energy barrier than would be the case for
an isolated embryo (homogeneous nucleation). The nature of the substrate determines the degree of energy reduction and hence the temperature at which freezing becomes likely on the scale perceivable in an experiment. For a uniform surface, the nucleation rate can be derived using the modified energy barrier and given as the number of em-5
bryos of critical size forming per unit time and per unit surface area of the substrate. (e.g. Fletcher, 1970; Pruppacher and Klett, 1997). There is no conceptual difficulty with this and the results of the theory are, in principle, testable. Even if the substrate surface contains preferred sites for embryo growth, such as steps or dislocations, but those are all considered equal and randomly distributed, a simple modification to the formulation 10
is possible by incorporating a probability of the preferred sites2per unit area.
Difficulties arise when the sites are not equal in their effectiveness, and if, addition-ally, the substrate material is a dispersion of various particle sizes and/or composi-tion. Since the characteristics of surface features that may constitute the sites are not known, and thus no a priori descriptions can be made, the effectiveness of sites has 15
to be measured and that is where varying assumptions about the relative roles of site characteristics and of time become important and when the definition of nucleation rate
J can become ambiguous. Similarly, even if assumptions were to be made about the
sites, the predicted behavior would still need to take into account the role of time.
1
Critical size is used here to describe the embryo dimension beyond which the probability of growth exceeds that of diminution. This is a useful shorthand designation since the stability of an embryo will depend on more than one parameter, as determined by the specific form or shape of the particular embryo.
2
ACPD
8, 4059–4097, 2008 Repeatability and randomness in freezing nucleation G. Vali Title Page Abstract Introduction Conclusions References Tables Figures ◭ ◮ ◭ ◮ Back Close Full Screen / EscPrinter-friendly Version Interactive Discussion
3 Stochastic and singular descriptions
The fundamentally opposing views of stochastic versus singular behavior of freezing nucleation can be traced in most explicit fashion to Bigg (1953), Carte (1959), Dufour and Defay (1963) for the stochastic model, and to Dorsey (1938), Levin (1950) and Langham and Mason (1958) for the singular model. The terminology characterizing 5
the two assumptions in this way was introduced by Vali and Stansbury (1966), follow-ing similar definitions by Dorsey (1948). In essence, the stochastic model assigns a probability per unit time for nucleation to take place in a given volume of water, with the magnitude of the probability depending on the impurities it is expected to contain as a simple proportion to the average properties of the sample, so that all equal vol-10
umes, drops, have the same chance to freeze within a period of time. In contrast, the singular model considers that each impurity or site has a characteristic temperature,
Tc, at which it causes nucleation as the sample is cooled. Chance allocation of nuclei
into drops is expected to result in each drop having a different set of Tc values in the
temperature range where the average number per drop is small. In its basic form, the 15
singular description would lead to instantaneous freezing atTc, and further time at that
same temperature would lead to no additional nucleation events in a set of drops. A few examples can illustrate how experiments can provide support for the stochas-tic description. Vonnegut and Baldwin (1984) observed large variations in the lapse of time (from a few seconds to more than 5 min) that was needed for nucleation to occur 20
when a single sample of water containing silver iodide particles was repeatedly cooled to the same temperature. By analogy with radioactive decay, they interpreted these observations as a confirmation of the stochastic model. More recently, Seeley and Sei-dler (2001a, b) and Zobrist et al. (2007) report on experiments in which drops of water coated with nonadecanol and other aliphatic alcohols were exposed to repeated cycles 25
of cooling until nucleation was observed, followed by melting. By equating the number of times that a drop was observed to freeze within a temperature interval with the frac-tion of a large number of drops expected to freeze in the same interval when cooled
ACPD
8, 4059–4097, 2008 Repeatability and randomness in freezing nucleation G. Vali Title Page Abstract Introduction Conclusions References Tables Figures ◭ ◮ ◭ ◮ Back Close Full Screen / EscPrinter-friendly Version Interactive Discussion simultaneously, the conclusion is reached that the observed changes in nucleation
tem-peratures for any given drop could be accounted for on the basis of a nucleation rate derived from classical nucleation theory (CNT) with appropriately fitted parameters, i.e. that the variations in freezing temperatures between trials resulted from stochastic effects.
5
The most fundamental evidence in support for the singular description comes from numerous sets of observations (e.g. Dorsey, 1938) that when a sample of water is sub-divided into smaller parts, each of the resulting volumes freezes at different and more or less repeatable temperatures. What has proven to be difficult is to show that what-ever differences appear are not the result of random fluctuations. One approach to do 10
that is to examine the dependence of the average freezing temperature on sample vol-ume. However, it can be shown (the Appendix in Vali and Stansbury, 1966; pg 351 in Pruppacher and Klett, 1997) that both descriptions lead to the same result if the prob-ability density function (pdf) ofTc follows an exponential form. Since the exponential is a good approximation in many cases, volume-dependence turnd out to be a weak test. 15
A basic objection to the singular description is that it disregards the consequences of fluctuating embryo growth.
Based on experiments in which arrays of drops were subjected to steady cooling and interjected periods at constant temperatures, Vali and Stansbury (1966) suggested a qualitative description that allowed for stochastic effects to modify freezing tempera-20
tures corresponding to the characteristic temperatures of the suspended impurities. The effects of random variations was indicated to be equivalent to about 1◦C variations in characteristic temperatures. That “modified singular description” was given further support by experiments described in Vali (1994). Quite recently, Marcolli et al. (2007) reported on experiments in which drops containing mineral dust were subjected to re-25
peated freezing cycles and concluded that a nucleation rate function did not account for the observations, and that it was necessary to include in the description different nucleating abilities for particles in different drops. This work, therefore, supports the modified singular model.
ACPD
8, 4059–4097, 2008 Repeatability and randomness in freezing nucleation G. Vali Title Page Abstract Introduction Conclusions References Tables Figures ◭ ◮ ◭ ◮ Back Close Full Screen / EscPrinter-friendly Version Interactive Discussion The experiments to be reported here were undertaken to provide a quantitative
ba-sis for assessing the stochastic contribution to freezing probabilities for samples that contain impurities with large ranges of characteristic temperatures.
4 Experimental and analysis procedures
The experiments consisted of repeated freezing and melting of drops on a cold stage. 5
Typically, 100 to 144 drops of 0.01 cm3volume were used in an experiment and up to 65 cycles of freezing and melting were executed. Drops were placed on a hydropho-bic surface (thin plastic sheet or aluminum foil coated with a silicone varnish) on top of the thick copper cold stage. All drops were dispensed from the same bulk sample, i.e. the distribution of particles among the drops was a chance process. The cold stage 10
temperature was lowered at a rate of 1◦C min−1until all drops were frozen, then it was warmed to about +5◦C for 5 min. The total time at positive temperatures was consid-erably longer than the time necessary to melt the drops. Freezing of the drops was detected by the change from clear to opaque appearance and was evaluated from time lapse photographs. Temperatures were recorded with a resolution of 0.27◦C (10µV
15
output from the thermocouple sensor). The precision of the recorded nucleation tem-peratures was limited by the sensitivity of the visual detection of brightness changes, and because of that the recorded temperatures are colder than the actual initiation of freezing by an estimated 0.2...0.5◦C.
The influence of the surface supporting the drops is of obvious concern in this type 20
of experiment. In this regard, the first control is that the lowest temperatures at which drops of distilled water were observed to freeze was near−25◦C; that limit may have been set by the surface or by the degree of purity of the distilled water used. The influence of the surface was further tested by observing the freezing temperatures of drops, melting them, and then freezing them again after shifting them to a new posi-25
tion. The shift could be accomplished by gently pushing the drops with a fine steel rod (syringe needle); generally the amount of shift was about two or three times of the
di-ACPD
8, 4059–4097, 2008 Repeatability and randomness in freezing nucleation G. Vali Title Page Abstract Introduction Conclusions References Tables Figures ◭ ◮ ◭ ◮ Back Close Full Screen / EscPrinter-friendly Version Interactive Discussion ameter of drop. These test showed that the drops retained their freezing temperatures
to the same degree as when they were left in the same position. On the average the changes were<0.1◦C although the range of changes extended to about±2◦C; this can be compared with the results to be presented later. Many such tests were conducted with different samples and over long periods of time. The conclusion seems warranted 5
that the supporting surface did not influence the measurements.
Because repeatability was one of the quantities to be evaluated from the exper-iments, the possibility of neighboring drops influencing one another was of special concern. Frost spreading on the supporting surface was observed in runs with poorly prepared coatings of the surface and with high humidity in the air. For this reason, the 10
enclosure covering the drops included a cold trap to dry the air. This resulted in slow evaporation of the drops, but experiments extending to over 30 hours were still possible. The absence of neighbor effects was tested in special runs in which a checkerboard pattern was created with two kinds of drops: some containing particles that causes early freezing and distilled water drops. The distilled water drops remained unfrozen 15
even with all the interspersed drops frozen. Furthermore, tests with data from the main experiments indicated no change in the likelihood of freezing of a drop due to an earlier freezing event next to it. In all, there is fair assurance that the data are free of artifacts. The distilled water used in the experiments was obtained from a glass still of average quality. The emphasis in the use of this water was on reproducibility, not on high purity. 20
To aid this, a large quantity was stored in a container of 20 L capacity and smaller amounts were withdrawn from the container for the experiments. Suspensions of soils samples were obtained by adding about a gram of soil to 250 mL of distilled water and the coarse matter was allowed to settle over a day or so. The supernatant was further diluted as needed, with the main criterion being to produce a large range of 25
freezing temperatures for the drops to be tested; the importance of that feature will be discussed later. Drops were produced with a disposable syringe and stainless steel needle. The uniformity of drop volumes depended on the skill of the operator; while it could be judged by eye quite sensitively it has not been quantitatively evaluated.
ACPD
8, 4059–4097, 2008 Repeatability and randomness in freezing nucleation G. Vali Title Page Abstract Introduction Conclusions References Tables Figures ◭ ◮ ◭ ◮ Back Close Full Screen / EscPrinter-friendly Version Interactive Discussion Differential and cumulative nucleus spectra, k(T ) and K (T ), were calculated following
Vali (1971): k (T ) = 1 V 1 N (T ) d N d T (1) K (T ) = lnNo−lnN (T ) V (2)
whereN0is the total number of drops in the sample andN(T ) is the number not frozen
5
atT. The dimension of k(T ) is [cm−3 deg−1] for V in [cm3], and that ofK (T ) is [cm−3].
Differences in freezing temperatures between two successive runs for a given drop,
δTij, were calculated as the later versus the earlier temperature, so that negative values indicate a decrease with time, and positive ones an increase with time. The subscripti is the earlier run number and j is the drop number. Rank correlation
co-10
efficients for pairs of runs were calculated for drops ordered according to decreasing freezing temperatures.
Analyses were done at two levels. First, for entire sequences of runs and including all the drops. Second, for drops most likely to contain only one nucleus active above a chosen threshold temperature, and, in some cases, for a subset of the runs that 15
showed the most uniform trends. The “single-nucleus” (SN) subsets was defined so as to restrict analyses to those drops for which changes in freezing temperatures were not likely to be due to one or another nucleus becoming active in successive tests. The SN subset was defined as follows: It is assumed that the apportioning of nuclei of given kinds among the drops follows a Poisson distribution. For a drop frozen at 20
some temperatureT there was at least one nucleus in that drop active in the interval
0◦C...T . The average number of nuclei per drop with freezing temperatures above T
isn(T )=K (T )∗V δ where V is the volume of one drop. The probability for a drop of the
same volume from the same bulk sample to contain two or more nuclei of the same kind is given by:
25
ACPD
8, 4059–4097, 2008 Repeatability and randomness in freezing nucleation G. Vali Title Page Abstract Introduction Conclusions References Tables Figures ◭ ◮ ◭ ◮ Back Close Full Screen / EscPrinter-friendly Version Interactive Discussion By comparing Eqs. (2) and (3) it can be seen that P is directly related to N/N0.
For the analyses given here, (3) was used to find the temperatureTsn corresponding
to P =0.1, which means that N(Tsn)/N0=0.58. Drops frozen at Tsn in the first of a
group of runs constitute the SN subset. The choice of P -value used to make this
separation is a compromise between better assurance and overly small sample size. 5
It should be noted that there is no full assurance that the goal of the SN subset is fulfilled. First, because it is based on a statistical estimate. Second, since the subset had to be selected based on observations in a given run, loss of the specific nucleus responsible for freezing in that run could result later in freezing at temperatures where the probability of multiple similar nuclei was high. However, since most changes were 10
small in comparison to the range of temperatures over which the drops in a sample froze, deviations from the SN subset definition due to this fact are not serious. Fuller justification of this statement will emerge from the results to be presented.
5 Results
5.0.1 Soil sample A 15
Surface soil from the near Red Deer, Alberta, Canada was used for two sets of ex-periments a few months apart. The sample contained some vegetative material, both recent and decayed, and was passed through a coarse sieve before use to remove large pieces. This sample was chosen because it was used for many different ex-periments and was known to contain nuclei active at temperatures as high as−6◦C. 20
Sample A refers to the later set of runs, and is discussed first because it is more ex-tensive than the runs done earlier. In this set of runs, 96 drops were used along with 48 drops of distilled water for control. A total of 55 runs were made, the first 50 with-out interruption and the last 5 after an overnight gap. Six of these runs were omitted from the analysis because they had more than one missing data point. Each cycle was 25
ACPD
8, 4059–4097, 2008 Repeatability and randomness in freezing nucleation G. Vali Title Page Abstract Introduction Conclusions References Tables Figures ◭ ◮ ◭ ◮ Back Close Full Screen / EscPrinter-friendly Version Interactive Discussion duration of a run during the first day, including the time to melt the drops, was 17 min.
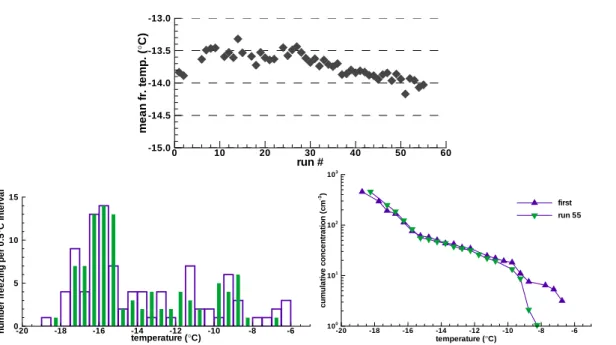
At the final dilution used, the range of freezing temperatures in the initial run was−6.4 to−18.6◦C. The mean freezing temperature of the 96 drops was−13.8◦C in the initial run and changed during the sequence as shown in Fig. 1a. The middle panel of Fig. 1b shows the numbers of drops that froze per half-degree interval in the first and last runs. 5
Fig. 1c shows the cumulative spectra (Eq. 2) for the first and last runs. It is worth not-ing that the overnight gap after run #50 didn’t produce changes much different from the rest of the sequence.
Run-to-run changes in freezing temperatures,δTij , over all values of i and j of the
full set of runs are shown in the second line of Table 1. The median of the 4068 values 10
ofδTi j is zero, and the distribution is symmetrical except at the extremes. Although a
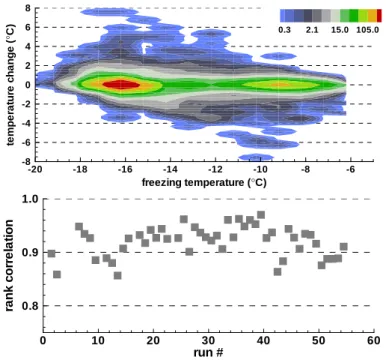
small number ofδTij -values extend to±4◦C, 50% of the changes are within±0.27◦C (the resolution of the temperature readings). Fig. 2a shows a contoured frequency plot ofδTi j-values as a function of the freezing temperature in the run prior to change. The
clustering of high frequencies around−9◦C and−16◦C is a reflection of distribution of 15
freezing events shown in Fig. 1b. This contour plot demonstrates that the majority of changes were near zero independent of the actual temperature but that larger changes also took place.
While the small values of δTij, when compared with the spread of freezing tem-peratures, already provide strong evidence against randomness, the repeatability of 20
freezing temperatures is most strongly demonstrated by the data in Fig. 2b. For freez-ing temperatures observed in subsequent pairs of runs the Spearman rank correlation coefficients (IDL software from Research Systems Inc.) have an average value of 0.92 with a standard deviation of 0.29. The average value of the two-sided significance that these rank correlations arose by chance is 3×1030. The rank correlation is consid-25
ered a robust measure of repeatability even with changes in mean temperatures, and it allows all pairs of runs to be compared independently of those changes.
The point of repeatability was also demonstrated by comparing correlations of ob-served freezing temperatures with randomized values. The coefficient of correlation
ACPD
8, 4059–4097, 2008 Repeatability and randomness in freezing nucleation G. Vali Title Page Abstract Introduction Conclusions References Tables Figures ◭ ◮ ◭ ◮ Back Close Full Screen / EscPrinter-friendly Version Interactive Discussion between the freezing temperatures in runs #26 and #27 is 0.98. When the freezing
temperatures of run #27 are randomly re-ordered 100 times, the 1- and 99-percentile values of the correlation coefficient are −0.25 and +0.31. Thus, if each drop in run #27 had an equal probability to freeze, within the pdf of observed freezing temperatures, the correlation with run #26 would have fallen in that range. That makes the observed 5
0.98 value clearly incompatible with random freezing.
The SN subset (as defined in Sect. 4) was constructed using runs #6 to #50 and drops with T >−15.2◦C in run #6. The SN subset consists of 46 drops in 41 runs. Its main characteristics are shown in Fig. 3: panels a and c are equivalent to Figs. 1a and 2b while panel 3b shows how many of the 46 drops retained freezing 10
temperatures>−15.2◦C during the sequence. As the last row in Table 1 shows, the majority of the run-to-run changes are not significantly different from those for the full data set but there are fewer extreme values. Looking at the magnitudes of fluctuations drop by drop, it is found that the mean values over the 41 runs fall between−0.11◦C and +0.047◦C for 90% of the 46 drops. The largest negative value is−0.2◦C and the 15
largest positive value is +0.07◦C.
In addition to the statistical measures summarized above, the nature of the changes deserve a closer look. Fig. 4 shows the freezing temperatures of 11 (every fourth one) of the drops in the SN subset. Several of these drops froze at essentially the same temperature throughout the sequence, others exhibit sudden large shifts, some 20
underwent gradual changes at least in part of the sequence, and some changes appear temporary. These patterns are typical, although with many variations, of what has been seen in these experiments. A more complete set of drop histories is included in the Supplementary Materials (http://www.atmos-chem-phys-discuss.net/8/4059/2008/ acpd-8-4059-2008-supplement.pdf).
25
5.0.2 Soil sample B
This sample was prepared with the same soil as sample A and handled in a similar way. There was no assurance that the small amount of soil withdrawn for suspension
ACPD
8, 4059–4097, 2008 Repeatability and randomness in freezing nucleation G. Vali Title Page Abstract Introduction Conclusions References Tables Figures ◭ ◮ ◭ ◮ Back Close Full Screen / EscPrinter-friendly Version Interactive Discussion would be identical in composition or amount, neither was control for the length of time
that the sample was in suspension before the experiments were performed. These variations account for the slight differences in the results.
Repeated freezing of 110 drops was carried out over 3 days. Twelve runs on the first day, 30 on the second, and 12 on the third. Eleven drops of distilled water were 5
also included for control, but in this sequence, differently from sample A, cooling was discontinued once all of the drops with soil suspension were frozen. Only one drop of distilled water was observed to freeze during the whole sequence of runs. Due to partial evaporation of the drops, some distilled water was added to bring them back to original volume at the beginning of the third day. This was done to facilitate detection 10
of freezing; the distilled water contained no nuclei active in the range observed for the soil suspension.
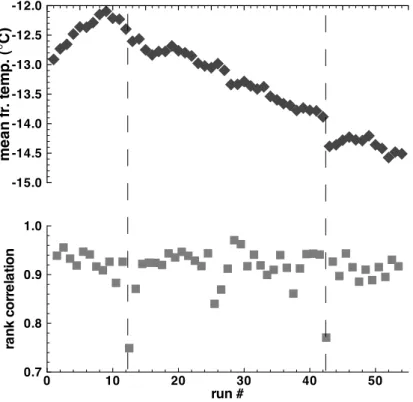
The main features of the observations with this sample are summarized in Fig. 5. The average freezing temperatures rose over the first 10 runs and then decreased until the end of the sequence. Overall variations are greater than those found with sample 15
A, even though run-to-run changes (ignoring the jump accompanying the overnight change after run #42) are comparable. The average of the absolute value of the changes is 0.083◦C which is in fact a bit smaller than the 0.096◦C value for sample A. The difference lies in the regularity of the changes for this sample versus the more erratic pattern for A. The rank correlation coefficients shown in the lower panel of Fig. 5 20
have low values at the overnight gaps (indicated by dashed lines). However, even these values have roughly 10−21probability to have been due to chance. The average, excluding the two overnight values, is 0.92.
The SN subset for sample B was selected for runs #19 to #42 and for 56 drops with
Tsn>−13.5◦C. The average rank correlation coefficient for this set is 0.93. The contour
25
plot of the frequency of run-to-run changes in freezing temperatures for this group of data is very much like that shown in Fig. 2a.
ACPD
8, 4059–4097, 2008 Repeatability and randomness in freezing nucleation G. Vali Title Page Abstract Introduction Conclusions References Tables Figures ◭ ◮ ◭ ◮ Back Close Full Screen / EscPrinter-friendly Version Interactive Discussion 5.0.3 Distilled water
In order to extend the range of temperatures of the tests, a sequence of runs was made with distilled water. This is the same water that was used to prepare the soil suspensions. It originated from a glass laboratory still of average quality and was kept in a large bottle for use over long periods of time. For the re-freeze experiments 78 5
drops were used and a total of 40 runs were made. There was an overnight break after run #10.
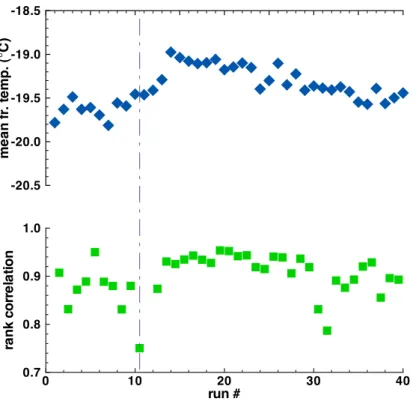
Freezing temperatures for this sample ranges from−10◦C to−24◦C with the majority of the events between−16◦C and −22◦C. During the 40 runs, the mean temperature drifted to higher values at first then gradually decreased, as shown in Fig. 6. The 10
absolute values of the changes averages 0.1◦C, not significantly different from what was found for the soil samples. Neither is the degree of repeatability between runs, as the mean rank correlation coefficient is 0.91 with a significance level of the order of 10−9. Table 2 shows the pdf of the δT -values for the entire sample and for the SN
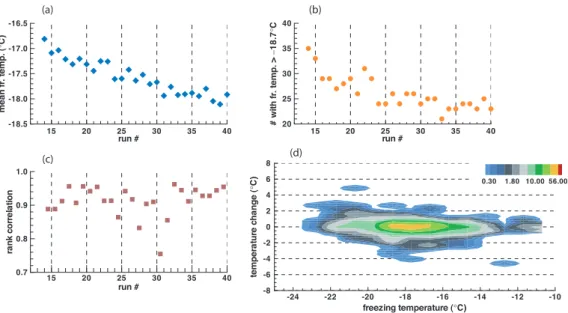
subset. The latter was defined for runs #14 to #40 to focus attention of the portion 15
of the sequence with steady changes. The cutoff temperature based on run #14 was
Tsn=−18.7◦C; the resulting sample size is 35 drops. Results for the SN subset are
shown in the lower line of Table 2 and in Fig. 7; these are quite similar to results obtained with the soil samples.
A rough comparison was also made between the results described above and those 20
for the 48 drops of distilled water included in the experiments with soil sample A. To avoid excessive detail, results from those runs are not included here. In general, no differences worth noting have been seen between the two sets of experiments.
6 Analysis and interpretation
The distinction between random and systematic changes in the data is not as easy to 25
ACPD
8, 4059–4097, 2008 Repeatability and randomness in freezing nucleation G. Vali Title Page Abstract Introduction Conclusions References Tables Figures ◭ ◮ ◭ ◮ Back Close Full Screen / EscPrinter-friendly Version Interactive Discussion the data that a fully random rearrangement of freezing temperatures among drops from
a given sample is incompatible with the observations. The contradiction with a stochas-tic description is clearly demonstrated by the contrast (described in Sect. 5.1) between the observed correlation of 0.98 versus the near zero value for randomized tempera-tures of the second of a pair of runs. In the same vein, the distribution ofδT -values has
5
been looked at for 100 re-randomizations of observed freezing temperatures (using run #26 of sample A). The results are listed in the third row of Table 1, and comparison of those numbers with other values in Table 1 clearly show that random variations of the freezing temperatures, even when restricted to the range actually observed, would lead to run-to-run changes much larger (up to 10 times for the central part of the distribution) 10
than observed.
The opposite assumption, the singular description, has convincingly strong support from the high values of the rank correlation coefficients and the infinitesimally small probabilities that those values arose by chance. The problem is that it is also clear that singularity is only valid to a first approximation. That additional factors need to 15
be considered is evident from a number of observational facts: (i) The individual his-tories of drops are quite varied, as shown in Fig. 4. (ii) The mean temperatures of the populations of drops for any given sample do not remain constant during the re-freezing sequences. (iii) The correlation coefficients (either in terms of temperatures or as ranks) are high but not equal to unity, and at times are significantly lower. The 20
combined effects of these facts are apparent when the pdf of δTij is examined in detail.
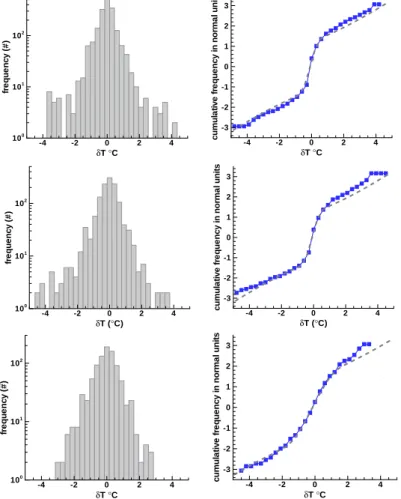
Fig. 8 shows these distributions for the SN subsets of the three samples discussed in Sect. 5. Pulling together all values in these plots is not unreasonable, since the depen-dence ofδT on T isn’t strong, as can be seen in Figs. 2a and 7d, although more will
be said about that later. 25
The left-hand panels in Fig. 8 are straightforward representations of the raw data. The main new finding is represented in the right-hand panels. Here the cumulative frequencies ofδT are plotted with the ordinate in normal units, i.e. as multiples of unity
ACPD
8, 4059–4097, 2008 Repeatability and randomness in freezing nucleation G. Vali Title Page Abstract Introduction Conclusions References Tables Figures ◭ ◮ ◭ ◮ Back Close Full Screen / EscPrinter-friendly Version Interactive Discussion The observed distributions (blue squares) do not follow that pattern but are strongly
S-shaped. That shape suggests that the data may be approximated by the weighted sum of two normal distributions. For Fig. 8a and b, the broken lines show the sum of two distributions, one with σ1=0.28◦C and w1=0.78 and the other with σ2=1.8◦C andw2=0.22. The corresponding values for Fig. 8c are σ1=0.6
◦
C,w1=0.86, σ2=1.8 ◦
C 5
and w2=0.14. All these were determined by trial and error and the fit was adjusted by eye. While the separation of the observed pdf into two components is a somewhat arbitrary step, the drop histories in Fig. 4 also suggest that they consist of relatively stable segments interrupted or terminated by more erratic-looking behavior.
Coupled with the basically singular character of freezing nucleation, the decomposi-10
tion of the observed frequency distributions parallels the suggestion from the individual drop histories that the changes in freezing temperatures can be thought of as being of two kinds: fluctuations” and “non-random alterations”. By fluctuations we refer to the relatively small changes which appear random and are then characterized appropri-ately by the narrower of the two normal distributions. Alterations are left to encompass 15
other changes that follow non-random patterns like the drifts, jumps, slow irregular vari-ations, etc. that are seen in the drop histories. That these variations are approximated by a second normal distribution is only a convenient description with no fundamental reason to follow that mathematical function. For some of these larger changes it is not possible to distinguish between alterations of a particular site or activity by another site 20
altogether. It is also apparent that these alterations can represent systematic trends over several runs, that is over hours.
In the terms of the definitions of the preceding paragraph, the model that emerges is that two additional factors have to be added to the singular description. The char-acteristic temperature of a nucleating site determines, at a given time and as a first 25
approximation, the temperature at which nucleation can be expected to occur on it. Randomness, associated with molecular dynamics, adds a fraction of a degree vari-ability. Thirdly, slow alterations, whose possible causes are to be discussed later, may lead to changes of up to several degrees and have to be considered a change in the
ACPD
8, 4059–4097, 2008 Repeatability and randomness in freezing nucleation G. Vali Title Page Abstract Introduction Conclusions References Tables Figures ◭ ◮ ◭ ◮ Back Close Full Screen / EscPrinter-friendly Version Interactive Discussion characteristic temperature itself. It is important to note that the third element of the
model is absent for the majority of cases; the values ofw2 quoted in the preceding paragraph suggest that it comes into play about a fifth of the time, but this will need further examination.
6.0.4 Nucleation rate 5
It appears clear that interpretation of the observations here presented in terms of the classical nucleation theory would require making a large number of assumptions to cover the range of freezing temperatures found for any given sample, and know-ing that the nuclei involved in these experiments are mixtures of many substances. Nonetheless, the evidence for randomness described above lead to some indica-10
tions about the form of the nucleation rate function. To do this, the first step is to accept the characterization of these fluctuations, captured with the value of σ1, as valid for individual nuclei or sites. In support of that association, it is relevant to men-tion that 50% of the sequences which haveδTij<0.6◦C are 13 runs long and that for |δTi j|<1.0◦C they are 26 runs long (for sample A). Visual inspection of the drop
his-15
tories (Fig. 4 and supplementary materialhttp://www.atmos-chem-phys-discuss.net/8/ 4059/2008/acpd-8-4059-2008-supplement.pdf) lends further support.
With the aforesaid caveat, the nucleation rate J is determined from the fraction of
drops freezing per temperature interval as indicated by the normal distribution width 0.71∗σ1. The factor 0.71 arises from the fact that σ1 represents the distribution of
20
changes, not of the deviations from the mean, and simple simulations indicate that the if one of these distributions is normal, so is the other and the ratio of standard devia-tions is 0.71. Two Gaussian distribudevia-tions of freezing frequency, for the soil suspension and for the distilled water samples, and nucleation rates corresponding to them are shown in Fig. 9. Nucleation rate is derived as (1/V *N)∗ (dN/dt), i.e. the fraction of
25
unfrozen drops freezing per unit time and per unit volume; the data in the figure were generated forV =0.01 cm3 and a cooling rate of 1◦C/min. The abscissa, ∆T , is a rela-tive scale centered on the characteristic temperature (Tc) of any particular nucleus or
ACPD
8, 4059–4097, 2008 Repeatability and randomness in freezing nucleation G. Vali Title Page Abstract Introduction Conclusions References Tables Figures ◭ ◮ ◭ ◮ Back Close Full Screen / EscPrinter-friendly Version Interactive Discussion site. Representing the nucleation rate in this manner, and not as a function of specific
temperatures for a specific substance as is usually done, is an important aspect of the composite model being put forward in this paper. Thus, it is not suitable for quantitative comparisons with classical nucleation theory, as is done in many publications. The information that can be gleaned from Fig. 9 is that the rate increases steeply within 5
about a degree of the characteristic temperature, a fact that underscores the useful-ness of the characteristic temperature for predicting activity. The rate increases by four orders of magnitude within a temperature interval of 1 to 2◦C. From the derivation used here, it follows that the characteristic temperatureTc is defined as the value at which nucleation is most likely to occur when temperature is lowered at the rate used in these 10
experiments, that is 1◦C min−1.
The rate functions in Fig. 9 are in general steeper than those reported by Seeley and Seidler (2001a, b) and by Zobrist et al. (2007) for alcohol monolayers, but magnitudes are in the same range. The main reasons for the difference in slope is that the rate in Fig. 9 is based on isolating one type of variation from the data while the references 15
cited use direct observations for a small number of droplets. Differences can also be expected due to the use of different nucleating substances in the experiments. Whether the flatter rate curve for distilled water in comparison with the soil sample is significant, or not, and what that difference might indicate will remain for further work to determine. Since the freezing temperatures of the distilled water sample were about 5◦C colder 20
than for the soil suspension, the opposite trend could have been expected from the smaller critical embryo size required.
The combined effects of the nucleus-specific characteristic temperature and the time-dependence that arises from the appreciable variations of the nucleation rate can be effectively seen in the results of experiments in which 20 re-freezing cycles 25
were carried out with cooling rates alternating between two different values: 0.7 and 4.0◦C min−1. Due to a mishap, data are available only for 11 drops but those drops had initial freezing temperatures ranging between−12◦C and−24◦C so that fairly def-inite results can be extracted from the data in spite of the small numbers of drops.
ACPD
8, 4059–4097, 2008 Repeatability and randomness in freezing nucleation G. Vali Title Page Abstract Introduction Conclusions References Tables Figures ◭ ◮ ◭ ◮ Back Close Full Screen / EscPrinter-friendly Version Interactive Discussion The findings of importance for the discussion here are that (i) the mean freezing
temperature at the higher cooling rate was 0.4◦C lower than in the slow runs, sim-ilarly to results in Vali and Stansbury (1966), and (ii) that the rank correlations be-tween runs of differing cooling rates was the same as bebe-tween runs of the same rate. These features are illustrated with the drop histories shown in Fig. 10. The 5
systematic temperature difference as well as the parallel variation between the two parts of the sequence are clearly evident. More details of the results are included with the Supplementary Materials (http://www.atmos-chem-phys-discuss.net/8/4059/2008/ acpd-8-4059-2008-supplement.pdf). These observations clearly support the singular-ity of freezing temperatures. The 0.4◦C shift associated with the roughly factor 6 in-10
crease in cooling rate is quite compatible with the variations in nucleation rate shown in Fig. 9. Since the quantitative estimate for the range over whichJ varies for a given
nu-cleus is one of the principal new results from this work, it is reassuring to have support for Fig. 9, even if it is only in the sense of consistency.
6.0.5 Alterations ofTc
15
The second, non-random, component of the overall variability in freezing temperatures over repeated trials with a given nucleus is termed “alterations”. There is a very large body of literature dealing with “pre-activation”, “de-activation” and with “memory effects” in heterogeneous ice nucleation3 (and in other phase changes); the word alterations encompasses those phenomena but is intended to be broader. Perhaps the principal 20
distinguishing feature of these changes from random fluctuations is that they appear to depend on the prior history of nucleation events undergone by the sample, for example whether an early part of a sequence is considered, or a later one.
Definition of the characteristic temperature Tc as the “value at which nucleation is
most likely to occur” was made anticipating the need to deal with these alterations 25
3
Comparisons of our observations with those reports would add too much to the length of this paper, so it will be left for another paper.
ACPD
8, 4059–4097, 2008 Repeatability and randomness in freezing nucleation G. Vali Title Page Abstract Introduction Conclusions References Tables Figures ◭ ◮ ◭ ◮ Back Close Full Screen / EscPrinter-friendly Version Interactive Discussion apart from the time-dependent effects associated with the nucleation rate. However,
that definition carries with it the broad general assumption that nucleation sites on a substrate are specific surface features either crystallographically, or in composition.
As indicated earlier, alterations are observed in about 15% of the re-freezing cy-cles and result in changes of freezing temperatures with a standard deviation of about 5
1.8◦C. These are rather large changes compared with what results from random fluctu-ations. The experiments provide only a diagnosis of these alterations and interpretation of what causes them can only be speculative at this point. The observations do pro-vide information, beyond the range of magnitudes, on the time scales and patterns of these changes. As a rough descriptive classification one can consider the follow-10
ing: a) drifts, or monotonic changes over time periods of tens of minutes to hours, b) short-term spikes, (either positive or negative): changes greater than one degree over one or two runs followed by a return to the original value, c) one-way jumps from one level to another, and d) meanderings, which are changes similarly random appearing but of greater magnitude than the fluctuations discussed in Sect. 6.1. This classifi-15
cation is not meant to be rigorous my any means, but only a basis for speculating about processes that may be responsible for them. Examples of these alterations, and combinations of them can be seen in Figs. 4 and 10, with further examples given in the Supplementary Materials (http://www.atmos-chem-phys-discuss.net/8/4059/2008/ acpd-8-4059-2008-supplement.pdf).
20
In qualitative terms, possible reasons for the positive changes (raising the freez-ing temperature) include retention of small ice clusters on the sites, imprintfreez-ing the ice configuration on the substrate, solution effects, or etching of the substrate surface. Negative changes may be caused by some stressing or partial destruction of sites, contamination by foreign matter, or the retention of some molecular clusters in less 25
than optimum configuration for ice embryo growth. Movement of the a nucleus from the interior of the drop to the air-water interface may also lead to changes, as reported by Shaw, Durant and Mi (2005) and Durant and Shaw (2005).
ACPD
8, 4059–4097, 2008 Repeatability and randomness in freezing nucleation G. Vali Title Page Abstract Introduction Conclusions References Tables Figures ◭ ◮ ◭ ◮ Back Close Full Screen / EscPrinter-friendly Version Interactive Discussion freezing temperatures in all of the tests. Perhaps surprisingly, a rise in the average was
found at the beginning of some sequences; very clearly in Fig. 5 and somewhat less clearly and actually not at the very beginning in Fig. 6. Since these changes, in either direction, represent gradual drifts for the large majority of drops, not large changes in a few, they are perhaps the most important. This adds an important constraint as to 5
which of the possible explanations listed in the preceding paragraph may be at work, but it is not clear which one. The same can be considered to apply to individual drops undergoing gradual drifts. At the other extreme, the larger jumps are more compatible with the possibility of total deactivation of one site and a change to activity by another of higher or lower Tc. Similarly, spikes could indicate a temporary loss of a site and 10
another becoming the determinant one.
The alterations here discussed were observed with nuclei that have been in suspen-sion for hours to days. Therefore, it remains to be determined what is the importance of these findings to atmospheric processes which are generally much faster. There are additional factors to consider in assessing relevance to atmospheric processes. The 15
composition of the nuclei in these experiments was not determined, however the soil samples do represent potential sources of atmospheric aerosols. Also, the samples contained undetermined amounts of dissolved substances, though the concentration of solutes was almost certainly below 0.1 molal, as judged from the onset of melting at 0◦C. Overall, on the one hand, one could argue that there is very little relevance of 20
these alterations to ice formation in clouds because of the differences in time scales. On the other hand, the alterations found in this work could indicate that faster and perhaps even larger changes may occur when particles are first immersed in water by condensation or capture; in that case the prediction of ice initiation in clouds becomes an even more difficult goal, either from the measurement or theoretical points of view. 25
These uncertainties in making the connection between the laboratory experiment and cloud processes could be narrowed considerably by performing further experiments with nuclei of known composition and size, and with water containing different solutes.
ACPD
8, 4059–4097, 2008 Repeatability and randomness in freezing nucleation G. Vali Title Page Abstract Introduction Conclusions References Tables Figures ◭ ◮ ◭ ◮ Back Close Full Screen / EscPrinter-friendly Version Interactive Discussion 6.0.6 Comparisons with other results
As mentioned in the introduction, many previous studies overlap with the topic of this paper. Here, only a few specific parallels and divergences will be highlighted. All of these experiments involved subjecting samples to repeated freezing cycles.
The extensive data set of Dorsey (1938, 1948) contains many identical features to 5
our data. From his first observations, he concluded that “ ... the extent of supercooling of a given specimen of distilled water at a given time is fixed within moderately narrow limits, (and) varies from specimen to specimen...”. These conclusions were later ex-tended to samples with various types of nuclei. The samples were 6...8 cm3in volume and were contained in carefully cleaned and sealed glass bulbs. Tests were made both 10
on the scale of hours (1948, Table 3), and at intervals of many months. The sequences of freezing temperatures reported for individual samples show relatively constant seg-ments, and the kinds of alterations discussed in Sect. 6.2. Much of Dorsey’s concern was centered on these alterations and possible reasons for them, including dilution, mixing of two samples, heating, and so on. In addition to the conclusion cited above, 15
he found that each sample had several preferred temperatures of freezing. No effect of prolonged chilling was detected. Random effects were not considered.
Bayardelle (1954) reported observing both slow variations and rapid fluctuations be-tween cycles with water drops suspended at a mercury-silicon oil interface and con-cluded that the stochastic theory was incompatible with the results. Carte (1956) too 20
found that freezing temperatures may stay constant over hundreds of repetitions but that slow drifts occurred in a small fraction of cases. Alternate cooling rates were ac-companied by a 0.5◦C difference, much like the findings in this work.
Vonnegut and Baldwin (1984) conducted tests by exposing a silver iodide suspen-sion many hundreds of times to the same temperature and recording the length of time 25
until freezing occurred. The average time to freezing decreased from a few seconds at −9◦C to near 3 h at −3◦C, and at any given temperature the lapse of time had a negative exponential distribution. Some systematic changes were also observed and
ACPD
8, 4059–4097, 2008 Repeatability and randomness in freezing nucleation G. Vali Title Page Abstract Introduction Conclusions References Tables Figures ◭ ◮ ◭ ◮ Back Close Full Screen / EscPrinter-friendly Version Interactive Discussion associated with possible surface changes of the silver iodide due to mechanical
ef-fects of freezing. The authors equate the results of many tests with one sample to what would be expected for a large number of identical samples in a single test. That assumption is valid for truly identical samples, but it may not hold for macroscopically similar samples if the most active sites differ, which is actually likely for sites that have 5
a low probability of being found in a sample. As shown by Vali (1994) the results are consistent with the pdf of expected times needed for nucleation at a temperature where the nucleation rate is low, i.e. above the characteristic temperature of the most active particle, or site, in the particular suspension that was tested. The finding of at least one period of different behavior for the sequence for which detailed data are presented 10
in the paper also supports that interpretation by indicating the importance of specific sites. The diminution of lapse times for colder temperatures indicates a 104increase in nucleation rate for 6◦C lower temperature.
In the work of Zobrist et al. (2007; Z07), individual drops were subjected to re-freezing cycles with cooling rates of 10◦C min−1. A drop of comparable size to those 15
used in our experiments and without the alcohol monolayer coating is shown to have frozen near −20◦C with very little variations in close to 100 cycles of freezing and melting. There are 3 points in this sequence with slightly larger deviations from the general pattern, and a small shift can be seen after about run 13 (their Fig. 1). For the drops of the same size coated with nonadecanol freezing temperatures vary several 20
degrees from cycle to cycle, while those of near 40 mm show less variation. For the smaller drops, some non-random patterns can also be discerned in their Fig. 1. The nucleation rate derived from the data for this drop (their Fig. 2) has a slope of about factor 10 per degree, a value quite close to that shown in Fig. 9 for distilled water near
Tc. Whether their data would support the overall shape of the rate curve in Fig. 9, or 25
not, can’t be judged reliably from the published material. The spread of freezing tem-peratures for drops with the nonadecanol monolayer is also evaluated in Z07 in terms of the stochastic model. The nucleation rate curve derived for the larger drops shows weaker temperature dependence than that for the uncoated drop and the values
de-ACPD
8, 4059–4097, 2008 Repeatability and randomness in freezing nucleation G. Vali Title Page Abstract Introduction Conclusions References Tables Figures ◭ ◮ ◭ ◮ Back Close Full Screen / EscPrinter-friendly Version Interactive Discussion rived from our data. Mean freezing temperatures of the smaller drops were about 12◦C
lower and nucleation rates calculated for those indicated that the contact angle was temperature-dependent. These observations are compatible with our data, though the use of different materials and the small number of drops in the Z07 data, make strict comparisons impossible. The main difference is the importance attached to stochas-5
tic effects. While Z07 consider their results to be defining the nucleation activity of nonadecanol as a substance, the model here proposed would attach importance to the range of possible site configurations, characterized by theirTc-values. It is possible that that idea doesn’t apply to nuclei formed by alcohol monolayers, but it is also possible that further work with that system would reveal the validity of the concept. One minor 10
discrepancy is that Z07 consider it unimportant whether observations are made with steady cooling or at fixed temperatures. That statement, for heterogeneous nucleation, is contradicted by results given in Vali (1966, 1994).
Marcolli et al. (2007; M07), working with suspensions of Arizona Test Dust in a dif-ferential scanning calorimeter, found good agreement with the singular model. Their 15
observations were well approximated by assuming that the probability of occurrence of an active site per unit surface area is an exponentially increasing function of contact angle. Contact angle is used as a surrogate for activity at various temperatures, and parallels the role of characteristic temperatureTc; the probability function they assumed
fills the same role as the nucleus spectrum shown in Fig. 1c which has an empirical 20
basis.
7 Summary
Experiments were described in which roughly 100 drops were subjected to simultane-ous cycles of freezing and melting. The drops contained suspended foreign matter and had nucleation temperatures between−6◦C and−24◦C. Cycle times were of the order 25
15...20 min and also included some gaps of about 15 h.
ACPD
8, 4059–4097, 2008 Repeatability and randomness in freezing nucleation G. Vali Title Page Abstract Introduction Conclusions References Tables Figures ◭ ◮ ◭ ◮ Back Close Full Screen / EscPrinter-friendly Version Interactive Discussion variations of nucleation temperatures that are inherent in the nucleation process and
more systematic alterations of the nuclei that accompany a minority of the events. Both of those effects are superimposed on the characteristic nucleation temperature, Tc, that
is specific to each particular nucleus, or site. Thus, the results provide confirmation and extension of the modified singular description of heterogeneous freezing nucleation 5
(Dorsey, 1948; Vali and Stansbury, 1966; Vali, 1994) and delineate the extent to which randomness due to molecular fluctuations modify that model.
Random variations in nucleation temperatures (for the cooling rate applied) were found to be characterized by standard deviations of 0.2◦C for the soil samples and 0.42◦C for the distilled water sample. These deviations fromTc were seen in roughly 10
85% of the cases. No clear variation of the width of the distributions with temperature could be detected for either sample over ranges of about 8◦C. It remains to be estab-lished by further work whether the type of nuclei (composition, etc.) lead to system-atically different widths; comparisons with Seeley and Seidler (2001a, b) and Zobrist et al. (2007) suggest that that may be the case. Nucleation rates were derived as 15
functions of the temperature deviation ∆T from Tc, as shown in Fig. 9.
The third component observed to affect nucleation temperatures in these experi-ments was termed “alterations” as they appear to depend on the prior history of the drops, have rather specific variants and have systematic components. These alter-ations provide some hints about processes influencing the activity of nuclei and they 20
are of importance in interpreting experiments involving repeated freezing of samples. Based on these results, models of ice initiation in clouds via immersion freezing can be considered at three levels. First, predictions should be based on a pdf of the
Tc-values and the distribution of the nuclei in cloud droplets by condensation or by
capture. For cloud volumes cooling at rates from, say, a tenth to the full adiabatic rate 25
that is going to be an adequate predictor, certainly well within the accuracies with which those pdf can be determined either by direct measurement or by some generalized formula. The acquisition of sufficient empirical data to reliably define these pdf remains the main challenge. Second, for slower rates of cooling, or for constant temperatures,
ACPD
8, 4059–4097, 2008 Repeatability and randomness in freezing nucleation G. Vali Title Page Abstract Introduction Conclusions References Tables Figures ◭ ◮ ◭ ◮ Back Close Full Screen / EscPrinter-friendly Version Interactive Discussion the nucleation rate for given Tc needs to be considered: rates roughly like those in
Fig. 9 provide a usable approximation until the dependence of the rate curve on particle composition is better known. Third, the systematic, though unpredictable, alterations here reported need not be a concern for cloud models, except for special cases where cycling of drops through freezing and melting is expected.
5
Acknowledgements. Partial support for this work was derived from grant ATM-0650609 from the U.S. National Science Foundation, Physical and Dynamic Meteorology Program.
References
Bayardelle, M.: Sur le mecanisme de la congelation de l’eau dans les nuages, Compt. Rend. Acad. Sci., 239(16), 988–989, 1954.
10
Bigg, E. K.: The supercooling of water, Proc. Phys. Soc., 66, 688–694, 1953. Carte, A. E.: Probability of freezing, Proc. Phys. Soc., 73, 324, 1959.
Carte, A. E.: The freezing of water droplets. Proc. Phys. Soc., 69(10), 1028–1037, 1956. Diehl, K. and Wurzler, S.: Heterogeneous drop freezing in the immersion mode: Model
cal-culations considering soluble and insoluble particles in the drops, J. Atmos. Sci., 61(16),
15
2063–2072, 2004.
Dorsey, N. E.: Supercooling and freezing of water, J. Res. Natl. Bureau Standards, 20(6), 799–808, 1938.
Dorsey, N. E.: The freezing of supercooled water. Trans. Amer. Phil. Soc., 38, 248–328, 1948. Dufour, L. and Defay, R.: Thermodynamics of clouds. Academic Press, New York, 255 p., 1963.
20
Durant, A. J. and Shaw, R. A.: Evaporation freezing by contact nucleation inside-out, Geophys. Res. Lett., 32, L20814, doi:10.1029/2005GL024175, 2005.
Fletcher, N. H.: The Chemical Physics of Ice, University Press, Cambridge., 271 pp., 1970. K ¨archer, B. and Lohmann, U.: A parameterization of cirrus cloud formation: Heterogeneous
freezing, J. Geophys. Res.-Atmos., 108(D14), 4402, doi:10.1029/2002JD003220, 2003.
25
Khvorostyanov, V. I. and Curry, J. A.: The theory of ice nucleation by heterogeneous freezing of deliquescent mixed CCN. Part II: Parcel model simulation, J. Atmos. Sci., 62, 261–285, 2005.
ACPD
8, 4059–4097, 2008 Repeatability and randomness in freezing nucleation G. Vali Title Page Abstract Introduction Conclusions References Tables Figures ◭ ◮ ◭ ◮ Back Close Full Screen / EscPrinter-friendly Version Interactive Discussion
Langham, E. J. and Mason, B. J.: The heterogeneous and homogeneous nucleation of super-cooled water, Proc. Roy. Soc. A., 247 493–505, 1958.
Levin, J.: Statistical explanation of spontaneous freezing of water droplet, Natl. Adv. Comm. Aeronautics, Techn. Note, 2234, 27 pp., 1950.
Liu, X. H. and Penner, J. E.: Ice nucleation parameterization for global models, Meteorol.
5
Zeitsch., 14(4), 499–514, 2005.
Marcolli, C., Gedamke, S., Peter, T., and Zobrist, B.: Efficiency of immersion mode ice nucle-ation on surrogates of mineral dust, Atmos. Chem. Phys., 7(19), 5081–5091, 2007.
Morrison, H., Shupe, M. D., Pinto, J. O., and Curry, J. A.: Possible roles of ice nucleation mode and ice nuclei depletion in the extended lifetime of Arctic mixed-phase clouds, Geophys. Res.
10
Lett., 32(18), L18801, doi:10.1029/2005GL023614, 2005.
Prenni, A. J., DeMott, P. J., Twohy, C., et al.: Examinations of ice formation processes in Florida cumuli using ice nuclei measurements of anvil ice crystal particle residues, J. Geophys. Res.-Atmos., 112(D10), D10221, doi: 10.1029/2006JD007549, 2007.
Pruppacher, H. R. and Klett, J. D.: Microphysics of Clouds and Precipitation, Kluwer Academic
15
Publishers, Dordrecht, Boston, London, 954 pp., 1997
Seeley, L. H. and Seidler, G. T.: Preactivation in the nucleation of ice by Langmuir films of aliphatic alcohols, J. Chem. Phys., 114(23), 10 464–10 470, 2001a.
Seeley, L. H. and Seidler, G. T.: Two-dimensional nucleation of ice from supercooled water, Phys. Rev. Lett., 87(5), 055702, 2001b.
20
Shaw, R. A., Durant, A. J., and Mi, Y.: Heterogeneous surface crystallization observed in un-dercooled water, J. Phys. Chem. B, 109, 9865–9868, 2005.
Vali, G.: Freezing rate due to heterogeneous nucleation, J. Atmos. Sci., 51(13), 1843–1856, 1994.
Vali, G. and Stansbury, E. J.: Time dependent characteristics of the heterogeneous nucleation
25
of ice, Can. J. Phys., 44 477–502, 1966.
Volmer, M.: Kinetic der Phasenbildung, Steinkopf, Leipzig, Leipzig, 325 pp., 1939.
Vonnegut, B. and Baldwin, M.: Repeated nucleation of a supercooled water sample that con-tains silver iodide particles, J. Appl. Meteor., 23, 486–490, 1984.
Zobrist, B., Koop, T., Luo, B. P., Marcolli, C., and Peter, T.: Heterogeneous ice nucleation rate
30
coefficient of water droplets coated by a nonadecanol monolayer, J. Phys. Chem. C., 111(5), 2149–2155, 2007.
ACPD
8, 4059–4097, 2008 Repeatability and randomness in freezing nucleation G. Vali Title Page Abstract Introduction Conclusions References Tables Figures ◭ ◮ ◭ ◮ Back Close Full Screen / EscPrinter-friendly Version Interactive Discussion
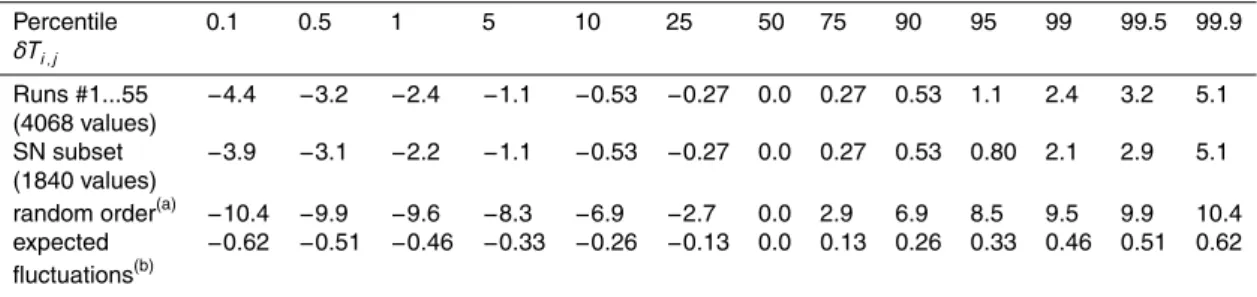
Table 1. Distribution of run-to-run temparature changes,δTi ,j(◦C) for soil sample A.
Percentile 0.1 0.5 1 5 10 25 50 75 90 95 99 99.5 99.9 δTi ,j Runs #1...55 −4.4 −3.2 −2.4 −1.1 −0.53 −0.27 0.0 0.27 0.53 1.1 2.4 3.2 5.1 (4068 values) SN subset −3.9 −3.1 −2.2 −1.1 −0.53 −0.27 0.0 0.27 0.53 0.80 2.1 2.9 5.1 (1840 values)
random order(a) −10.4 −9.9 −9.6 −8.3 −6.9 −2.7 0.0 2.9 6.9 8.5 9.5 9.9 10.4 expected −0.62 −0.51 −0.46 −0.33 −0.26 −0.13 0.0 0.13 0.26 0.33 0.46 0.51 0.62 fluctuations(b)
(a)
see Sect. 6 for a description.
(b)
ACPD
8, 4059–4097, 2008 Repeatability and randomness in freezing nucleation G. Vali Title Page Abstract Introduction Conclusions References Tables Figures ◭ ◮ ◭ ◮ Back Close Full Screen / EscPrinter-friendly Version Interactive Discussion
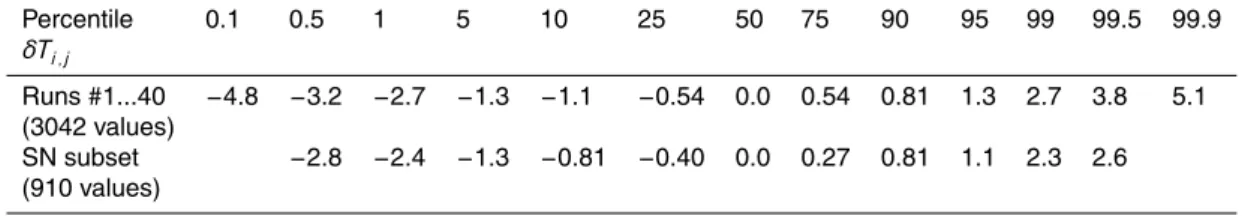
Table 2. Distribution of run-to-run temparature changes,δTi ,j(◦C) for distilled water.
Percentile 0.1 0.5 1 5 10 25 50 75 90 95 99 99.5 99.9 δTi ,j Runs #1...40 −4.8 −3.2 −2.7 −1.3 −1.1 −0.54 0.0 0.54 0.81 1.3 2.7 3.8 5.1 (3042 values) SN subset −2.8 −2.4 −1.3 −0.81 −0.40 0.0 0.27 0.81 1.1 2.3 2.6 (910 values)
ACPD
8, 4059–4097, 2008 Repeatability and randomness in freezing nucleation G. Vali Title Page Abstract Introduction Conclusions References Tables Figures ◭ ◮ ◭ ◮ Back Close Full Screen / EscPrinter-friendly Version Interactive Discussion run # m ean fr . tem p . ( ° C) 0 10 20 30 40 50 60 -15.0 -14.5 -14.0 -13.5 -13.0 temperature (°C) n u m b er fr eez in g p er 0 .5 ° Ci n te rv a l -20 -18 -16 -14 -12 -10 -8 -6 0 5 10 15 temperature (°C) cu m u la ti ve co n c e n tr a ti o n (cm -3) -20 -18 -16 -14 -12 -10 -8 -6 100 101 102 103 first run 55
Fig. 1. (a) Average of freezing temperatures for sequence of 55 runs with soil sample A. (b) Histogram of numbers of drops of freezing as a function of temperature in the first and last runs of the sequence. (c) Cumulative spectra expressing the volume concentration of nuclei which caused freezing above the indicated temperatures.
ACPD
8, 4059–4097, 2008 Repeatability and randomness in freezing nucleation G. Vali Title Page Abstract Introduction Conclusions References Tables Figures ◭ ◮ ◭ ◮ Back Close Full Screen / EscPrinter-friendly Version Interactive Discussion freezing temperature (°C) te m p e ra tur e c ha nge ( ° C) -20 -18 -16 -14 -12 -10 -8 -6 -8 -6 -4 -2 0 2 4 6 8 0.3 2.1 15.0 105.0 run # ra n k c o rre la ti o n 0 10 20 30 40 50 60 0.8 0.9 1.0
Fig. 2. (a) Contour plot of the number of observed change in temperatures from one run to the next for drops freezing at temperatures indicated on the abscissa for soil sample A. (b) Rank correlation coefficient of freezing temperatures in successive runs.
ACPD
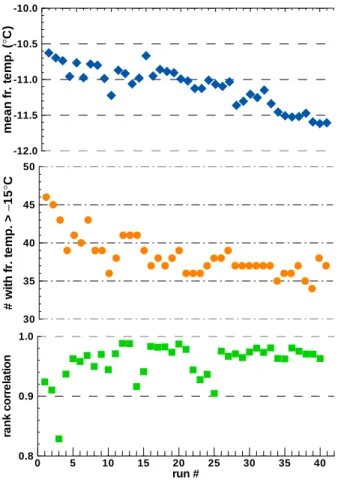
8, 4059–4097, 2008 Repeatability and randomness in freezing nucleation G. Vali Title Page Abstract Introduction Conclusions References Tables Figures ◭ ◮ ◭ ◮ Back Close Full Screen / EscPrinter-friendly Version Interactive Discussion m ean fr . tem p . ( ° C) -12.0 -11.5 -11.0 -10.5 -10.0 #w it h fr . te m p . > − 15 ° C 30 35 40 45 50 run # ra n k c o rre la ti o n 0 5 10 15 20 25 30 35 40 0.8 0.9 1.0
Fig. 3. Data for the SN subset (see text for definition) of soil sample A. (top) Average freezing temperature. (middle) Number of drops freezing above threshold temperature. (bottom) Rank correlation coefficients.