Publisher’s version / Version de l'éditeur:
Proceedings of the 16th IAHR International Symposium on Ice, pp. 203-210, 2002-12-02
READ THESE TERMS AND CONDITIONS CAREFULLY BEFORE USING THIS WEBSITE. https://nrc-publications.canada.ca/eng/copyright
Vous avez des questions? Nous pouvons vous aider. Pour communiquer directement avec un auteur, consultez la
première page de la revue dans laquelle son article a été publié afin de trouver ses coordonnées. Si vous n’arrivez pas à les repérer, communiquez avec nous à PublicationsArchive-ArchivesPublications@nrc-cnrc.gc.ca.
Questions? Contact the NRC Publications Archive team at
PublicationsArchive-ArchivesPublications@nrc-cnrc.gc.ca. If you wish to email the authors directly, please see the first page of the publication for their contact information.
NRC Publications Archive
Archives des publications du CNRC
This publication could be one of several versions: author’s original, accepted manuscript or the publisher’s version. / La version de cette publication peut être l’une des suivantes : la version prépublication de l’auteur, la version acceptée du manuscrit ou la version de l’éditeur.
Access and use of this website and the material on it are subject to the Terms and Conditions set forth at
Ice strength information in the Canadian Arctic : From science to operations
Gauthier, M.-F.; De Abreu, R.; Timco, G. W.; Johnston, M. E.
https://publications-cnrc.canada.ca/fra/droits
L’accès à ce site Web et l’utilisation de son contenu sont assujettis aux conditions présentées dans le site LISEZ CES CONDITIONS ATTENTIVEMENT AVANT D’UTILISER CE SITE WEB.
NRC Publications Record / Notice d'Archives des publications de CNRC:
https://nrc-publications.canada.ca/eng/view/object/?id=a531982f-82d7-45e6-bb65-7a2ba8c33fdd https://publications-cnrc.canada.ca/fra/voir/objet/?id=a531982f-82d7-45e6-bb65-7a2ba8c33fdd
Ice in the Environment: Proceedings of the 16th IAHR International Symposium on Ice Dunedin, New Zealand, 2nd–6th December 2002
International Association of Hydraulic Engineering and Research
ICE STRENGTH INFORMATION IN THE CANADIAN ARCTIC:
FROM SCIENCE TO OPERATIONS
M-F. Gauthier1, R. De Abreu 1, G. W. Timco2 and M. E. Johnston2
ABSTRACT
The Canadian Ice Service (CIS) promotes safe and efficient maritime operations and helps protect Canada's environment by providing reliable and timely information about sea ice, lake ice and iceberg conditions in Canadian waters. New initiatives at the CIS have highlighted the need for improved information regarding the seasonal decay of sea ice. Specifically, CIS requires reliable, efficient techniques whereby the seasonal decrease in first year ice strength can be monitored and reported regularly.
In the past few years, considerable work has been done to categorize and characterize the decay process of Arctic first year ice and to develop ways of estimating its spring and summer strength. This paper will report on the development of a prototype ice strength product provided by the CIS to the Canadian Arctic marine community in the spring of 2002. The theoretical basis for the product, the implementation at the CIS and its utilization by mariners will be discussed.
INTRODUCTION
Navigation in the Canadian waters north of 60N latitude is regulated by the Arctic Shipping Pollution Prevention Regulations (ASPPR). In 1996, Transport Canada extensively revised the ASPPR giving way to the creation of the Arctic Ice Regime Shipping System (AIRSS). AIRSS is based on a simple calculation that produces an “Ice Numeral”. The Ice Numeral is calculated using information about the ice and the vessel’s ability to navigate safely in that region. The value of the Ice Numeral takes into account the decay of the ice but the current CIS suite of products does not include any strength or melt-related information. Over the past few years, the Canadian Ice Service and partners have been characterizing the process of first year sea ice decay and developing techniques whereby it can be monitored and reported. DeAbreu and al. (2001) concentrated primarily on remote sensing data to report on the stages of melt of the ice. The theory behind this approach was that the weakening of the sea ice volume is accompanied by concurrent changes in the surface
1
Canadian Ice Service, Meteorological Service of Canada, Environment Canada, Ottawa, Ont., Canada 2
condition of first year sea ice. These changes in the surface layer lend a distinct seasonality to remote sensing signatures. As a result, RADARSAT and NOAA AVHRR image data could be used to identify the stages of ice melt, which could then be used by navigators to estimate the strength of ice. However, there were obstacles identified with this approach: time and resources needed to monitor the change in remote sensing signatures were not available and the image coverage was not systematic. An alternative method to automatically provide ice strength information consistently over large regions thus was needed.
ICE STRENGTH INDEX
In fall 2001, forecasters, analysts and scientists of the CIS met with members of the Canadian Hydraulics Centre, National Research Council of Canada to discuss a new approach for predicting and reporting ice strength information in a more automated manner. The following describes the Ice Strength Index.
In the spring of 2000 and 2001, in situ measurements of confined compressive ice strength were conducted in fast, smooth (i.e. undeformed) first year ice within the Canadian Arctic Archipelago using a borehole jack. The results provided the first observations of the spring/summer reduction of the strength of first year sea ice (Johnston and Frederking, 2001; Johnston et al., 2002). Analyses showed that the seasonal reduction in winter ice strength was accompanied by a steady increase in measured air temperatures. This correspondence is expected given the understood established relationship between ice temperature, brine volume, and ice strength. The apparent relationship between ice strength and air temperature was attractive from an operational standpoint. Air temperature can be modelled and observed systematically within CIS regions, thus creating the possibility of estimating ice strength on a regular basis over these areas. The Canadian Meteorological Centre’s (CMC) GEM global weather model estimates surface air temperature (10 m height) at a 1 degree spatial resolution. Information from surface observations (e.g. weather station, marine observations) is integrated with model forecasts to produce an analysis field every 12 hours. The 2000 and 2001 GEM air temperature data corresponding to the field sampling area and period were extracted and compared to the measured ice strength data. Good agreement was found between an accumulated measure of air temperature, or accumulated warming degree day (AWDD) and the first year ice strength. Specifically, the daily departure of the daily average GEM temperature (i.e. 0 and
12 GMT fields) (Tmean) from a baseline of –30 ºC (Tcutoff) was accumulated starting on April
1 using
(
)
∑
−= Tmean Tcutoff
AWDD (1)
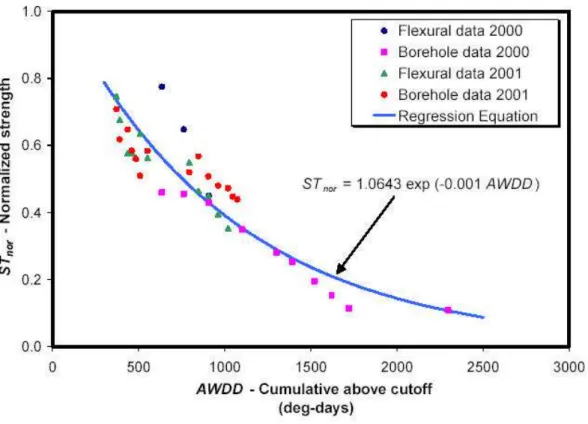
Accumulated warming degree-days were compared to the observed and calculated ice strengths (Figure 1). The borehole strength measurements represent an average of the sampled strengths at 0.3 and 0.9 m depths. The flexural strength was based on an empirical equation developed by Timco and O’Brien (1994). The borehole and flexural strength values were normalized against estimated mid-winter ice strength using values of 25.5 MPa and 0.71 MPa respectively (see Timco and Johnston, 2002, this volume). The data reflect the seasonal trend of decreasing ice strength. The following exponential model was fit to
(
AWDD)
STN =1.0643exp −0.001 (2)
where STN is the normalized mid-winter ice strength (0-100%). Again, the strong
relationship with air temperature is logical given the dependence of sea ice strength on ice temperature (in fact brine volume). We consider this parameterization preliminary, in need of further data and validation. For example, the final data point exerts significant influence on the proposed function. Further measurements will be made during this period to clarify the late spring, summer trend. Of specific interest is the validity of this function over other first year ice regimes in the Arctic. The proposed function is dependent on the relationship between air temperature and internal ice temperature and is modulated by snow cover. The sensitivity of the function to varying snow depths and ice thickness will be investigated.
Figure 1. Normalized winter first year ice strength vs. accumulated warming degree-days.
ICE STRENGTH CHART DEFINITION
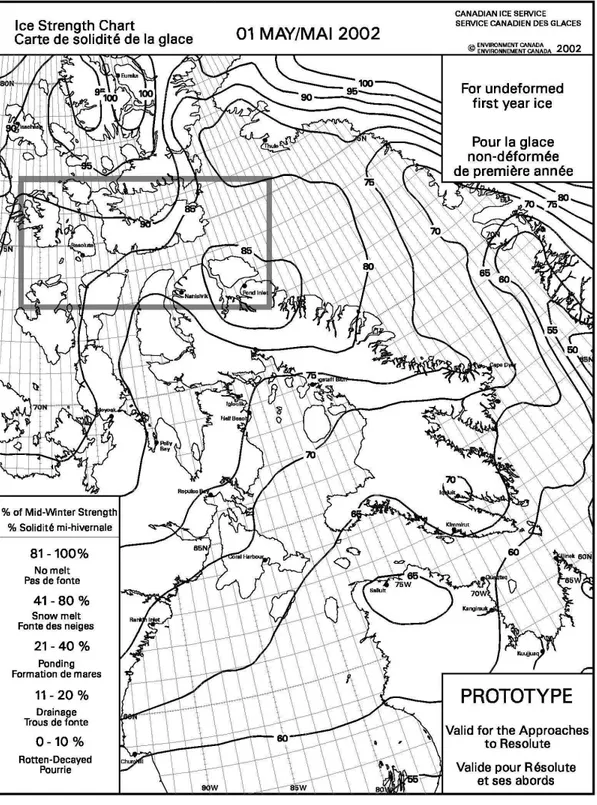
The CIS has developed a prototype new product describing the seasonal decrease in the strength of first year sea ice using the index described above. Figure 2 shows the first product that was created and disseminated at the beginning of May 2002. The Ice Strength Chart displays ice strength indices (current strength relative to a mid-winter strength in percentage) for level first year ice as isostrength lines: lines of constant ice strength index value. It also reports on ice surface conditions by superimposing the stages of melt to the range of indices. This Ice Strength prototype chart was designed to be used in conjunction with the CIS Arctic Regional Charts and is valid for the Approaches to Resolute area (area within the box on Figure 2). This new product was provided to the Canadian Arctic marine community in the spring and summer of 2002.
Figure 2. May 01st 2002 Ice Strength Chart
IMPLEMENTATION PLAN
As indicated above, the Ice Strength Chart was developed as a companion product to the CIS Arctic Regional charts and therefore followed the same production schedule: beginning
of May, mid-May, beginning of June then weekly until the beginning of August. Establishing an operational production schedule for this new product is only one element of the CIS implementation plan.
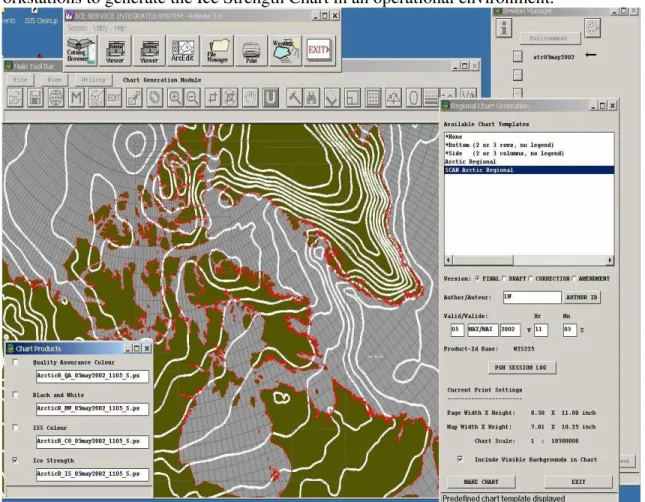
Ice forecasters and ice analysts are using ISIS (Ice Service Integration System) workstations equipped with GIS (Geographical Information System) applications such as ERDAS and ARCINFO to generate and disseminate their products. In order to support the production of the Ice Strength Chart, the Ice Forecasting and Informatic Divisions of the CIS have worked together in allocating new identifications for this product and in setting up operational procedures compatible with current CIS work flow for its generation. Figure 3 illustrates some of the steps undertaken by ice forecasters and ice analysts at their workstations to generate the Ice Strength Chart in an operational environment.
Figure 3. Ice Strength model results display and chart
Another aspect of the CIS implementation plan is training. Ice forecasters and ice analysts have attended a half a day training session on Ice Decay including a one-hour lecture explaining the theory behind the Ice Strength Index. A similar lecture was given to the Ice Service Specialists (ISS), CIS personnel deployed on board icebreakers.
VALIDATION PLAN
Developing and implementing a new product requires a validation plan. The CIS, in partnership with the Canadian Coast Guard, Transport Canada, the National Research
Council and various commercial shipping companies have co-developed a validation program for its new prototype Ice Strength Chart.
Staff from the Canadian Ice Service participated in three validation field exercises. The first took place in Lancaster Sound and Barrow Strait, which is the main validation area (area within the box on Figure 1). This field exercise, part of a larger sea ice experiment C-ICE 2002, was composed of three airborne sampling trips and one ship-based trip timed to coincide with the following seasonal stages of melt: winter/spring – early May, snow melt – early June, ponding – late June and drainage – mid July. At each regional sampling site, ice strength measurements were again taken with a borehole jack. The strength values will be compared to those estimated by the relevant CIS Ice Strength Chart.
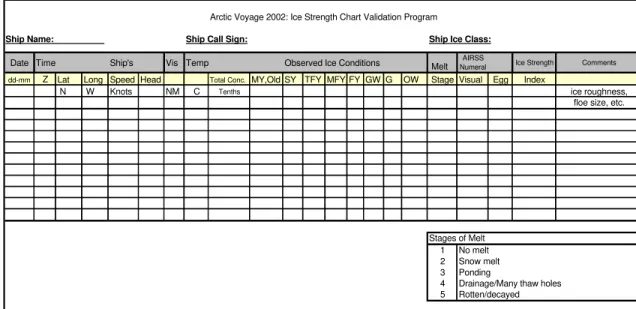
During the second field validation exercise, an ice forecaster embarked on board the Fednav ship M.V. Arctic to validate the Ice Strength Chart outside the main validation area. The purpose of this validation was to see if values of the strength of undeformed first year ice relative to peak winter strength (0-100%) developed from data obtained in level first year sea ice over the Approaches to Resolute area, could be extrapolated to other areas of the Arctic, where first year ice is deformed and under pressure. There were no strength measurements taken during this exercise. Ice strength was referenced to observations from the ship and compared with the Ice Strength Chart. To assist in the validation, a form has been developed. A sample of the form is illustrated in figure 4.
Arctic Voyage 2002: Ice Strength Chart Validation Program
Ship Name: Ship Call Sign: Ship Ice Class:
Date Time Ship's Vis Temp Observed Ice Conditions Melt NumeralAIRSS Ice Strength Comments
dd-mm Z Lat Long Speed Head Total Conc. MY,Old SY TFY MFY FY GW G OW Stage Visual Egg Index
N W Knots NM C Tenths ice roughness,
floe size, etc.
Stages of Melt 1 No melt 2 Snow melt 3 Ponding
4 Drainage/Many thaw holes 5 Rotten/decayed
Figure 4. Commercial ship validation form
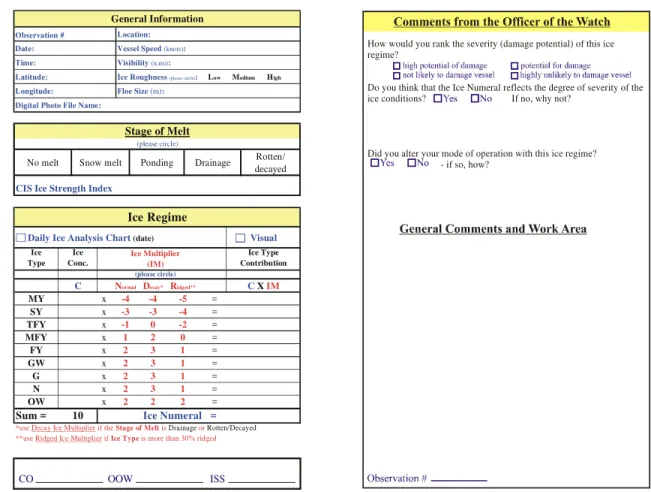
The third exercise required the participation of the ISS working on board six Canadian Coast Guard icebreakers. As the ships were deployed in July, the ISS reported ice conditions and ice strength (inferred from the Ice Strength Chart) and AIRSS information in a field book for each ice regime encountered while navigating in the Arctic. Figure 5 shows a sample of the Arctic 2002 field book; elements of the field book are similar to the ones displayed on the validation forms. The data collected by the ISS will provide
information on both stages of decay and the ice regimes encountered by the vessels. Digital cameras were also supplied to the ISS to photograph the detailed ice conditions. This data collection exercise will provide invaluable ground-truthing of the CIS Ice Strength charts.
How would you rank the severity (damage potential) of this ice regime?
Do you think that the Ice Numeral reflects the degree of severity of the ice conditions? If no, why not?
Did you alter your mode of operation with this ice regime? - if so, how?
CO OOW ISS
Observation # Location:
Date: Vessel Speed(knots):
Time: Visibility(n.mi):
Latitude: Ice Roughness(please circle): Low Medium High
Longitude: Floe Size(m):
Digital Photo File Name:
General Information
No melt Snow melt Ponding Drainage Rotten/
decayed
CIS Ice Strength Index
Stage of Melt (please circle)
Daily Ice Analysis Chart(date) Visual Ice Type Ice Conc. Ice Type Contribution
C Normal Decay* Ridged** CXIM
MY x -4 -4 -5 = SY x -3 -3 -4 = TFY x -1 0 -2 = MFY x 1 2 0 = FY x 2 3 1 = GW x 2 3 1 = G x 2 3 1 = N x 2 3 1 = OW x 2 2 2 =
Sum = 10 Ice Numeral =
*use Decay Ice Multiplier if the Stage of Melt isDrainageorRotten/Decayed
**use Ridged Ice Multiplier if Ice Type is more than 30% ridged
Ice Regime
Ice Multiplier (IM) (please circle)
Figure 5. Ice Service Specialist validation book
CONCLUSION
This paper has provided details on an ambitious program developed by the Canadian Ice Service and Canadian Hydraulics Centre to develop a product that will provide timely and accurate information on the strength of the ice in Canada’s Arctic. A considerable amount of research and background development has taken place in support of this product. The work described in this paper will be used to validate and improve it. At the present time, the Canadian Ice Service supplies timely and accurate information in Canada’s Arctic regions that includes ice type, ice concentration and ice thickness. This new product will provide timely and accurate information on the ice strength.
REFERENCES
DeAbreu, R., Yackel, J., Barber, D., and Arkette, M, 2001. Operational Satellite Sensing of Arctic First-Year Sea Ice Melt. Can. J. of Remote Sensing, Vol. 27, No. 5, October 2001, pp. 487 – 501.
Timco, G.W. and O’Brien, S. 1994. Flexural Strength Equation for Sea Ice. Cold Regions Science and Technology, Vol., 22, pp. 285-298.
Timco, G.W. and Johnston, M.E. 2002. Sea Ice Strength During the Melt Season. Proceedings IAHR Symposium on Ice, (this volume), Dunedin, New Zealand.
Johnston, M., Frederking, R. and Timco, G. 2002. Properties of Decaying First Year Sea Ice: Two Seasons of Field of Field Measurements. Proceedings 17th International on Okhotsk Sea and Sea Ice, pp 303-311, Mombetsu, Hokkaido, Japan.
Johnston, M. and Frederking, R. 2001. Decay Induced Changes in the Physical and Mechanical Properties of First-year Sea Ice. Proc. POAC’01, Vol. 3, pp. 1395-1404, Ottawa, Canada.