HAL Id: hal-01688931
https://hal.archives-ouvertes.fr/hal-01688931
Submitted on 19 Jan 2018
HAL is a multi-disciplinary open access
archive for the deposit and dissemination of
sci-entific research documents, whether they are
pub-lished or not. The documents may come from
teaching and research institutions in France or
abroad, or from public or private research centers.
L’archive ouverte pluridisciplinaire HAL, est
destinée au dépôt et à la diffusion de documents
scientifiques de niveau recherche, publiés ou non,
émanant des établissements d’enseignement et de
recherche français ou étrangers, des laboratoires
publics ou privés.
PATHWAYS TO DEEP DECARBONIZATION of the
passenger transport sector in France
Yann Briand, Julien Lefevre, Jean-Michel Cayla
To cite this version:
Yann Briand, Julien Lefevre, Jean-Michel Cayla. PATHWAYS TO DEEP DECARBONIZATION of
the passenger transport sector in France. [Research Report] IDDRI, UMR 8568 CIRED, EDF R&D.
2017. �hal-01688931�
IN FRANCE
Yann Briand, IDDRI
Julien Lefevre, CIRED
Jean-Michel Cayla, EDF R&D
NOVEMBER 2017
PATHWAYS TO DEEP
DECARBONIZATION
THE TRANSPORT DEEP DECARBONIZATION PATHWAYS PROJECT (DDPP-T)
Contact information for this country report
Yann Briand, IDDRI, yann.briand@iddri.org Julien Lefevre, CIRED, jlefevre@centre-cired.fr Jean-Michel Cayla, EDF R&D, jean-michel.cayla@edf.fr
The Transport Deep Decarbonization Pathways Project (DDPP-T), an initiative of the Institute for Sustainable Development and International Relations (IDDRI), aims to demonstrate how countries can transform their transport system by 2050 in order to implement a deep reduction in their greenhouse gas emissions, consistent with ambitious climate goals.The DDPP-T builds on the Deep Decarbonization Pathways Project (DDPP), which analyzed the deep decarbonization of energy systems in 16 countries in the lead-up to COP21. The two projects share key principles. The analysis is conducted at a country scale, by in-country research teams, working independently of their governments. It adopts a 2050 time horizon to reveal the short-term requirements of long-term climate and development objectives. Finally, country research teams openly share methods, modelling tools, data and results in order to enable knowledge sharing among project partners in a highly collaborative way and to facilitate engagement with sectoral experts and decision makers.
Publishers: IDDRI
Managing editors : Pierre Barthélemy, Yann Briand, Henri Waisman Editing & copy editing : Yann Briand, Julien Lefevre, Jean-Michel Cayla
The full report is available at iddri.org/projets/DDPP-Transport.
Please quote this report as
Briand Y., Lefevre J., Cayla J.-M. (2017), Pathways to deep decarbonization of the passenger transport sector in France, IDDRI.
Copyright © 2017 IDDRI
IDDRI encourages reproduction and communication of their copyrighted materials to the public, with proper credit (bibliographical reference and/or corresponding URL), for personal, corporate or public policy research, or educational purposes. However, IDDRI copyrighted materials are not for commercial use or dissemination (print or electronic). Unless expressly stated otherwise, the findings, interpretations, and conclusions expressed in the materials are those of the various authors and are not necessarily those of IDDRI’s board.
Acknowledgement
We would like to thank the DDPP secretariat at IDDRI, notably Henri Waisman, for providing comments and suggestions to develop and improve the analysis and early drafts of the report, and to Ivan Pharabod for designing the report.
Disclaimer
This report was written by a group of independent experts who have not been nominated by their governments. Any views expressed in this report do not necessarily reflect the views of any government.
The Deep Decarbonization Pathways Project for Transport (DDPP-T) is supported financially by the Michelin Corporate Foundation.
PATHWAYS TO DEEP DECARBONIZATION
of the passenger transport sector
Foreword
2Executive Summary
3Description of the passenger transport sector
5Situation and key features in 2010 5
Historical trends over the
1990-2014 period 6
Historical emissions and key features 7
National policy framework on mobility and climate 7
Storylines for the mobility determinants of two contrasting transition pathways:
Mobility-First (MOB-F) and Technology-First (TECH-F)
9Assumptions common to MOB-F and TECH-F scenarios 9
MOB-F scenario – structural transformations change the mobility needs and the related modal structure 10 TECH-F scenario – tendancial growing demand pushes the development of improved low carbon
technologies 12
Results – Evolution of emission drivers and related transformations for MOB-F and TECH-F scenarios
14MOB-F Scenario 14
TECH-F Scenario 17
Scenario comparison 19
Conclusion and policy discussion
21The decarbonization of passenger mobility focuses the debate around the future organization of living
spaces and mobility functions for people 21
The end of gasoline and diesel cars 21
Key discussion elements 22
Beyond “deep decarbonization” and towards “carbon neutrality” – the need to raise the level of ambition 23
Standardised DDPP graphics for France scenarios
25Mobility-First (MOB-F) 26
Technology-First (TECH-F) 28
References (technical)
30IN FRANCE
Yann Briand, IDDRI, Julien Lefevre, CIRED, Jean-Michel Cayla, EDF R&D
Foreword
This analysis considers passenger transport, encompass-ing the mobility of resident citizens includencompass-ing domestic and international air flights and non-motorized travel. Freight transport will be considered in future work. The analysis starts from an acknowledgment that pro-found transformations of the passenger transport sec-tor, that could deliver deep greenhouse gas emission reductions consistent with an ambitious climate goal, go beyond technological change. They require consid-ering a more systemic approach to build decarboniza-tion storylines, including key drivers like the evoludecarboniza-tion of demographic and economic situation, individual behaviours, lifestyles, infrastructures and spatial or-ganization. The approach also recognizes the need to provide quantification of these storylines for key in-dicators characterizing mobility patterns such as dis-tances travelled by trip purposes, by location of people, by modes or budget and time dedicated to transport activities. The methodology of the DDPP-T, adopted by all country research teams in the project, connects these two complementary approaches to long-term deep decarbonization analysis of the transport sector consistent with emission reductions computed in pre-vious DDPP national scenarios..
The structure of the report reflects this approach. The key determinants of mobility are described by the sto-rylines in the second section. These stosto-rylines are then translated into a quantitative sector-wide representa-tion of the transport sector, which form the core of the third section. Finally, a sub-set of these indicators have been chosen as key quantitative metrics to engage stakeholders and decision makers, and are presented in the Annex.
Executive Summary
National contextIn November 2015, France has adopted its first na-tional climate mitigation strategy (SNBC), accord-ing to the Paris Agreement, to reduce greenhouse gas (GHG) emissions by 75% by 2050 compared to 1990. This strategy sets up three emission budgets for 2013-2018, 2018-2023 and 2023-2028 with sectoral targets. The transport sectoral target to be achieved for the third budget compared to 2013 is a reduction target of 29%, but target estimates for
2050 go well below down to about 70-90%1, which
means the transport sector is expected to achieve a deep decarbonization by 2050.
The transport sector is the main emitting sector and represented about 26% of total French GHG emissions in 2010. In our previous exercise, we developed deep de-carbonization pathways for the whole national economy. However, this previous exercise did not allow enough granularity to understand the determinants of mobility and inform on key transformations of the transport sec-tor. The exercise was mainly focused on the decarboni-zation of energy carriers with related energy-indicators, which are not sufficient to describe the evolution of the transport sector. During this new phase, the Deep Decar-bonization Pathways Project – Transport group defined and used a common methodology to analyze and de-velop consistent scenarios for the transport sector with
transport-specific indicators like distance travelled by trip purpose, by location of people, by mode or budget and time dedicated to transport.
Two scenarios consistent with the 2°C target and SNBC objectives: MOB-F and TECH-F
Based on this methodology, the French research team chose to develop two scenarios for the passenger trans-port sector consistent with the 2°C target and the SNBC objectives, reaching both a reduction of about 78%
of CO2 emissions compared to 1990, down to about
20 MtCO2 in 2050. These two deep decarbonization
pathways embody contrasting futures of the mobility demand, as well as the supply-side solutions that will be necessary. The Mobility-First scenario (MOB-F) empha-sizes social, organizational and technical transformations of the mobility system “first” and then shows how tech-nological innovations contribute to the decarbonization of this new mobility system. MOB-F scenario integrates a demand decreasing effect linked to population aging, the development of tele-activities and structural chang-es in terms of urban and transport planning in suburban areas oriented towards the development of better public transport and soft mode services.
Conversely, the Technology-First (TECH-F) scenario takes into account the current mobility trends describ-ing an increasdescrib-ing demand and does not anticipate fun-damental changes in the mobility system. Therefore, it emphasizes technological innovations “first” and
PATHWAYS TO DEEP DECARBONIZATION
OF THE PASSENGER TRANSPORT SECTOR IN FRANCE
1 (2015). pathways to deep decarbonization in France, CIRED, EDDEN, IDDRI.
considers that low carbon technologies will provide an adequate solution for attaining climate mitigation objectives with an additional improvement of tech-nological efficiency, the penetration of gas-powered cars and an extensive generation potential of liquid and gaseous biofuels.
The MOB-F and TECH-F scenarios have been inspired by the strategies developed for the National Debate on Energy Transition in 2012, respectively by EFF- and DIV-strategies.
Transport Deep Decarbonization Pathways - Results
Both scenarios require strong actions on the three pillars of decarbonization to reach over the period 2010-2050: Pillar 1 - Energy efficiency (MJ/cap):
y
MOB-F: - 66% combining -19% for individual mobility(pkm/cap) and -58% for energy intensity (MJ/pkm)
y
TECH-F: -45% combining +4% for individual mobility(pkm/cap) and -47% for energy intensity (MJ/pkm) Pillar 2 - Decarbonization of electricity and fuels:
y
MOB-F: -66% of carbon content of electricity and 25%of biofuels in blended fuels by 2050
y
TECH-F: -66% of carbon content of electricity and61% of biofuels in blended fuels by 2050 (liquid fuels and pipeline gas)
Pillar 3 - Shifting to low carbon fuels:
y
MOB-F: 48% of non-fossil fuels in final energy by 2050y
TECH-F: 73% of non-fossil fuels in final energy by 2050 (Electricity, liquid and gaseous biofuels)We provide in the following some details about con-crete transformations occurring in our scenarios. The average constrained distance travelled could be re-duced in both scenarios by 6 – 27% compared to 2010 level, due to specific incentives on the organization of living places, the development of ICTs, the level of modal services and a structural aging effect. The modal share of cars could be reduced by 36% and the share of public transport and soft modes be increased by 42% in metropolitan areas in the MOB-F scenario due to specific incentives on modal speeds, modal costs and the level of services. The development of electric vehicles could represent about 57-63% of new
sales by 2050 and CO2 intensity of new cars could
be reduced down to 21-35 “well-to-wheel” gCO2 per
vehicle-kilometer by 2050.
Key challenges to raise the ambition for the decarbonization of the passenger transport
To avoid lock-in situations, policy-makers must track the ongoing transformations by using key quantitative indicators to inform on the policy implications. This dy-namic form of management should support the selection at the right moment of the “policies that preserve future freedom of choice, yielding high option-value”2. For this purpose, we need refined indicators to track the evolu-tion of the transformaevolu-tions of the main determinants of mobility and related emissions drivers as proposed in the “Standardized DDPP-Transport graphics” in annex. The debate about the decarbonization of the passenger transport sector should focus on the future organization of living spaces and on mobility functions for people beyond being a pure technological debate, even if low carbon technologies are very important for the sector’s decarbonization. National actions for deep decarboni-zation of the passenger transport sector should combine different strategies adapted to the different regions and urban contexts, the purpose of mobility and distances related to different systems of mobility.
In addition, a number of key questions emerged from this work: both scenarios integrate a high share of electric cars by 2050 and bring many questions around the develop-ment needs for charging points and related power genera-tion and distribugenera-tion infrastructures; The implementagenera-tion of teleworking could concern more than 7 million work-ers but how to ensure this implementation; The trans-formations of suburban zones require significant reforms regarding land use, urban and transport policies; Other key technological issues emerged such as what should be the place for biofuels, the place for air travel, the development of autonomous vehicles; What is the place of fossil fuels by 2050 in the car mobility and air mobility, etc. In the perspective of a “carbon neutral” economy, the passenger transport sector could be an important con-tributor to emissions reduction. A pathway combining MOB-F and TECH-F mitigation options could lead to a deeper decarbonized future. However, all measures and transformations considered are not independent and the development of an appropriate scenario for carbon neu-trality would need further analysis to test the consisten-cy of all assumptions based on the DDPP methodology. 2 (2015). pathways to deep decarbonization in France, CIRED,
1
Description of the passenger
transport sector
This section describes the passenger mobility situation in 2010, the historical trends observed, the climate impact of mobility and the current national policy framework on mobility and climate.
Situation and key features in 2010
French citizens have a high individual and local mobility demand. Total distance travelled amounted to 889 Gpkm for 65 million inhabitants in 2010. This represented an
average individual mobility of 13,700 pkm/cap compared to a global average of around 6,000 pkm/cap (IPCC, 2014). This total mobility breaks down as follows:
y
Local mobility (less than 80 km) was mainly due to “con-strained”3 activities and represented 60% of total distance travelled and about 98% of all trips in 2008 (ENTD, 2008).z z z z z z z z z z z z z z z z z z z zz z z z z z z z z z z z z z z z z z z z z z z 150 km
z
Figure 1. Schematic view of France, metropolitan areas and main road network in 2010
Metropolitan areas ≈ 15 Million people
(25% of the population)
Paris and 92-93-94 departments, 8 M
Definition: metropolitan areas are displayed on this figure and include Paris, Departments of the Paris region 92-93-94 and and all city centers of "urban poles" with more than 100 khab in 2008 (the smallest city center included is the city of Montbéliard). Country team defined the metropolitan areas based on a per capita basis and population density and similar transport features.
3 Definition: constrained activities are those where an individual has limited freedom to travel or not (work, school, shopping, administration…); non-constrained activities are those where an individual has more freedom on whether or not to travel (leisure activities).
y
Constrained activities represented two thirds of to-tal local mobility and 20% of long distance mobility in 2008. In total, constrained activities represented about 427 Gpkm and 48% of all distance travelled by passenger (ENTD, 2008).Work-related activities account for the majority of the 427 Gpkm of total constrained mobility (ENTD, 2008). Commuting represents 44% of constrained distance travelled, while additional professional trips represent about 8%. Main other activities inducing mobility are: shopping trips for 12% of total constrained mobility and administrative trips for 4% of total constrained mobility. In total, these three activities represent about two third of total constrained mobility.
The modal structure shows a high share of car mobility. Car mobility represented 82% of total pkm in 2010. A particular characteristic of France is its long-established and important high speed rail (HSR) network. In 2010, about 53% of rail pkm were realized by HSR. (See Figure 2).
Most vehicles consume oil-based fuels. The transport sec-tor (freight + passenger) was responsible for about one third of the total final energy consumption of France in 2010, representing the largest share in the consumption of petroleum products. The total energy consumed in 2010 by the passenger transport sector was about 1.2 EJ, more than 96% of which was gas and liquid oil-based fuels, with biofuels and electricity making up about 4% (See
Figure 3). A particular characteristic of France is the high level of diesel cars, which represent 75% of the total car fleet (ADEME, 2013).
Historical trends over the
1990-2014 period
Total passenger mobility increased by around 0.9% per year over the period 1990-2014 from about 740 Gpkm in 1990. This increase occurred across all modes of trans-port. Collective public transport had the highest growth rates (See Table 1).
z z z z z z z z Liquid biofuels Natural gas Electricity Oil products Air Train Bus Private car 82% 1% 11% 6% 96% 2% 2%
Figure 2. Modal share in total passenger mobility in 2010 Figure 3. Energy shares in total energy consumption
(% of 889.2Gpkm) (% of 1.21EJ)
Table 1. Passenger mobility trends over the 1990 - 2014 period
Modes Trend over the period 1990-2014 (% of pkm) Mobility value in 2014 (Gpkm)
Total mobility + 23% 907
Car + 20% 721
Train + 38% 102
Bus and tramways + 34% 70
Air + 24% 14
The share of passenger car mobility has slightly decreased but remained dominant with 79% in 2014 compared to 81% of total pkm in 1990. However, the number of vehi-cle kilometres (vkm) travelled has dramatically increased because the average occupancy rate has dropped from 1.78 in 1990 to 1.58 passenger per car in 2014. The share of collective transport (bus + train) showed a slight increased from 17.1% to 19% but continued to represent a limited share. Rail transport has increased the most, with an increase of 38% pkm due mainly to the significant development of high speed trains. France has the highest share of train-pkm out of all collective transport modes (air, train, bus) within the European Union.
Passenger mobility by local public transport, which mainly includes urban public transport modes (tram-ways, sub(tram-ways, city buses) has exploded over the peri-od with a rise in pkm of 44%. Interregional buses have steadily increased over the period and this trend could be strengthened with the liberalization in 2015 of the interregional bus market and the addition of more than 100 km of bus lanes.
The share of air travel remains stable at around 2% of total mobility. Air traffic increased over the 1990-2000 period and decreased over the 2000-2010 period. How-ever from 2010, air traffic has started to grow again (average 2.3% per year). There has been competition between high speed trains and domestic air traffic, with the former taking some of the market share previously held by the latter during the 2000-2010 period. However the development of low cost flights may reverse this trend in the coming decades.
Historical emissions and key features
Passenger and freight transportation represented about 26% of total French GHG emissions in 2010. Total GHG emissions from the transport sector reached
132 MtCO2eq in 2010, making it the largest sectoral
emitter. Out of the transport GHG emissions, CO2 rep-resents 95.5% of the total with a figure of 126 million tons of CO2 (CGDD, 2011). In this study we focus only on CO2 emissions, calculating that the passenger sector was responsible for emissions of 88 MtCO2 in 2010.
Road transportation is the main contributor with about 94% of total transport CO2 emissions. The passenger sector (passenger cars and light duty vehicles (LDVs))
about 75% and the freight sector about 25% of CO2
emissions from road transport. The average emission level of car sales was about 130 gCO2/veh-km in 2010. Domestic aviation represented about 4.7 MtCO2eq in 2015 and international aviation (not included in national statistics) represented 16.7 MtCO2eq in 2014.
Over the 1990-2015 period, GHG emissions from the transport sector have increased by 0.4% per year on av-erage, while total French GHG emissions have decreased by 0.6% per year. Over the period 1990-2015, transport GHG emissions increased by 10% from about 121 to
135 MtCO2eq according to the following phases (CGDD,
Compte des Transports, 2016):
y
1990-2004 : + 1,3%/yeary
2004-2010 : - 1,6%/yeary
2010-2015 : + 0,4%/yearA segmentation by modes gives the following trends:
y
Road emissions grew 0,4%/year (1990-2015) and the2W and LDV played the main roles with respectively 3,8% and 1,3% average annual growth (1990-2014).
y
Rail emissions decreased 3,3%/year (1990-2015)y
Domestic aviation emissions grew 0,3%/year butin-ternational aviation emissions grew faster with 3,4%/ year (1990-2015)
National policy framework on mobility
and climate
In 2012, a National Debate on Energy Transition de-fined two main pillars for energy transition in France: the Factor Four – a 75% reduction in GHG emissions in 2050 compared to 1990 – and reducing the share of nuclear power in the electricity mix from 75% in 2015 to 50% in 2025. The National Debate Council of 2013 also identified two main structural features that would characterize France’s energy-transition pathways: the level of energy demand reduction in 2050 compared to 2010 and the level of diversification of the energy supply. This enabled the delineation of four scenarios, which provide a comparatively complete analysis of France’s possible energy futures, including “Efficiency” (EFF) and
“Diversity” (DIV) strategies. EFF strategies are character-ized by low energy consumption and low diversification of energy supply and DIV by high energy consumption and high diversification of energy supply. In this study and in our previous work, these two groups have been used to inspire the creation of our new scenarios. In July 2015, France adopted a new framework for long-term policies, the Law on Energy Transition for Green Growth (LTECV) that includes the two main pillars for energy transition. In particular, this law includes the de-velopment of the French Low Carbon Long Term Strat-egy (SNBC) published in November 2015 (Art. 170) and the development of the French Strategic plan for clean mobility (SDMP) published in October 2016 (Art. 40). The SNBC defines the climate mitigation strategy need-ed to rneed-educe total GHG emissions by 75% by 2050 com-pared to 1990. A 5-year revision process was set up in line with the Paris Agreement and the first revision will come earlier next year in 2018. For the transport sector (Freight + Passengers), the SNBC identified priority areas for decarbonization, along with a number of quantitative objectives for the passenger transport sector contribu-tion over the period 2013-2028:
1. Stabilization of individual demand per unit of GDP
2. Increase of 10% in the occupancy rate of private cars
3. Modal shift from private cars and planes to public
transport and soft modes: 2%
4. Energy consumed by motorized vehicles: -30% MJ/vkm
5. Carbon emissions due to energy consumption:
-6% gCO2/MJ.
In addition, the SDMP described public actions to be implemented in the transport sector, according to the LTECV. The roadmap focuses on 6 main priority areas: demand management; development of low emission technology; development of low carbon fuels and de-ployment of production and distribution infrastructure; optimization of existing modal infrastructure and vehi-cles operations; shifting away from the most polluting modes towards the cleanest; and development of col-laborative transport. These actions have to be consistent with the 2028 quantitative climate objectives of the SNBC (See Table 2).
Currently, the French government has launched a con-sultative discussion around passenger and last kilometer freight mobility to prepare a future mobility planning act during the first semester of 2018, along with the revision of the SNBC – Transport.
Table 2. The SNBC provided GHG emissions budgets related to the transport sector
Year or Period Emission volume (MtCO2eq/year) Variation compared to 1990 Variation compared to 2013
1990 121 2013 136 +12% 2018 (1st budget) 127 +5% -7% 2023 (2nd budget) 110 -9% -19% 2028 (3rd budget) 96 -21% -29% 2050 42 -65%* -69%
* The contribution of the transport sector to factor 4 has been estimated at a 65% reduction of annual emissions over the period 1990 – 2050 by the “Comité Trajectoire” in 2012 (8, 2015).
2
Storylines for the mobility determinants
of two contrasting transition pathways:
Mobility-First (MOB-F) and
Technology-First (TECH-F)
This section describes the transformations of the major socio-economical, organizational and technical determi-nants of passenger mobility. These determidetermi-nants interact and influence the emissions of the sector through com-plex dynamics that are analyzed in section 3. The pur-pose of this section is to examine the storylines and the social and technical assumptions related to the following determinants: demographic and economic structures, lifestyles related to the organization of living places and land use, infrastructure and the built environment, mo-bility service deployment, vehicle technologies, energy generation and distribution technologies. Compared to previous DDPP analyses, a specific effort was made to fully comprehend the underlying and sometimes im-plicit assumptions that underlie the resulting demand, modal structure, technology and energy transformation pathways.
These two deep decarbonization pathways define con-trasting futures of the demand, along with the sup-ply-side solutions that will be necessary to be consist-ent with the decarbonization objectives of the SNBC. The Mobility-First (MOB-F) scenario was inspired by EFF-strategies. This pathway emphasizes social, organ-izational and technical transformations of the mobility system “first” and then shows how technological inno-vations contribute to the decarbonization of this new
system. Conversely, the Technology-First (TECH-F)
sce-nario was inspired by DIV-strategies. This pathway takes into account the current mobility trends and does not propose fundamental changes of the mobility system.
Therefore, it focuses “first” on technological innovations and considers that low carbon technologies will provide an adequate solution for attaining climate mitigation objectives. The MOB-F and TECH-F scenarios are de-veloped below.
Assumptions common to MOB-F
and TECH-F scenarios
Demographic and economic
An increasing and aging population are the two main characteristics of the changing demographic structure. INSEE, the National Statistics Institute, forecasts that the French population living on the European continent will grow from 65 million in 2010, to stabilize at around 74 million people in 2050. In addition, senior citizens (people over 65) are expected to represent almost one third of the total population. Said differently the 9 mil-lion additional people in 2050 compared to 2010 will be seniors. As for macroeconomic prospects, it is assumed that average economic growth remains low during the period at 1.5% per year. At the same time, the disposable income of households will increase by 0.3% per year.
Population centres and territorial
distribution
The development of housing and the population’s dis-tribution over the territory is a key element to consider when thinking about the evolution of future mobility.
In 2010, the population’s distribution was as follows: one quarter of the population lived in metropolitan ar-eas3 and three quarters lived in non-metropolitan are-as, of which half lived in suburban areas and the other half in rural areas. Current social and economic policies support the development of strong regional cities that attract people and the bulk of jobs. In both scenarios we assume that population growth in metropolitan areas will follow the average population growth estimated by INSEE, which is 14% over the period, and we assume that major changes will occur within non-metropolitan areas, with a significant share of the rural population moving into suburban areas. The suburban population is expected to increase by 60% during the 2010-2050 period and the rural population to decrease by one third down to about 16 million. However, the scenarios offer very contrasting visions of the future organization of living places and land use.
Infrastructure and urban planning
Regarding infrastructure and the transformation of the built environment, the two scenarios share a common vision of the development of rail infrastructure for both high-speed trains and regional networks and the devel-opment of bus transport. This develdevel-opment will continue to capture some of the market share held by domestic air travel. However, the scenarios differ in the relative priority of each transport mode in urban spaces.
Mobility services
As far as social practices for mobility is concerned, we assume a ramping up of the recent trend towards the development of mobility services linked to progress in Information and Communications Technology (ICT). Mobility services will increase in several forms for both local and long distance travel, including collaborative mobility and car sharing. These services will modify the use of transport modes.
Vehicles
Hybrid and electric vehicles are expected to strongly penetrate the market as key alternative technologies to petrol and diesel fueled cars. Both scenarios antici-pate significant energy efficiency gains for vehicles, but different levels of technical progress. The expansion of gas-powered vehicles (both LDVs and buses) occurs un-der both scenarios but results in different final market shares in 2050. They also both anticipate that level 4
autonomous vehicles will be available and will progres-sively increase their market share, but with differing lev-els and types of usages. Finally, the scenarios assume similar evolutions of the final price of energy, including
a carbon pricing component that reaches €360/tCO2 in
20504 and similar technology costs.
Energy system
Relying on electricity as an energy carrier is an impor-tant means of decarbonizing the transport sector, as the already low carbon content of electricity is assumed to decrease further by a factor of 3 by 2050 - from
65 gCO2/kWh down to 22 gCO2/kWh. This reduction
is due to the high penetration of renewables, which is consistent with the ADEME energy mix scenario. In ad-dition, both scenarios consider that second and third generation liquid biofuels could be developed by 2050 and will reduce the carbon content of biofuels by a factor of 3, from 36 gCO2/MJ in 2010 to 14 gCO2/MJ in 2050. Liquid biofuels are considered as alternatives to petro-leum-based fuels in both scenarios, but they anticipate different levels of penetration. Moreover, biogas plays a major role in both scenarios by decarbonizing natural gas by 50%, but with different level of generation.
MOB-F scenario – structural
transformations change the mobility
needs and the related modal structure
Spatial organization and lifestyles
Beyond the general trend of a rural exodus and a rapid increase in the suburban population over the coming dec-ades, the MOB-F scenario anticipates that people will aim to reduce their constrained mobility, and will therefore enjoy the structural transformations of urban areas that lead in this direction. In practice, people want compact cities (10, 2010), which means high-density areas where living areas and other facilities are in close proximity, enabled by ambitious urban planning, land use policies
3 Reminder: in this report, metropolitan areas include Paris, Departments of the Paris region 92-93-94 and and all city centers of “urban poles” with more than 100 khab in 2008. The smallest city center included is the city of Montbéliard.
4 Value computed during the previous DDPP exercise considering all sectors of the economy. In comparison, the French “Quinet commission” estimated 219 €/tCO2 in 2050.
and the support of the circular economy. A change to conventional urban planning is anticipated, moving away from urban sprawl with different areas having different specializations. A new urban paradigm is forecast, in-volving the development of areas with a mix of different functional spaces to answer to people’s needs in term of constrained and non-constrained activities. Overall, we estimate that these transformations, which focus on sub-urban areas, could reduce the distances between activities by an average of 10% for constrained mobility and by 5% for non-constrained.5
Moreover, MOB-F scenario considers that remote activi-ties, such as teleworking, e-commerce and the digitaliza-tion of administrative procedures, will reach a significant level. We assume that teleworking could have an impact on around 7 million executive employees in 2050 of one
day per week.6 In addition, e-commerce could replace
the need for one third of shopping trips to hypermarkets, while the dematerialization of administrative procedures could save 90% of all trips for administrative purposes. Finally, the MOB-F scenario includes a shift in leisure practices. First, the development of liveable cities will change the need for travel for the purposes of non-con-strained leisure. It is also estimated that the social dialog will result in changes to holiday and leisure trips, focus-ing on quality rather than quantity. People may thus be able to take longer holidays, rather than several shorter periods. We assume that this could generate a reduction in international air travel (distances over 3000 km). In addition, this scenario assumes that senior citizens will not have greater access to mobility in future. This is based on the fact that certain physical barriers associated with old age tend to reduce the need for mobility, and that these barriers will not be overcome by the new ser-vices. Therefore the individual mobility of senior citizens will remain stable between 2010 and 2050 at around 10,000 pkm/cap.
Infrastructure and built environment
In addition, in metropolitan and suburban areas, urban spaces will be re-orientated towards soft and low carbon transport modes with extension of pedestrian zones, additional lanes reserved for bicycles and buses, devel-opment of zero emission zones and harmonization of
speeds between modes7. The space for cars in cities,
including for parking, will be reduced to promote the
expansion of other transport modes. Furthermore, no new airport capacity building will be carried out, while existing capacities will not be further developed due to the reduction of domestic and international air travel. This governmental decision is based on the fact that “large transport infrastructure projects” are becoming less and less acceptable to the population.
Mobility services
The development of Information and Communication Technologies (ICTs) will support the development of a collaborative mobility economy and will completely change the way different transport modes are used. In-deed, ICTs will improve the interoperability between all modes (walking, biking service, bus, tram, train, carshar-ing, carpooling…). This will transform the mobility chain and encourage people to use different transport modes, improving their door-to-door mobility in terms of time, cost, distance and other parameters. In addition, there is a decline in the number of young people obtaining driving licences (particularly in urban centres) and the MOB-F scenario assumes there will be a paradigm shift in terms of individual mobility, towards an emphasis on the mobility service itself and the usage of the vehicle, rather than on vehicle ownership. This development will enable the optimization of existing public services and we assume that carsharing could increase occupancy rates for long distance mobility from 1.4 to 1.57, and for local mobility in suburban areas from 1.36 to 1.51 passen-gers per car.8 In addition, the MOB-F scenario considers that there will be a development of public transportation services in regional cities and their suburbs. The level of services in these areas could be aligned with the level of services existing in the suburbs of Paris for the same population density. Furthermore, new public mobility 5 These numbers have been estimated in order to reduce by 25% the difference between the distance travelled by the metropolitan population and suburban population. In 2010, the distances travelled for constrained and non constrained activities for the metropolitan population was around 40% lower. We assume that a urban planning oriented towards “compact cities” could result in reducing this difference from 40% to 30%.
6 7 million executive employees represent 10% of executive employees in intermediate companies, 30% of executive employees in large companies and all executive employees in the public administrations according to other analysis made by the Shift Project.
7 Note: it is estimated that 20% of the roads in Paris have a 30 km/h speed limit, and a target of 30% by 2020 has been set; while in Grenoble for instance it is estimated that 89% of roads are already limited at 30 km/h.
8 According to other analysis made by the Shift Project (Voluntarist scenario) and the CIRED (Ecopa scenario)
services based on autonomous vehicles and operated by public transport stakeholders could develop a com-plementary offer of public transportation in low-density areas where driver-led public transport is economically inefficient.
Vehicles
The energy efficiency of car mobility will significant-ly improve due to the better adaptation of vehicles to suit different travel types, improved motor efficiency, increased automation, smaller and lighter vehicles on average, and the optimization of onboard energy con-sumption. The energy efficiency of new internal com-bustion engine cars will improve by 20% from 1.87 MJ/ vkm in 2010 to 1.49 MJ/pkm in 2050, which equates to a consumption of about 4.5 litres per 100 km in 2050. MOB-F scenario assumes that the majority of vehicles will be PHEVs and BEVs by 2050, and that the efficiency of electric cars will remain stable at around 0.2 kWh/km. Regarding trains and buses, the operating rail fleet will be entirely renewed by 2050 with the electrification of the major part of the secondary network, while the bus fleet will be renewed twice before 2050. In dense met-ropolitan areas, public health and air quality issues will encourage a strong market penetration of fully electric and natural gas buses pushed by public procurement. Finally, the air fleet will also be renewed and a set of op-timizing measures will be implemented regarding aircraft weight, travel routes and engines, which will result in a 15% reduction in general unitary energy consumption. However, no major breakthroughs are anticipated and the fleet fully remains with combustion engines.
Energy system
Vehicle fleet transformations will induce structural changes in energy demand that will require a corre-sponding adjustment of fuel supply capacities. The shift towards an almost fully electrified rail network and electric vehicles entails a sizable increase in the electricity demand that will need to be supplied by the network and distributed through many charging stations. The growing demand for natural gas due to an increase in natural gas vehicles (NGVs) will be mainly restricted to professionals and public transport, which simplifies the problem of public gas stations. To avoid competition with agricultural production, the penetration of liquid biofuels will remain limited at around 4 Mtep in total9 .
TECH-F scenario – tendancial growing
demand pushes the development of
improved low carbon technologies
Spatial organization and lifestyles
The TECH-F scenario assumes that the development of urban areas will continue with the spatial segregation of activities and the development of rapid mass transit systems, enabling people to live further away from places of work and other activities. The current trend of urban sprawl will therefore continue and the distances between activities will increase, so that average local mobility for suburban areas will remain higher than in metropolitan areas (in 2010, the distance travelled was about 40% lower in metropolitan areas). However, the TECH-F scenario highlights specific changes in the demand for leisure. Indeed, the sce-nario assumes that there will be an increase in leisure travel among young people and senior citizens. In recent times, the development of ICTs has enabled the development of a new international network among young people. With the combined devel-opment of low cost transport modes, the mobility of the younger generation is increasing for leisure purposes. In parallel, we assume that senior citizens will have better access to mobility in future. The development of new adapted mobility services and private autonomous vehicles, along with an increase in living standards, will mean that mobility among senior citizens is expected to increase significantly, particularly for leisure trips.
In this scenario, remote working and e-commerce do not expand significantly and therefore have a negligible overall effect.
Infrastructure and built environment
The TECH-F scenario forecasts a future where the place of the car does not change. It is only the methods of motorization that are transformed. As far as local mobility is concerned, there will be no significant re-allocation of urban spaces between transport modes through new investment trends such as the promotion of non-motorized transport modes or the reduction 9 A generation potential of 3 Mtep had been estimated by ADEME
of traffic in urban and suburban areas. In general, cars–including autonomous vehicles–will remain the dominant transport mode, with no real modal shifts for local mobility.
Mobility services
The development of private autonomous vehicles will completely change the concept of time management. Indeed, people will be able to work while travelling in their cars, or enjoy leisure time. This would allow people to live further and further away from city centers to enjoy a rural family life, and although this would mean an increase in constrained mobility, it would not have the negative connotations of “lost time”. Finally, long distance non-constrained mobil-ity will keep increasing. And while mobilmobil-ity services develop due to ICT progress, together with carsharing for both local and long distance travel, it nevertheless has a limited effect on car occupancy rates and only manages to maintain the average at the same level of around 1.4 passengers per car.
Vehicles
While anticipating the maintenance of the dominance of individual LDVs, the TECH-F scenario assumes that technological progress will solve all problems. Com-pared to MOB-F, this scenario takes into account a stronger expansion of alternative fuels. PHEVs and BEVs are expected to significantly penetrate the market
as key alternatives to petroleum-fueled LDVs. Fur-thermore, natural gas will extend into the private car market, obtaining the oriented towards better public transport and non-motorized services same share as it does in the bus market of around 25%. According to this scenario a proportion of private car and bus fleets will continue to be based on liquid-fuel internal combustion engines with biofuel compatibility (flex fuel vehicles). Regarding gains in vehicle energy effi-ciencies, the TECH-F scenario assumes an efficiency improvement of about 30% for new internal combus-tion engine cars. For other transport modes – buses, trains and aircraft – the TECH-F scenario estimates a doubling of the gains obtained in the previous sce-nario, with 30% for buses, 10% for trains and 30% for aircraft. 1011
The diversification of vehicle engines translates into a diversification of fuel types, with a strong penetration of liquid and gaseous biofuels and natural gas compared to the MOB-F scenario. Furthermore, we assume that a generation of around 6 Mtep of liquid biofuel will be feasible in 2050.12
10 Ademe estimated a potential gain of 15% in the exercise of 2013.
11 IEA estimated in the exercise, Energy Technology Perspectives in 2008, a potential gain of 50% for buses regarding the Blue Map and 30% for aircraft regarding the baseline scenario.
12 A generation potential of 8 Mtep had been estimated by ANCRE in 2013.
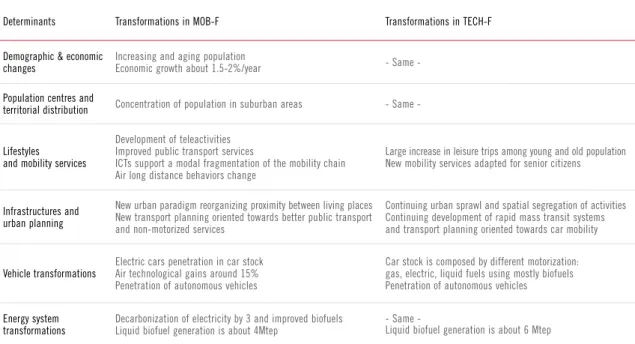
Table 3. Summary of MOB-F and TECH-F scenarios main assumptions
Determinants Transformations in MOB-F Transformations in TECH-F
Demographic & economic
changes Increasing and aging population Economic growth about 1.5-2%/year Same
-Population centres and
territorial distribution Concentration of population in suburban areas Same
-Lifestyles and mobility services
Development of teleactivities Improved public transport services
ICTs support a modal fragmentation of the mobility chain Air long distance behaviors change
Large increase in leisure trips among young and old population New mobility services adapted for senior citizens
Infrastructures and urban planning
New urban paradigm reorganizing proximity between living places New transport planning oriented towards better public transport and non-motorized services
Continuing urban sprawl and spatial segregation of activities Continuing development of rapid mass transit systems and transport planning oriented towards car mobility
Vehicle transformations Electric cars penetration in car stock Air technological gains around 15% Penetration of autonomous vehicles
Car stock is composed by different motorization: gas, electric, liquid fuels using mostly biofuels Penetration of autonomous vehicles Energy system
3
Results – Evolution of emission drivers
and related transformations for MOB-F
and TECH-F scenarios
This section highlights some of the key quantitative indi-cators for understanding the changes in mobility-derived emissions that occur under each scenario. These quanti-tative indicators change due to the combined effects of the social and technical transformations associated with the main determinants described in the previous section. The starting point and calibration of our scenarios at the year 2010 is based on two main sources: the 2008 transport survey (ENTD 2008, INSEE) and the 2010 transport account (CGDD). Additional modelling has been made through IMMOVE, a mobility model developed by EDF R&D.
MOB-F Scenario
There is a decrease in the annual individual distance trav-elled for constrained and non-constrained mobility in metropolitan and non-metropolitan areas (See Figure 4).
The average annual constrained mobility distance trav-elled will decrease on average by 27%, reaching around 4,200 pkm/cap by 2050 for metropolitan and non-met-ropolitan citizens. The overall decrease in constrained mobility is mainly due to the increasing proportion of sen-ior citizens in society, who have less need for constrained mobility, and also to the development of remote working and e-commerce. The convergence of constrained mo-bility for metropolitan and non-metropolitan citizens derives from a higher decrease for non-metropolitans. This sharper decrease is mainly due to the compactness of suburban zones in non-metropolitan areas, an effect that is amplified by the rural exodus.13
z
z
z
z
Figure 4. Annual individual distance travelled for constrained and non-constrained mobility
pkm/cap/year 0 1,000 2,000 3,000 4,000 5,000 6,000 7,000 8,000 9,000 Metropolitan Non constrained Non-metropolitan Metropolitan Non-metropolitan Constrained 2050 2040 2030 2020 2010
13 The compactness of suburban zones in non-metropolitan areas reduces distances travelled for local constrained mobility by 10% and local non-constrained mobility by 5%. This reduces the difference between local mobility of metropolitan population and local mobility of suburban population by 25%.
There will also be a decrease of 13% in the average yearly distance travelled for non-constrained mobil-ity, but there will be a divergence by 2050 between metropolitan and non-metropolitan citizens. There will be a larger decrease in non-constrained mobility for metropolitan citizens compared to non-metropolitans, the former decreasing on average by 27%, reaching about 6,000 pkm/year by 2050. This larger decrease is mainly due to the reduction of international air travel by 2050, while the compactness of suburban areas will also reduce non-constrained distances.14 The fact that the overall decrease of non-constrained mobility is not as pronounced as the decrease of constrained mobility is due to the increasing proportion of senior citizens in society.
This leads to an 8% reduction in total mobility, from 840 Gpkm to 772 Gpkm, due to a 19% reduction in individual mobility demand, from 13,800 pkm/cap to 11,200 pkm/cap, as discussed above. The main factors behind this reduction in average individual demand are: listed in Table 4.
The distance travelled by car will reduce by 27%, the dis-tance travelled by public transportation (rail and bus) will increase by 61%, and the distance travelled by non-mo-torized modes will more than triple (See Figure 5). Constrained mobility remains largely car-based by 2050. However, there is a significant decline in car usage and an increase in non-motorized trips (NMT).
This NMT increase stems from the major reorganiza-tions taking place in cities, such as the higher prior-ity given to soft transport modes and the changing attitudes towards such mobility, which encourage its development for short distance travel. Indeed, the MOB-F scenario assumes that about 75% of very short trips below 3 km could be shifted away from cars
towards NMT or public transport by 2050.15
Regarding non-constrained mobility, the scenario anticipates a significant increase in public transpor-tation modes whereas domestic air travel will almost disappear and international air travel will decrease. The large increase of public transportation for non-con-strained mobility is mainly due to the improvement of public transport in non-metropolitan suburbs and the rural exodus.16
The decision to build about more than 3,000 kms of high-speed train and to stop all new airport con-struction will be key to changing modal choices for domestic long distance travel. Moreover, the reduc-tion of internareduc-tional air travel is mainly due to the assumption made for leisure trips over 3,000 km (See part 2), which corresponds to about 50% demand reduction.
14 The MOB-F scenario considers that changes in leisure preferences from quantity to quality, which will also be supported by a doubling of ticket prices, will reduce international air travel over 3,000 km by 50%. Indeed, based on 2010 mobility data, metropolitan citizens travelled about twice the distance of non-metropolitan citizens in terms of long distance flights (around 2,000 pkm/cap).
15 According to other analysis made by the ECOPA project. In our case, a metropolitan citizen will increase his or her NMT-mobility from 600m to 2.2 km, while a non-metropolitan citizen will increase such mobility from 300 m to 1.9 km on average per day for constrained mobility
16 A non-metropolitan citizen will double his or her public transport-mobility from 3.4 to 6.3 km on average per day for non-constrained travel 0 1000 2000 3000 4000 5000 6000
0
2000
4000
6000
8000
z z z z z z z NMT Air - international Air - domestic Rail Bus 2/3W Car 000s pkm / cap 0 1 2 3 4 5 6 7 8 2050 2010 2010 2050Figure 5. Constrained and non-constrained individual
mobility by modes
Constrained mobility Non-constrained mobility
Table 4. Factors causing total demand reduction
Ageing population 5%
Teleactivities 4%
The car fleet will reduce considerably from 31 million to 22 million vehicles and electric motorization, including plug-in hybrids and fully electric vehicles, will increase from virtually nothing to reach over 50% of the car stock and two thirds of new sales by 2050 (See Figure 6). The MOB-F scenario assumes that the development of new collaborative mobility services will require a dedi-cated share of the car fleet, which could result in a one third reduction in the size of the car fleet. In addition, the scenario assumes that PHEVs and BEVs will successfully penetrate the market due to a reduction in the purchase price of such vehicles, along with an increase in the pur-chase price of liquid fossil fuel cars. In total, the share of disposable income dedicated to car mobility reduces over the period even if the average price of car mobility (eur/pkm) increases over the same period. This results from the modal shift away from car trips, along with the increase of disposable income.
The total energy consumed by motorized modes plunges over the period from 1.2 to 0.5 EJ. Oil represents 51% of the total energy consumed by motorized modes in 2050, while electricity and liquid biofuels have increased their shares (See Figure 7).
This reduction of energy consumption and its redistri-bution among alternative energy carriers derives from
the reduction in demand, changes in the modal struc-ture, the increased car occupancy rate and the energy efficiency gains made through technological progress. The overall average individual energy consumption per kilometer travelled decreases from 1.4 MJ/pkm in 2010 to 0.6 MJ/pkm in 2050, a reduction of about 60%. Second generation biofuels make up 37% of the blended liquid fuel consumed by road transport.
0 5 10 15 20 25 30 35 0.0 0.5 1.0 1.5 2.0 2.5 z z z z z z z z Million vehicles 0 5 10 15 20 25 30 35 40 2050 2040 2030 2020 2010 2010 2020 2030 2040 2050
Million vehicles sold / year
0.0 0.5 1.0 1.5 2.0 2.5 3.0
Figure 6. MOB-F Scenario - Car fleet and sales
PHEV BEV Gas Oil PHEV BEV Gas Oil
"Oil" means thermal motorization fueled by liquids (gasoline, diesel, liquid biofuels); “Gas” means thermal motorization fueled by gas (natural gas, biogas)
z z z z z EJ 0.0 0.2 0.4 0.6 0.8 1.0 1.2 1.4
Figure 7. MOB-F Scenario - Final energy consumption
2050 2040 2030 2020 2010 -61% Biogas Liquid biofuels Electricity Natural gas Oil
In addition, we note that the large development of electric cars will entail a number of specific issues in terms of electricity distribution for cars and the net-work. The MOB-F scenario considers that the electric-ity needed for car mobilelectric-ity will reach about 25 TWh.
TECH-F Scenario
Annual individual distance travelled for constrained mo-bility slightly decreases, while it increases for non-con-strained mobility in metropolitan and non-metropolitan areas (See Figure 8).
On the one hand, the average annual constrained mobility distance travelled will decrease on average by 6%, reaching around 5,000 pkm/cap by 2050 for metropolitan and non-metropolitan citizens. On the other hand, the average annual non-constrained mobility distance travelled will increase on average by 11%, reaching around 9,000 pkm/cap by 2050 for metropolitan and non-metropolitan citizens. These two trends are mainly due to the assumptions made on individual mobility for people under 65 and seniors,
over 65.17 The increase of non-constrained mobility
derives from a combination of transformations
includ-ing the hypermobility of young people and the devel-opment of young international network, new access to mobility for seniors thanks to new adapted services and autonomous vehicle and the general enrichment of the population. In addition, we can notice that even if the individual mobility increases for both age classes, population aging and distribution of the population have a structural decreasing effect. In total, average individual mobility just increases by 4%.
The TECH-F scenario does not consider that any specific transformations will have an impact on constrained or non-constrained mobility or the modal structure. Car mobility represents around 70% of the total pkm. Thus, we observed that constrained individual mobility slightly decreases by 7% and non-constrained individual mobility slightly increases by 7% over the period. This is due solely to changes in the demographic structure and the spatial distribution of the population.
z
z
z
z
Figure 8. Annual individual distance travelled for constrained and non-constrained mobility
pkm/cap/year 0 1,000 2,000 3,000 4,000 5,000 6,000 7,000 8,000 9,000 Metropolitan Non constrained Non-metropolitan Metropolitan Non-metropolitan Constrained 2050 2040 2030 2020 2010
17 We consider that individual mobility increases for people under 65 by 5% for local mobility and +10% for long distance mobility, while for people over 65, it increases by 15% for local mobility and +30% for long distance mobility. These estimates have been made in comparison with a publication of CGDD about demand projection by 2050
The car fleet will increase slightly from 31 to 34 million ve-hicles, while liquid fossil fuel cars will represent only 17% of the fleet by 2050. Alternative motorization, including electric cars and compressed natural gas (CNG) cars, will increase significantly over the period (See Figure 9). CNG cars will penetrate the market, representing about 25% of the fleet and 25% of sales by 2050. However, at around 60%, PHEV and BEV will represent the main share of the vehicle fleet and sales. The TECH-F scenario assumes that CNG cars will hold a market share even if car and fuel prices are not as low as electric cars by 2050. Indeed, we estimated regarding increase in disposable income and other potential social trends, that CNG cars could penetrate the market.
The total energy consumed by motorized modes decreas-es from 1.2 to 0.8 EJ. Oil reprdecreas-esents only 13% of the total energy consumed by motorized modes in 2050, liquid and gaseous biofuels represent almost half of the total energy, and electricity around a quarter (See Figure 10). This reduction of energy consumption is solely based on bold assumptions regarding the technological progress on efficiency for the different transport modes. While the increase of biofuels is again based on bold techno-logical assumptions regarding the capacity to produce 0.3 EJ of liquid biofuels (about 6 Mtep) and 0,1EJ of gaseous biofuels (about 2 Mtep).
In addition, we noted that major developments in electric and CNG car mobility will result in specific challenges in terms of energy distribution. Indeed, the TECH-F scenario assumes that car mobility will be responsible for the consumption of around 50 TWh of electricity and about 0.21 EJ of pipeline gas, mix of natural gas and biogas. Therefore, the need for charging stations and gas refueling stations will be very important and will require investment.
z z z z z z z z Million vehicles 0 5 10 15 20 25 30 35 40 2050 2040 2030 2020 2010 2010 2020 2030 2040 2050
Million vehicles sold / year
0.0 0.5 1.0 1.5 2.0 2.5 3.0
Figure 9. TECH-F Scenario - Car fleet and sales
PHEV BEV Gas Oil PHEV BEV Gas Oil
"Oil" means thermal motorization fueled by liquids (gasoline, diesel, liquid biofuels); “Gas” means thermal motorization fueled by gas (natural gas, biogas)
z z z z z EJ 0.0 0.2 0.4 0.6 0.8 1.0 1.2 1.4
Figure 10. TECH-F Scenario - Final energy consumption
2050 2040 2030 2020 2010 -37% Biogas Liquid biofuels Electricity Natural gas Oil
Scenario comparison
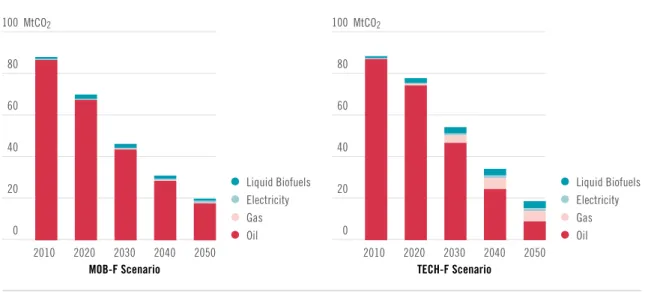
These two scenarios show contrasting decarbonization strategies that illustrate the possible role of existing le-vers for the decarbonization of passenger transportation in France, to obtain a CO2 reduction of about 78%, from 88 MtCO2 down to 20 MtCO2 in 2050 (See Figure 11). However, the pathways taken by these two decarboni-zation strategies have a different approach.
The MOB-F scenario highlights the role of fundamental transformations in society for the reduction of individual mobility and the shift to soft modes. In comparison, the TECH-F scenario emphasizes the role of energy diversi-fication with fundamental transformations towards low carbon energy carriers.
The two strategies vary according to the demand vari-ation and the importance of public transport and soft mobility (PT + NMT, Figure 12) and according to the share of non-fossil fuels in final energy and the related energy carbon intensities (Figure 13).
The demand structure varies more in the MOB-F sce-nario than in the TECH-F scesce-nario with a reduction in individual demand and a higher market penetration of PT + NMT mobility. In addition, passenger transportation consumes more energy in the TECH-F scenario and also consumes more energy from non-fossil fuels compared to the MOB-F scenario in 2050.
0 20 40 60 80 100 0 20 40 60 80 z z z z z z z z MtCO2 0 20 40 60 80 100 MtCO2 0 20 40 60 80 100 2050 2040 2030 2020 2010 2010 2020 2030 2040 2050
Figure 11. Mobility-related emissions according to energy carriers
MOB-F Scenario TECH-F Scenario
Liquid Biofuels Electricity Gas Oil Liquid Biofuels Electricity Gas Oil
Individual demand % of 2010 (pkm/vap)
-20 -15 -10 -5 0 5 10 2010 2010 2050 2050 2050 2050 2030 2030 2030 2030
Non-fossil fuels share (% of final energy)
0 10 20 30 40 50 60 70 80
Figure 12. Individual demand variation
and PT + NMT variation Figure 13. carbon content of energy Share of non-fossil fuels in final energy and
0% 25% 50% 75% 100%
PT + NMT % of 2010 (pkm) MOB-F TECH-F
-70% -50% -30% -10% 0%
Carbon content % of 2010 (gCO2/MJ) MOB-F TECH-F
Carbon content transition will benefit an average individ-ual in terms of costs, distances and time
None of the transformations described in these sce-narios will translate into higher costs for an average household and will even represent a smaller share of
disposable income (See Table 5). In addition, in the
MOB-F-scenario we observe that the transition scenario will largely benefit individuals through a reduction in travel distances and with a modal shift away from the car towards public transport and soft modes, thus being of benefit in terms of transport time for constrained activities.
Electric mobility is key for the future
In both scenarios, the development of electric vehicles is crucial, with PHEVs and BEVs representing about 55-60% of the car fleet in 2050, which means around 5-9 million in 2030 and 12-22 million in 2050, representing about 25-50 TWh in terms of electricity consumption, so about 10% of the electricity generation in 2010. Thus, both scenarios forecast that a high development of electric cars will require a massive roll-out of charging points all over the country: at homes, workplaces and in other public spaces, reaching about 3.4 to 4.8 million charging stations in 2030, and 6.3 to 9.6 million in 2050.18 Table 5. Average individual benefit in terms of costs, distances and time
Reference MOB-F Scenario TECH-F Scenario
Year 2010 2050 2050
Annual mobility expenditures (% disposable income) 17% 8% 11%
Constrained daily distance (km/day/cap) 16 12 15
Constrained daily travelling time (min/day/cap) 35 32 35
18 The calculation is based on serving the electricity demand with both normal 3 kW chargers (90%) and 22 kW fast chargers (10%) and an annual load factor of 15%.
4
Conclusion and policy discussion
This section discusses the main conclusions linked to the deep decarbonization scenarios for France developed in the present study and highlight some key elements for achiev-ing the national decarbonization of the passenger mobility.
The decarbonization of passenger
mobility focuses the debate around the
future organization of living spaces and
mobility functions for people
The debate around the development of low carbon mobili-ty often focuses on the technical debate about low carbon technologies, which is reflected in most decarbonization strategies. Indeed, all Nationally Determined Contribu-tions aiming to introduce transport mitigation measures give more considerations to the electrification of transport and to the improvement of fuel economy, but the question of the needs and functions of mobility is most of time non addressed. Low carbon technologies are a very impor-tant aspect in the decarbonization of sectors, but thinking about the rationales behind mobility is important too. Mobility is not a goal in itself, but a way to gain access to an activity, and transportation vehicles are just mo-bility tools providing different services. The development of low carbon mobility and decarbonization strategies should start by looking at the organization of living spac-es (work, homspac-es, schools, shopping, leisure placspac-es…) and individual preferences for housing. Related issues, such as urban planning, disruptive technologies, infra-structure, public transport investment and demographic and economic perspectives, could then be added into this structural debate. For example, senior citizens will represent a third of the population in 2050, how will their activities change? And, if the young population is more internationally-connected than ever before, how will this impact their long distance mobility?
Mobility should not be considered only as a response to in-dividual choices. Inin-dividual preferences are influenced and constrained by the reality of the society in which people live.
The end of gasoline and diesel cars
In July 2017, Nicolas Hulot, Minister for the Ecological and Solidarity Transition, announced that a target to reach “zero sales of diesel and gasoline cars by 2040” was part of the government’s new Climate Action Plan. Other European countries have established similar objectives. For example, the Netherlands have introduced a target of “zero sales of thermal combustion engines (gasoline, diesel, GPL) from 2035”, while Norway aims to achieve the same in 2025.
At the beginning of this study, Nicolas Hulot had not yet taken on this ministerial appointment and the correspond-ing Action Plan had not been published. We did not there-fore integrate this perspective into our scenarios and our scenarios suggest that liquid fossil fuel cars will make up between 25% and 50% of new car sales in 2040. However, we decided to integrate this target into a short additional simulation to highlight the added value of this measure. If we consider that from 2040 the sales of liquid fossil fuel cars shift proportionally to BEVs and PHEVs, then total carbon emissions in 2050 will be reduced by 88%, down to 11 MtCO2, and by 82% down to 16 MtCO2 in the MOB-F and TECH-F scenarios respectively.19
The interesting result revealed by this calculation is that the development of gas-powered vehicles in the TECH-F scenario create a new source of emissions by 19 It should be noted that these calculations have been carried out just to highlight the impact of phasing out oil-based cars by 2050. We did not conduct a deep analysis of the other impacts or of the consistency of this measure.