arXiv:nucl-ex/0609002v2 13 Nov 2006
A. Acha,1 K. A. Aniol,2 D. S. Armstrong,3 J. Arrington,4 T. Averett,3S. L. Bailey,3 J. Barber,5A. Beck,6
H. Benaoum,7J. Benesch,8 P. Y. Bertin,9P. Bosted,8 F. Butaru,10 E. Burtin,11 G. D. Cates,12 Y.-C. Chao,8
J.-P. Chen,8 E. Chudakov,8E. Cisbani,13 B. Craver,12 F. Cusanno,13R. De Leo,14P. Decowski,15A. Deur,8
R. J. Feuerbach,8 J. M. Finn,3 S. Frullani,13 S. A. Fuchs,3 K. Fuoti,5 R. Gilman,16, 8 L. E. Glesener,3K. Grimm,3
J. M. Grames,8 J. O. Hansen,8J. Hansknecht,8 D. W. Higinbotham,8 R. Holmes,7 T. Holmstrom,3 H. Ibrahim,17 C. W. de Jager,8 X. Jiang,16J. Katich,3 L. J. Kaufman,5 A. Kelleher,3P. M. King,18 A. Kolarkar,19S. Kowalski,6
E. Kuchina,16 K. S. Kumar,5L. Lagamba,14 P. LaViolette,5 J. LeRose,8 R. A. Lindgren,12 D. Lhuillier,11
N. Liyanage,12D. J. Margaziotis,2P. Markowitz,1 D. G. Meekins,8 Z.-E. Meziani,10 R. Michaels,8 B. Moffit,3
S. Nanda,8 V. Nelyubin,12, 20 K. Otis,5 K. D. Paschke,5 S. K. Phillips,3 M. Poelker,8 R. Pomatsalyuk,21
M. Potokar,22 Y. Prok,12 A. Puckett,6 Y. Qian,23 Y. Qiang,6 B. Reitz,8 J. Roche,8 A. Saha,8 B. Sawatzky,10 J. Singh,12K. Slifer,10 S. Sirca,6 R. Snyder,12 P. Solvignon,10 P. A. Souder,7 M. L. Stutzman,8 R. Subedi,24
R. Suleiman,6 V. Sulkosky,3 W. A. Tobias,12 P. E. Ulmer,17 G. M. Urciuoli,13 K. Wang,12 A. Whitbeck,8
R. Wilson,25 B. Wojtsekhowski,8 H. Yao,10 Y. Ye,26 X. Zhan,6 X. Zheng,6, 4 S. Zhou,27 and V. Ziskin6
(The HAPPEX Collaboration)
1 Florida International University, Miami, Florida 33199, USA 2 California State University, Los Angeles, Los Angeles, California 90032, USA
3College of William and Mary, Williamsburg, Virginia 23187, USA 4Argonne National Laboratory, Argonne, Illinois 60439, USA 5University of Massachusetts Amherst, Amherst, Massachusetts 01003, USA 6Massachusetts Institute of Technology, Cambridge, Massachusetts 02139, USA
7Syracuse University, Syracuse, New York 13244, USA
8Thomas Jefferson National Accelerator Facility, Newport News, Virginia 23606, USA 9Universit´e Blaise Pascal/CNRS-IN2P3, F-63177 Aubi`ere, France
10Temple University, Philadelphia, Pennsylvania 19122, USA 11CEA Saclay, DAPNIA/SPhN, F-91191 Gif-sur-Yvette, France
12University of Virginia, Charlottesville, Virginia 22904, USA 13Istituto Nazionale di Fisica Nucleare, Sezione Sanit`a, 00161 Roma, Italy
14Istituto Nazionale di Fisica Nucleare, Sezione di Bari and University of Bari, I-70126 Bari, Italy 15Smith College, Northampton, Massachusetts 01063, USA
16Rutgers, The State University of New Jersey, Piscataway, New Jersey 08855, USA 17Old Dominion University, Norfolk, Virginia 23529, USA
18University of Illinois, Urbana, Illinois 61801, USA 19University of Kentucky, Lexington, Kentucky 40506, USA
20St. Petersburg Nuclear Physics Institute of Russian Academy of Science, Gatchina, 188350, Russia 21Kharkov Institute of Physics and Technology, Kharkov 310108, Ukraine
22Jozef Stefan Institute, 1000 Ljubljana, Slovenia 23Duke University, Durham, North Carolina 27706, USA
24Kent State University, Kent, Ohio 44242, USA 25Harvard University, Cambridge, Massachusetts 02138, USA
26University of Science and Technology of China, Heifei, Anhui 230026, China 27China Institute of Atomic Energy, Beijing 102413, China
(Dated: September 4, 2006)
We report new measurements of the parity-violating asymmetry APV in elastic scattering of 3 GeV electrons off hydrogen and4He targets with hθ
labi ≈ 6.0◦. The4He result is APV= (+6.40 ± 0.23 (stat) ± 0.12 (syst)) × 10−6. The hydrogen result is A
PV= (−1.58 ± 0.12 (stat) ± 0.04 (syst)) × 10−6. These results significantly improve constraints on the electric and magnetic strange form factors Gs E and G s M. We extract G s E = 0.002 ± 0.014 ± 0.007 at hQ 2i = 0.077 GeV2, and Gs E+ 0.09 Gs
M = 0.007 ± 0.011 ± 0.006 at hQ2i = 0.109 GeV2, providing new limits on the role of strange quarks in the nucleon charge and magnetization distributions.
PACS numbers: 25.30.Bf, 13.60.Fz, 11.30.Er, 13.40.Gp, 14.20.Dh
Over the past several decades, high-energy lepton-nucleon scattering has revealed the rich structure of the nucleon over a wide range of length scales. In re-cent years, increasingly sensitive measurements of
elas-tic electron-nucleon scattering, mediated by photon ex-change and Z0exchange, have enabled the measurement of the electromagnetic and neutral weak form factors. These functions of the 4-momentum transfer Q2
charac-terize nucleon charge and magnetization distributions. In particular, the neutral weak form factor measure-ments provide a way to probe dynamics of the “sea” of virtual light (up, down and strange) quark-antiquark pairs that surrounds each valence quark in the nucleon. Since the Z0boson couples to various quarks with
differ-ent relative strengths compared to the photon, a com-bined analysis of proton and neutron electromagnetic form factor and proton neutral weak form factor mea-surements, along with the assumption of charge symme-try, allows the determination of the strange electric and magnetic form factors Gs
E and GsM [1, 2].
The established experimental technique to mea-sure the electron-nucleon weak neutral current am-plitude is parity-violating electron scattering [3, 4]. Longitudinally-polarized electron-scattering off unpolar-ized targets can access a parity-violating asymmetry APV ≡ (σR− σL)/(σR+ σL), where σR(L) is the cross
section for incident right(left)-handed electrons. Arising from the interference of the weak and electromagnetic amplitudes, APVincreases with Q2 [5].
Four experimental programs have been designed to ac-cess the Q2range of 0.1 to 1 GeV2, where the A
PV
expec-tations range from one to tens of parts per million (ppm). The published measurements [6–12] are mutually consis-tent. An intriguing pattern in the low-Q2 behavior seen
in [9, 10] has marginal statistical significance.
In this paper, we significantly improve our two previous measurements [11, 12] of APVin elastic electron
scatter-ing from1H and4He nuclei. Since A
PVfor1H is sensitive
to a linear combination of Gs
Eand GsM while that for4He
is sensitive only to Gs
E, a simultaneous analysis of both
measurements results in the most precise determination to date of Gs
E and GsM at Q2∼ 0.1 GeV 2.
The measurements were carried out in Hall A at the Thomas Jefferson National Accelerator Facility (JLab). As described in detail in two previous publications [11, 12], a 35 to 55 µA continuous-wave beam of ∼3 GeV lon-gitudinally polarized electrons was incident on 20 cm long cryogenic targets. Elastically scattered electrons were fo-cused into background-free regions by a symmetric pair of high-resolution spectrometer systems. The scattered flux was intercepted by identical detector segments in each arm (two for 1H, one for 4He), resulting in Cherenkov
light collected by photomultiplier tubes (PMTs). The helicity of the electron beam, generated by pho-toemission off a GaAs wafer, is determined by the hand-edness of the incident laser light’s circular polarization. This was selected pseudorandomly at 15 Hz and toggled to the opposing helicity after 33.3 ms, with each of these equal periods of constant helicity referred to as a “win-dow.” PMT and beam monitor responses for two consec-utive windows of opposite helicity were integrated, digi-tized, and grouped as a “pair” for asymmetry analysis.
The beam monitors, target, detector components, elec-tronics and accelerator tune were optimized such that the
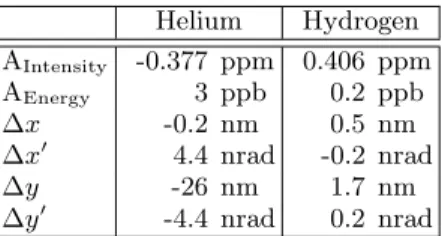
Helium Hydrogen AIntensity -0.377 ppm 0.406 ppm AEnergy 3 ppb 0.2 ppb ∆x -0.2 nm 0.5 nm ∆x′ 4.4 nrad -0.2 nrad ∆y -26 nm 1.7 nm
∆y′ -4.4 nrad 0.2 nrad
TABLE I: Average beam asymmetries under polarization re-versal in intensity and energy and differences in horizontal and vertical position (∆x, ∆y) and angle (∆x′, ∆y′) .
fluctuation in the PMT response over a pair was domi-nated by counting statistics of the scattered flux for rates up to 100 MHz. This facilitated APVmeasurements with
statistical uncertainty as small as 100 parts per billion (ppb) in a reasonable length of time. To keep spurious beam-induced asymmetries under control at this level, the laser optics leading to the photocathode were care-fully designed and monitored. Indeed, averaged over the entire period of data collection with the hydrogen tar-get, the achieved level of control surpassed all previous benchmarks, as summarized in Table I.
The data collection took place over 55 days (4He) and 36 days (1H). A half-wave (λ/2) plate was periodically
inserted into the laser optical path which passively re-versed the sign of the electron beam polarization. With roughly equal statistics in each state, many systematic effects were suppressed. There were 121 (4He) and 41
(1H) such reversals. The data set between two successive
λ/2 reversals is referred to as a “slug.”
Loose requirements were imposed on beam quality to remove periods of instability, leaving about 95% of the data sample for further analysis. No helicity-dependent cuts were applied. The final data sample consisted of 35.0 × 10⁶(4He) and 26.4 × 10⁶(1H) pairs. The right-left
helicity asymmetry in the integrated detector response, normalized to the beam intensity, was computed for each pair to form the raw asymmetry Araw. The dependence of
Araw on fluctuations in the five correlated beam
param-eter differences ∆xi is quantified as Abeam =Pci∆xi,
where the coefficients ciquantify the Arawbeam
parame-ter sensitivity. The electroweak physics of the signal and backgrounds is contained in Acorr= Araw− Abeam.
The Acorr window-pair distributions for the two
com-plete data samples were perfectly Gaussian over more than 4 orders of magnitude with RMS widths of 1130 ppm (4He) and 540 ppm (1H); the dominant source of
noise in the PMT response was counting statistics. To further test that the data behaved statistically and the er-rors were being accurately calculated, Acorraverages and
statistical errors for typical one hour runs, consisting of about 50k pairs each, were studied. Each set of roughly 400 average Acorr values, normalized by the
correspond-ing statistical errors, populated a Gaussian distribution of unit variance as expected.
λ/2 OUT λ/2 IN BOTH 4He (DOF = 59) (DOF = 60) (DOF = 120)
Asym rχ2 Asym rχ2 Asym rχ2
Araw 4.80±0.27 0.75 -5.41±0.27 1.12 5.10±0.19 0.95 Acorr 5.12±0.27 0.78 -5.38±0.27 1.07 5.25±0.19 0.92 1H (DOF = 20) (DOF = 19) (DOF = 40) Araw -1.40±0.15 0.73 1.42±0.15 1.04 -1.41±0.11 0.86 Acorr -1.41±0.15 0.81 1.43±0.15 1.02 -1.42±0.11 0.89 TABLE II: Raw and corrected asymmetries (in ppm) and re-duced “slug” χ2 (rχ2), broken up by λ/2 reversals. The dif-ferences between Araw and Acorr result from corrections for energy, position, and angle differences which are summarized in Table I.
Systematic effects in Abeam estimations were studied.
When averaged over all detector segments, the coeffi-cients ci were much smaller than those for individual
de-tector segments due to the symmetric geometry of the apparatus. Limits on systematic uncertainties in the ci’s
in the range of 10 to 30% were set by inspecting resid-ual correlations of Acorr’s of individual detector segments
with helicity-correlated beam asymmetries.
Another important validation was to use two indepen-dent methods to calculate ci. The first relied on linear
regression of the observed response of the detector PMTs to intrinsic beam fluctuations. The other used calibration data in which the beam was modulated, by amounts large compared to intrinsic beam fluctuations, using steering magnets and an accelerating cavity. Differences in the two Abeam calculations were always much smaller than
corresponding Acorr statistical errors.
Final Acorr results were calculated using the beam
modulation technique and are summarized in Table II. Due to the excellent control of beam parameter differ-ences ∆xisummarized in Table I, Acorr− Arawvalues are
of the order of, or much smaller than, the corresponding statistical errors. Under λ/2 reversal, the absolute values of Acorr are consistent within statistical errors. The
re-duced χ2for A
corr“slug” averages is close to one in every
case, indicating that any residual beam-related system-atic effects were small and randomized over the time pe-riod of λ/2 reversals (typically 5 to 10 hours). The final Acorr results are AHecorr= +5.25 ± 0.19(stat) ± 0.05(syst)
ppm and AH
corr= −1.42 ± 0.11(stat) ± 0.02(syst) ppm.
The physics asymmetry Aphysis formed from Acorr,
Aphys= K Pb Acorr− PbPiAifi 1 −Pifi , (1)
with corrections for the beam polarization Pb,
back-ground fractions fiwith asymmetries Ai and finite
kine-matic acceptance K. These corrections are described be-low and summarized in Table III. The first line lists the cumulative Abeam corrections discussed above, scaled by
K/Pb.
A powerful feature of the apparatus is the
spectrom-Dispersive Detector Axis (m)
-0.3 -0.2 -0.1 -0.0 0.1 Counts 0 200 400 600
He
4 1 10 2 10 3 10Dispersive Detector Axis (m)
-0.3 -0.2 -0.1 -0.0 0.1 Counts 0 1000 2000 3000
H
1 1 10 2 10 3 10FIG. 1: Single-particle spectra obtained in dedicated low-current runs. The insets show the same spectra on a loga-rithmic scale. The vertical lines delineate the extent of the detectors. Inelastic scattering from4He is entirely contained in the hatched area. The shaded regions, visible only in the log plots, show the contribution from target windows.
Correction (ppb) Helium Hydrogen
Beam Asyms. 183 ± 59 −10 ± 17
Target window bkg. 113 ± 32 7 ± 19
Helium QE bkg. 12 ± 20
-Rescatter bkg. 20 ± 15 2 ± 4
Nonlinearity 0 ± 58 0 ± 15
Scale Factor Helium Hydrogen
Acceptance factor K 1.000 ± 0.001 0.979 ± 0.002 Q2 Scale 1.000 ± 0.009 1.000 ± 0.017 Polarization Pb 0.844 ± 0.008 0.871 ± 0.009 TABLE III: Corrections to Acorrand systematic errors.
eters’ ability to focus the elastically scattered electrons into a compact region. Indeed, much less than 1% of the flux intercepted by the detectors originated from in-elastic scattering in the target cryogen. Figure 1 shows charged particle spectra obtained with dedicated low-intensity runs and measured by drift chambers in front of the detectors. The dominant background was quasi-elastic scattering from target windows, separately mea-sured using an equivalent aluminum target and computed
to be 1.8 ± 0.2% (4He) and 0.76 ± 0.25% (1H).
An electron must give up more than 19 MeV to break up the 4He nucleus and undergo quasi-elastic
scatter-ing off nucleons. Figure 1 shows that the quasi-elastic threshold lies beyond the edge of the detector. A limit of 0.15±0.15% on this background was placed by detailed studies of the low-intensity data. For1H, the π0
thresh-old is beyond the extent of the plot; direct background from inelastic scattering is thus negligible.
Background from rescattering in the spectrometer apertures was studied by varying the spectrometer mo-mentum in dedicated runs to measure inelastic spectra and to obtain the detector response as a function of scat-tered electron energy under running conditions. From these two distributions, the rescattering background was estimated to be 0.25±0.15% (4He) and 0.10±0.05% (1H).
For each source of background, a theoretical estimate for APV was used, with relative uncertainties taken to
be 100% or more to account for kinematic variations and resonance contributions. The resulting corrections and the associated errors are shown in Table III. Upper limits on rescattering contributions from exposed iron in the spectrometer led to an additional uncertainty of 5 ppb.
Nonlinearity in the PMT response was limited to 1% in bench-tests that mimicked running conditions. The rela-tive nonlinearity between the PMT response and those of the beam intensity monitors was < 2%. A nuclear recoil technique using a water-cell target [11] was used to de-termine the scattering angle θlab, thus keeping the scale
error on hQ2i due to θ
labto be < 0.2%. The acceptance
correction K accounted for the non-linear dependence of the asymmetry with Q2.
The beam polarization, Pb, was continuously
moni-tored by a Compton polarimeter; results, averaged over the duration of each run, are listed in Tab. III. Re-dundant cross-calibration of the recoil Compton elec-tron spectrum restricted the relative systematic error to ≈ 1%. The results were consistent, within systematic uncertainties, with those obtained from recoil Compton photon asymmetries, and with dedicated measurements using Møller scattering in the experimental hall and Mott scattering at low energy. Throughout the asymmetry and background analysis, blinding offsets were maintained on both results. These offsets, which were significantly larger than the respective statistical errors, were removed only after all analysis tasks were completed. After all corrections:
AHephys = +6.40 ± 0.23 (stat) ± 0.12 (syst) ppm,
AHphys = −1.58 ± 0.12 (stat) ± 0.04 (syst) ppm.
The theoretical predictions AHe
NS and AHNS with Gs= 0
were estimated using the formalism in [4] and described in our previous publications [11, 12]. The electroweak radiative corrections, calculated using the MS renormal-ization scheme, introduced negligible uncertainties.
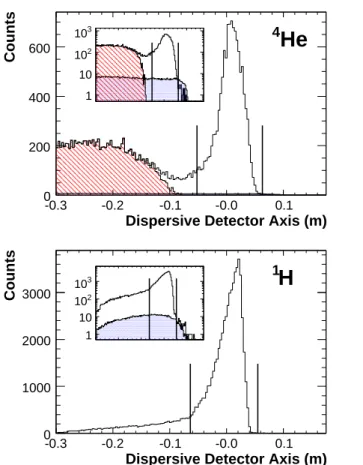
-1.5 -1 -0.5 0 0.5 1 1.5 -0.15 -0.1 -0.05 0 0.05 0.1 0.15 E s
G
M sG
He 4 HAPPEX-HAPPEX-H [18] [19] [20] [21] [22] [23] 2 = 0.1 GeV 2 QFIG. 2: 68 and 95% C.L. constraints in the Gs E− G
s M plane from data from this apparatus ([11, 12] and this Letter). Var-ious theoretical predictions are plotted with published uncer-tainty estimates, when available. The 1-σ bands (a quadra-ture sum of statistical and systematic errors) and central val-ues (dashed lines) from the new results alone are also shown.
Assuming a pure isoscalar 0+ → 0+ transition, AHe NS
is completely independent of nuclear structure and de-termined purely by electroweak parameters. D-state and isospin admixtures and meson exchange currents are neg-ligible at the level of the experimental fractional accu-racy of ∼ 3% [13]. For our kinematics (Eb=2.75 GeV,
hQ2i = 0.077 GeV2) we obtain AHe
NS= +6.37 ppm.
Electromagnetic form factors from a phenomenolog-ical fit to the world data at low Q2 [14] were used
to calculate AH
NS, with uncertainties governed by data
near Q2∼ 0.1 GeV2. The value used for GγnE = 0.037, with a 10% relative uncertainty based on new data from the BLAST experiment [15]. For our kinematics (Eb=3.18 GeV, hQ2i = 0.109 GeV2) we obtain AHNS =
−1.66 ± 0.05 ppm. This includes a contribution from the axial form factor GZ
A, and associated radiative
cor-rections [16], of −0.037 ± 0.018 ppm.
Comparing our results to the theoretical expecta-tions, we extract Gs
E = 0.002 ± 0.014 ± 0.007 at Q2 =
0.077 GeV2and Gs
E+ 0.09GsM = 0.007 ± 0.011 ± 0.004 ±
0.005 (FF) at Q2= 0.109 GeV2
, where the uncertainties in the nucleon electromagnetic form factors govern the last error. Figure 2 displays the combined result for these and our previous measurements [11, 12], taken with hQ2i
between 0.077-0.109 GeV2. The requisite small extrapo-lation to a common Q2 = 0.1 GeV2 was made assuming
that Gs
E ∝ Q2 and that GsM is constant. The values
Gs
coefficient =−0.87) are obtained. The results are quite insensitive to variations in GZ
A, as evidenced by the
neg-ligible change induced by an alternate fit similar to that in [17], where GZ
A is constrained by other APV data.
Figure 2 also displays predictions from selected theo-retical models [18–23]. Those that predict little strange quark dynamics in the vector form factors are favored [22, 23]. A global fit to all low-Q2 measurements of Gs
E and
Gs
M, similar to that performed in [17], finds that other
measurements [6, 9, 10] which had suggested non-zero strangeness effects are consistent, within quoted uncer-tainties, with our results at Q2 = 0.1 GeV2. Due to the
improved statistical precision and lower GZ
Asensitivity of
our result, adding these other measurements in a global fit does not alter our conclusions.
In summary, we have reported the most precise con-straints on the strange form factors at Q2 ∼ 0.1 GeV2.
The results, consistent within errors with other APV
measurements, leave little room for observable nucleon strangeness dynamics at low Q2. Theoretical
uncertain-ties, especially regarding the assumption of charge sym-metry [24], preclude significant improvement to the mea-surements reported here. While future experiments will pursue the search for non-zero strangeness at higher Q2,
it now becomes a challenge for various theoretical ap-proaches to reconcile these results and enhance our un-derstanding of nucleon structure.
We wish to thank the entire staff of JLab for their efforts to support this experiment. This work was sup-ported by The Southeastern Universities Research Asso-ciation, Inc. under U.S. DOE Contract No. DE-AC05-84150, and by the DOE and NSF (United States), the INFN (Italy), and the CEA (France).
[1] D.B. Kaplan and A. Manohar, Nucl. Phys. B 310, 527 (1988).
[2] R.D. McKeown, Phys. Lett. B 219, 140 (1989). [3] C.Y. Prescott et al., Phys. Lett. B 77, 347 (1978). [4] M.J. Musolf et al., Phys. Rep. 239, 1 (1994). [5] Ya.B. Zel’dovich, Sov. Phys. JETP, 36, 964 (1959). [6] D.T. Spayde et al., Phys. Lett. B 583, 79 (2004). [7] K.A. Aniol et al., Phys. Lett. B 509, 211 (2001);
K. A. Aniol et al., Phys. Rev. C 69, 065501 (2004). [8] F.E. Maas et al., Phys. Rev. Lett. 93, 022002 (2004). [9] F.E. Maas et al., Phys. Rev. Lett. 94, 152001 (2005). [10] D.S. Armstrong et al., Phys. Rev. Lett. 95, 092001
(2005).
[11] K.A. Aniol et al., Phys. Rev. Lett. 96, 022003 (2006). [12] K.A. Aniol et al., Phys. Lett. B 635, 275 (2006). [13] M.J. Musolf, R. Schiavilla and T.W. Donnelly, Phys. Rev.
C 50, 2173 (1994); S. Ramavataram, E. Hadjimichael and T.W. Donnelly, Phys. Rev. C 50, 1175 (1994); M.J. Mu-solf and T.W. Donnelly, Phys. Lett. B 318, 263 (1993). [14] J. Friedrich and Th. Walcher, Eur. Phys. J. A 17, 607
(2003).
[15] V. Ziskin, PhD. thesis, MIT, 2005.
[16] S.-L. Zhu et al., Phys. Rev. D 62, 033008 (2000). [17] R. Young et al, Phys. Rev. Lett. 97, 102002 (2006). [18] N.W. Park and H. Weigel, Nucl. Phys. A 451, 453 (1992). [19] H.W. Hammer, U.G. Meissner, and D. Drechsel, Phys.
Lett. B 367, 323 (1996).
[20] H.W. Hammer and M.J. Ramsey-Musolf, Phys. Rev. C 60, 045204 (1999).
[21] A. Silva et al., Phys. Rev. D 65, 014016 (2001). [22] R. Lewis et al., Phys. Rev. D 67, 013003 (2003). [23] D.B. Leinweber et al., Phys. Rev. Lett. 94, 212001
(2005); D.B. Leinweber et al., Phys. Rev. Lett. 97, 022001 (2006).
![FIG. 2: 68 and 95% C.L. constraints in the G s E − G s M plane from data from this apparatus ([11, 12] and this Letter)](https://thumb-eu.123doks.com/thumbv2/123doknet/13999569.455823/4.918.482.830.86.425/fig-c-l-constraints-plane-data-apparatus-letter.webp)
