Analysis of A Proposed 'First-Generation' Physical Map of the Human Genome
Alan Kaufman and James Orlin
1
Analysis of a proposed 'first-generation'
physical map of the human genome
Alan Kaufmanl
1 2and James Orlinl,
2,
3*
1
Whitehead Institute/fIIT Center for Genome Research, and
2Operations
Research Center, and
3Sloan School of Management Massachusetts Institute of
Technology, Cambridge MA 02139.Abstract
Cohen and colleagues [1] recently described a project to characterize a human yeast artificial chromosome (YAC) library and offered a 'proposed data analysis strategy' that was said to yield a physical map covering 87% of the human genome. The authors provided no analytical evaluation to test the validity of their novel strategy for constructing 'paths' in the genome. We have now examined the proposed method in detail. Analytical studies show that most paths with at most two YACs or spanning less than 5 cM are valid, but most paths involving four or more YACs or spanning 5 cM or more are invalid. After restricting the map to paths with a high probability of being valid, we conclude that the remaining map properly covers at most 36% of the genome.
3
Cohen et al. [1] recently reported the results of their efforts to construct a 'first generation' physical map of the human genome, based on the analysis of a large-insert yeast artificial chromosome (YAC) library. Briefly, the physical mapping data involved screening the 33,000-clone CEPH mega-YAC library by two different methods, STS content mapping and Alu-PCR probe hybridization. In the first method, 2100 genetically-mapped sequence-tagged sites (STSs) [2] were screened against the YAC library (with half of the STSs screened completely and half screened partially to obtain 1-2 positives). In the second method, Alu-PCR products were prepared from 6900 individual YACs and were screened by hybridization against spotted Alu-PCR products from a subset of 25,000 of the YACs and from monochromosomal hybrid cell lines. (In addition, many YACs were also subjected to hybridization-based 'fingerprinting' [3], but these data played only a minor role in the analysis and do not significantly affect the coverage; we omit them in the discussion below.)
Based on these data, Cohen et al. [1] offered a 'proposed data analysis strategy' that was said to yield a physical map covering 87% of the human genome. The proposed data analysis strategy involved creating paths between STSs. A path of length k between two STSs, sl and s2, is defined as a series of
YACs, yl, y2, ..-, yk such that (1) s lies in yl and s2 lies in yk by STS content
mapping and (2) for each step (yi, yi+l), at least one of the two YACs was used as an Alu-PCR probe and hybridized to the other YAC. Paths of length 1
correspond to traditional STS content mapping, while longer paths depend on the Alu-PCR hybridization data. A chromosomally allowable path is defined to be one with the property that (1) the starting and ending STSs, sl and s2, lie on the same chromosome c, and (2) each yi that was used as an Alu-PCR probe either gave no signal when hybridized to the monochromosomal hybrid panel or hybridized to a set of chromosomes that included chromosome c. (N.B. For
4
technical reasons, chromosomal assignments were not always unique: 49% could be assigned to a single chromosome, 18% hybridized to multiple chromosomes, and 33% could not be assigned to any chromosome.)
The first generation physical map proposed in [1] was defined to be the set of all chomosomally allowable paths of length < 7 connecting pairs of STSs with genetic distance < 10 cM. The authors offered no experimental or analytical justification for the choice of path length nor any analysis to suggest that most such paths are correct. They simply noted that as longer paths are allowed, the coverage of the genome increased. With paths of length one, three, five, and seven, the strategy covered 11%, 30%, 70% and 87%, respectively, of the total genetic length of the genome.
There is a serious issue to be addressed: Using the proposed approach, utterly random data might also appear to cover the genome. Specifically, it is well-known in random graph theory [4] that, in certain random structures, paths of bounded length suffice to connect essentially all pairs of points. This
phenomenon has recently gained popular attention through the award-winning play, "Six Degrees of Separation", in which it is asserted that any two people in the world can be connected through a path of at most six acquaintances. It is important to evaluate whether the same phenomenon accounts for the
apparently complete coverage of human genome.
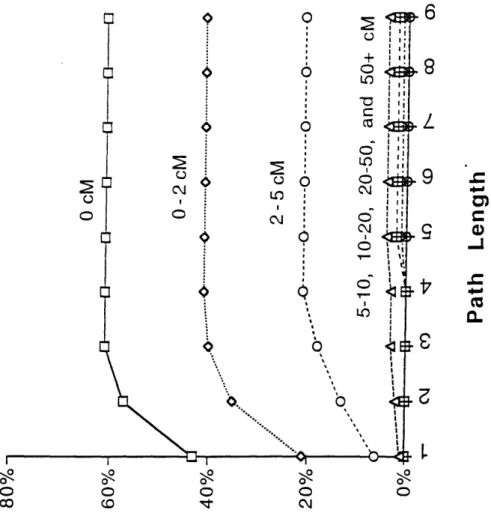
We set out to evaluate the proposed data analysis strategy using the data from the March 30, 1994 CEPH data release. We first constructed the minimum-length chromosomally allowable path [5] connecting every pair of STSs located on the same chromosome--regardless of the genetic distance between them. Figure la shows the proportion of STSs that could be connected, as a function of the path length and the genetic distance between them. We were interested to
5
determine what fraction of these paths resulted from spurious random connections.
A simple way to determine the proportion of false connections is to consider apparent short paths between STSs separated by > 50 cM. Such paths must surely be spurious inasmuch as the average YAC length is only 1 Mb, corresponding to only about 1 cM in the human genome. The proportion of such distant STSs connected by chromosomally allowable paths of length 1, 3, 5, and 7 is 0.05%, 2%, 18% and 61%. In particular, the curve rises dramatically for path lengths exceeding four - indicating that random connections dominate at these lengths. Interestingly, the proportion of connected STSs at distances 5-10 cM, 10-20 cM, and 20-50 cM was no higher than for STSs at distances 2 50 cM. This suggested that most paths connecting STSs at distances > 5 cM are also false.
To test whether these apparent paths were nothing more than would be expected in an equivalent random graph [4], we performed a simple
randomization experiment. We left unchanged the genetic map, the STS content data, and the chromosomal assignment of Alu-PCR probes, but randomized the hybridization results of the Alu-PCR probes against the YAC library, preserving only the correct number of hits for each probe. Consider, for example, an Alu-PCR probe that hybridized to chromosomes 3 and 7 and detected four YACs in the library. In the randomized data, it was still assigned to the same
chromosomes but the four YACs that it detected were selected using a random number generator. With these random data, we again constructed minimum length paths between all intra-chromosomal pairs of STSs following the strategy of Cohen et al. (Figure b). Paths of length 1 remain unchanged in the
randomized data, since they depend only on the STS content data. However, longer paths are entirely spurious.
6
Interestingly, STS pairs at > 5 cM show the same degree of connectivity in the random data as in the real data-confirming our suspicion that spurious connections are the principal mechanism linking such STSs. By contrast, STS pairs at < 5 cM show significantly higher connectivity for path length < 3 in the real data than in the randomized data, with the difference attributable to valid short paths between nearby STSs.
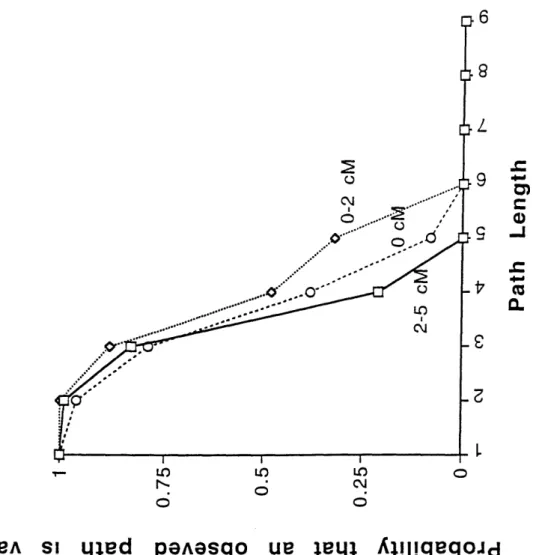
Based on this analysis, it is possible to estimate the proportion of STSs connected by valid paths (Figure 2) and the probability that a path of a given length is valid (Figure 3). The results indicate that paths of length < 2 connecting STS at < 5 cM are mostly valid, whereas paths having length > 4 or joining STSs at 2 5 cM are generally spurious. Considering only paths of length < 2
connecting STSs within 5 cM, the paths in the CEPH-Genethon data cover about 36% of the genetic length of the human genome. (The percentage coverage is defined as the proportion of total centiMorgans lying between connected STSs. This may somewhat overestimate the actual proportion of the physical length covered, inasmuch the covered genetic intervals of any given size would be expected to be biased to those with enhanced recombination relative to physical distance.)
In summary, the 'proposed data analysis strategy' of Cohen et al. [1] works well when restricted to short paths, but is unreliable for longer paths. Restricting the physical map to analytically valid paths, the CEPH-Genethon physical map is estimated to cover about one-third of the human genome. To obtain reliable coverage of the entire human genome using the strategy of Cohen et al. [1], one would require many more genetically mapped (or otherwise ordered) STSs. Not withstanding this revised assessment, the CEPH-Genethon data represent a large and impressive resource of great value to the human genetics community. It will clearly play an important role in the assembly of a comprehensive physical map.
7
References and Notes
[1] D. Cohen, I. Chumakov, and J. Weissenbach, Nature, 366, 698 (1993). [2] J. Weissenbach et al., Nature, 359, 794 (1992).
[3] C. Bellanne-Chantelot et al. Cell, 70, 1059 (1992).
[4] B. Bollobas, Random Graphs. Harcourt Brace Jovanovich, 1985.
[5] R. Ahuja, T. Magnanti and J. Orlin, Network Flows. Prentice-Hall, 1993. [6] We thank Daniel Cohen, Ilya Chumakov and Jean Weissenbach for sharing this valuable data with us and the scientific community at large. We thank Eric Lander for suggesting the use of random graphs and for comments on the manuscript and David Page, Leonid Kruglyak and Lincoln Stein for helpful discussions. This work was supported in part by NIH grant HG00098.
8
Figure Legends
Figure 1. Cumulative proportion of connected STS pairs, by inter-STS distance and path length, for (A) real data and (B) randomized data. Minimal paths were constructed between all intra-chromosomal pairs of STSs. STSs hitting no YACs were excluded, as these could never form paths.
Figure 2. Estimated cumulative proportion of valid STS connections, by inter-STS distance and path length. The proportion of spuriously connected STS pairs for each path length was estimated based on the "> 50 cM" curve in Figure la. This proportion was subtracted from the observed proportion of connected STS pairs to yield the estimated proportion of truly connected pairs.
Figure 3. Estimated probability that a path connecting two STSs is valid, by inter-STS distance and path length. The probability a path is valid was approximated by max[(po-ps)/po, 0], where Po is the observed proportion of connected STSs
and Ps is the proportion of spuriously connected STSs estimated from the randomized data. The results are similar if ps is estimated from the "> 50 cM" curve in Figure la.
Figure 1 6 = 5_ e-... 0X L 0 0 LO o L o LO C\j Beep pez!tuopueJ
:SJ!ed SIS paoeauuoo o uo!JodoJd
O *X) V c r - O Ln . c L -L. m 0, -J Cl
n
. 0 0 0 0 LO o 0O 0 N- 10 C j elep lenioe:sJ!ed SS paalouuo3 o Uo!JodoJd
o o o To . .i L
Figure 2 C I
6
1o
II i6
I Ib
0 a Co 0LO 0o To L,b
6
89
L
-Jb
I.
0 0 0 0 c0 I' c:sJ!ed SIS
elep enoe
paloeuuoo o uo!qjodoJd an.L
0 0 CN 0 Ou o 0
Figure 3 n o Ccl