Towards compact ultralow phase noise lasers and microwave signals based on new approaches
Texte intégral
Figure


Documents relatifs
Integrated analysis of microstructures, crystal preferred orientations, chemical compositions, and equili- brium temperatures of Fernando de Noronha mantle xenoliths reveals that
Ils voulaient vivre debout, et en étaient fiers Ils refusaient d’emprunter le chemin de misère Celui où trainent serfs, esclaves et pauvres hères.. Ils savaient que très
3 and 3 k indicate that in recNcPDI-vaccinated mice, intraperitoneal as well as intra-nasal immunization and subsequent challenge infection also resulted in significant increase of
The parameter D can be set to a higher value to achieve the required entropy rate at the output of the TRNG and at the same time, all the output bits of the generator can be used
The expected rate equals to the sum of a constant laser drift measured prior to the chirp and a linear frequency ramp calculated using the τ 0 and ∆ν RF. The unavoidable
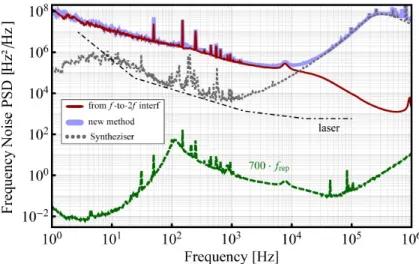
Frequency-noise power spectral density versus Fourier frequency of the laser stabilized on a 2 km imbal- ance Michelson interferometer with an antivibration table (dark curve),
By using an on-chip Kerr comb source consisting of an active nonlinear micro-ring resonator (MRR) with an FSR spacing of either 200GHz or 49GHz, in combination with
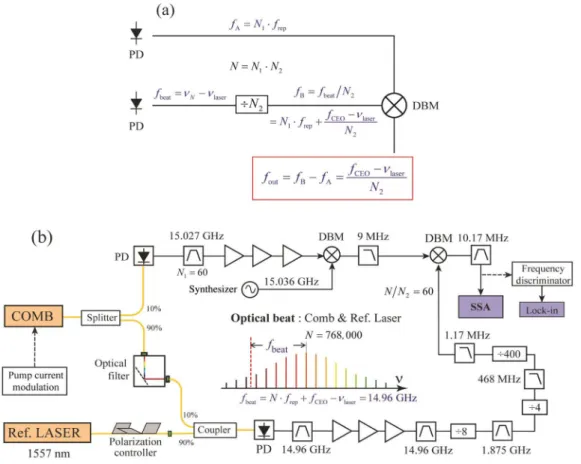
Fig.1 shows the ultra-low phase noise 12 GHz signal generation setup. A fast seft-starting Er-doped fiber-based optical frequency comb with 250 MHz repetition rate
