HAL Id: hal-02133843
https://hal.umontpellier.fr/hal-02133843
Submitted on 1 Oct 2020
HAL is a multi-disciplinary open access
archive for the deposit and dissemination of
sci-entific research documents, whether they are
pub-lished or not. The documents may come from
teaching and research institutions in France or
abroad, or from public or private research centers.
L’archive ouverte pluridisciplinaire HAL, est
destinée au dépôt et à la diffusion de documents
scientifiques de niveau recherche, publiés ou non,
émanant des établissements d’enseignement et de
recherche français ou étrangers, des laboratoires
publics ou privés.
Deformation, Annealing, Melt-Rock Interaction, and
Seismic Properties of an Old Domain of the Equatorial
Atlantic Lithospheric Mantle
Shiran Liu, Andrea Tommasi, Alain Vauchez, Maurizio Mazzucchelli
To cite this version:
Shiran Liu, Andrea Tommasi, Alain Vauchez, Maurizio Mazzucchelli.
Deformation, Annealing,
Melt-Rock Interaction, and Seismic Properties of an Old Domain of the Equatorial Atlantic
Litho-spheric Mantle.
Tectonics, American Geophysical Union (AGU), 2019, 38 (4), pp.1164-1188.
Deformation, Annealing, Melt
‐Rock Interaction,
and Seismic Properties of an Old Domain
of the Equatorial Atlantic
Lithospheric Mantle
Shiran Liu1,2 , Andréa Tommasi1 , Alain Vauchez1 , and Maurizio Mazzucchelli3
1Géosciences Montpellier, CNRS and Université de Montpellier, Montpellier, France,2Key Laboratory of Orogenic Belts
and Crustal Evolution, School of Earth and Space Sciences, Peking University, Beijing, China,3Dipartimento di Scienze
Chimiche e Geologiche, Università di Modena e Reggio Emilia, Modena, Italy
Abstract
We analyzed a set of mantle xenoliths from the Fernando de Noronha archipelago to constrain the roles of deformation, cooling, annealing, and melt percolation in the evolution of the mantlelithosphere of the equatorial Atlantic. The peridotites are dominantly lherzolites with coarse granular or porphyroclastic microstructures. Equilibrium temperatures range between 850 and 1,000 °C. Olivine crystal preferred orientations (CPO) have mainly orthorhombic patterns characterized by clear [100] and [010] point maxima or afiber‐[100] tendency; these patterns imply deformation by dislocation creep with dominant activation of the [100](010) slip system. Olivinefiber‐[010] patterns are less common; they probably result from recrystallization or melt‐rock interaction. Annealing after deformation partially recovered the microstructures and reduced the olivine CPO strength. Pyroxene CPOs often have weak consistency with olivine CPO, implying post‐deformation refertilization. Chemical compositions are systematically more fertile than those from abyssal peridotites from the Mid‐Atlantic Ridge. These compositions together with the microstructures suggest two stages of melt‐rock interaction. An early refertilization of the base of the lithosphere due to continuous percolation of small melt fractions and later, more important, but local chemical changes (both refertilization and dunitization) as well as recrystallization due to reactive melt percolation likely associated with the Cenozoic volcanism. By comparing the calculated seismic properties with existing seismological data we argue that the moderate seismic anisotropy displayed by the Fernando de Noronha mantle xenoliths likely records past horizontal asthenosphericflow parallel to the spreading direction frozen in the lithospheric mantle as the plate cooled.
Plain Language Summary
We studied a series of mantle rocks carried to the surface by the recent (<10 Myr old) volcanism that formed the island of Fernando de Noronha on the top of100‐Myr‐old crust in the equatorial Atlantic. The study of this natural sampling of a deep section (50–70‐km depth) of an oceanic plate brings constraints on the processes involved in the construction and evolution of an oceanic plate as it cools and thickens with time. We analyzed the composition, microstructures, and orientations of the minerals that compose these rocks. The results imply that most of the deformation occurred at the base of the plate in response to the difference in motion between the plate and the convecting mantle. The resulting microstructures and crystal orientations were then frozen in the plate by cooling. Our data also support a change in the composition of the rocks that compose the mantle section of the oceanic plate, after their incorporation in the plate, by reactions with percolating magmas that most often increased their fertility (capability to melt).
1. Introduction
Oceanic lithospheric mantle is generally believed to develop by progressive cooling and accretion of asthenospheric mantle as the plate ages (Turcotte & Schubert, 2014). It should therefore have a simple structure, with ridge‐related processes recorded in its shallow levels and frozen asthenospheric compositions, microstructures, and crystal preferred orientations in its deep portions, unless disturbed by plume‐related processes (Hess, 1964; Rümpker et al., 1999; Tommasi, 1998). However, reactive percolation of melts from the asthenosphere into the base of the lithospheric mantle and their crystallization may progressively modify the composition and microstructures of the peridotites in the lithospheric mantle (e.g., Le Roux et al., 2007, 2008; McKenzie, 1989). If this process occurs in a continuous manner as the
• The lower section of the equatorial Atlantic mantle lithosphere is dominantly fertile
• Microstructures and textures record high‐temperature deformation followed by variable degrees of annealing and melt‐rock interaction • Thermal models and seismic
anisotropy imply a 75–90‐km‐thick plate with frozen CPO formed by horizontal shear in the asthenosphere Supporting Information: • Supporting Information S1 • Table S1 • Table S2 • Table S3 • Table S4 Correspondence to:
S. Liu and A. Tommasi, [email protected];
Citation:
Liu, S., Tommasi, A., Vauchez, A., & Mazzucchelli, M. (2019). Deformation, annealing, melt‐rock interaction, and seismic properties of an old domain of the equatorial Atlantic lithospheric mantle. Tectonics, 38, 1164–1188. https://doi.org/10.1029/2018TC005373
Author copy of the final (peer-reviewed) version
Article published in Tectonics in April 2019
Please, for citing refer to: Liu, S., Tommasi, A., Vauchez, A., Mazzucchelli, M. (2019) Deformation,
annealing, melt-rock interaction, and seismic properties of an old domain of the equatorial Atlantic
lithospheric mantle. Tectonics , 38, doi: 1029/2018TC005373
plate cools and thickens, it may affect most of the oceanic plate thickness, leading to compositions different to those of the shallow levels. Yet the characterization of the oceanic lithospheric mantle composition and microstructures is largely based on the analysis of abyssal peridotites and ophiolites, that is, on sampling of shallow sections of the plates. Direct sampling of the deep sections of oceanic lithospheric mantle is limited to xenoliths brought by oceanic islands volcanism.
Here we investigate a set of mantle xenoliths from the Fernando de Noronha (FN) islands (Figure 1), which sample the lithosphere of an old domain of the equatorial Atlantic. The equatorial Atlantic was the last sec-tion of the Atlantic to open at the Albian–Aptian boundary (~113 Ma), connecting the central Atlantic and South Atlantic Oceans. This last stage of separation between the African and South American plates is accompanied by EW strike‐slip motion in a series of fracture zones, such as the St. Paul, Romanche, and Chain Fracture Zones (Heine et al., 2013; Moulin et al., 2010; Nemčok et al., 2013). We analyze the micro-structures, compare comparing the composition of the xenoliths to data on abyssal peridotites collected from Mid‐Atlantic Ridge (Warren, 2016, and references therein) and correlate the seismic properties calculated based on the composition and crystal preferred orientation of the xenoliths to seismological data in the Atlantic (Gaherty et al., 2004; Harmon et al., 2018; Kendall et al., 2017; Silveira & Stutzmann, 2002), aiming to elucidate the physical and chemical processes that shaped the lithosphere mantle of a low‐spreading rate oceanic plate, which had a significant strike‐slip component of deformation during the early stages of evolu-tion and was later affected by a hot spot‐type volcanism, which formed the FN islands.
2. Geological Background
The Fernando de Noronha (FN) archipelago is located in the west equatorial Atlantic just south of the Chain fracture zone, approximately 350 km away from the northeast Brazil coastline (Figure 1). The islands formed onto 100–105‐Ma‐old oceanic crust (early‐late Cretaceous boundary) based on magnetic anomaly data (Nemčok et al., 2013, and references therein).
The archipelago forms the easternmost tip of an E‐W volcanic alignment that extends from the Ceará coast in northeast Brazil (the Mecejana volcanicfield; Figure 1). The few age data available for this volcanic align-ment show no regular progression, but eruption ages tend to be younger eastward. The Mecejana volcanics on the Brazilian coast yield K‐Ar ages between 26 and 44 Ma (Mizusaki et al., 2002), whereas volcanism in
Figure 1. Topographic map of the equatorial Atlantic with major structural features and oceanic crust ages based on magnetic anomaly data. Sampling location is indicated by the red star. The topographic map is based on GTOPO30 DEM data generated in Jules Verne Voyager (http://jules.unavco.org/) using Generic Mapping Tools (GMT; http://gmt.soest.hawaii.edu/; Wessel & Smith, 1991). Oceanic crust ages and COB are modified after Nemčok et al. (2013). COB: Continent‐Ocean Boundary.
Fernando de Noronha has whole‐rock, feldspar, nepheline, and kaersutite Ar‐Ar ages between 12.5 and 6 Ma (Perlingeiro et al., 2013).
The volcanism in Fernando de Noronha is characterized by multiple eruption episodes. Ar‐Ar dating high-lights three groups of ages for the outcropping lavas (Perlingeiro et al., 2013). The Remédios formation, which forms the bulk of the island, yields older ages between 12.5 ± 0.1 and 9.4 ± 0.2 Ma. The basanite and alkaline basalt lavaflows of the São José formation, which host the mantle xenoliths studied here, have ages of 9.5 ± 0.4 and 9.0 ± 0.1 Ma. The nephelinites of the Quixaba formation are younger; they erupted between 6.2 ± 0.1 and 1.3 ± 0.1 Ma.
Previous studies on FN mantle xenoliths coupled petrographic and geochemical analyses aiming to charac-terize the effect of the Fernando de Noronha mantle plume on the lithospheric mantle (Kogarko et al., 2001; Rivalenti et al., 2000). These studies revealed two textural groups: a protogranular or granoblastic group, which predominates, and a minor porphyroclastic group. The two groups show similar equilibrium tempera-tures, in the range 980–1150 °C (Rivalenti et al., 2000). Both studies proposed that the lithospheric mantle beneath Fernando de Noronha has been subjected to variable degrees of metasomatism. Yet the two studies infer different metasomatic agents: carbonated melts for Kogarko et al. (2001) or melts with an EMII‐type isotopic signature, similar to the Remedios lavas for Rivalenti et al. (2000). This earlier study also presented evidence for reactive meltflow leading to changes in the mode (clinopyroxene or olivine enrichment at the expenses of orthopyroxene) and marked enrichment in incompatible elements, which is more developed in porphyroclastic peridotites.
3. Methods
3.1. Sampling
The studied xenoliths were collected from basanites from the São José formation in the São José islet, in the north of the main island of Fernando de Noronha (3°49′39″S, 32°24′05″W). We have analyzed 21 new xeno-liths and 3 previously studied by Rivalenti et al. (2000). Most xenoxeno-liths are small (on average 3 cm of dia-meter), except 3, which have ~10 cm in diameter, but they are very fresh and devoid of evidence of major interaction with the host lava. Petrostructural analyses were performed on all samples. Mineral composi-tions were analyzed in 13 samples, selected as to ensure that all microstructural types were represented. 3.2. Electron‐Backscattered Diffraction Data Acquisition and Treatment
Crystallographic preferred orientations (CPOs) of olivine, pyroxenes, and spinel were measured by indexing of electron‐backscattered diffraction patterns in the SEM‐EBSD facility at Geosciences Montpellier, France. All thin sections were carefully polished before measurements. Data acquisition was performed using a JEOL JSM 5600 scanning electron microscope with 17‐kV acceleration voltage and 24‐mm working distance. We did electron‐backscattered diffraction (EBSD) mapping over the entire thin section (areas ≥2 × 3 cm2) with step sizes between 8 and 35μm, depending on grain size. Indexation rates ranged between 84% and 97%. During postacquisition data treatment, we eliminated inaccurate indexing points (MAD >1.3° and wild spikes, that is, single‐pixel results inconsistent with the surrounding data), corrected for rare olivine pseudo‐ symmetry misindexing, andfilled up nonindexed pixels with at least six coherent neighboring measure-ments with the average of the neighbors' orientations.
The CPO data analyses, that is, the calculation of the orientation distribution functions and of the misorien-tations, the computation of the strength and symmetry of the olivine CPO, the plotting of polefigures, and the quantification of the microstructure (grain size, shape, and orientation), were performed using the MTEX toolbox in MATLAB (http://mtex‐toolbox.github.io/; Hielscher & Schaeben, 2008; Bachmann et al., 2010; Bachmann et al., 2011). The orientation distribution functions were calculated using a“de la Vallée Poussin” kernel function with a half‐width of 10°. The CPO is presented as one crystallographic orien-tation per pixel in polefigures.
Thin sections were cut in random orientations, because most samples were small and the foliation and linea-tion were difficult to identify in most hand samples. However, all samples have well‐defined olivine CPO, with clear [100] and [010] alignments, which are always stronger than the [001] ones. Numerical models of olivine CPO evolution show that such olivine CPO forms in response to dominant activation of the [100](010) slip system (Tommasi et al., 2000). Thus, to facilitate comparison between samples, we rotated
the CPO of each sample to a similar orientation, in which the [100] axis of olivine is parallel to the E‐W direc-tion and the [010] axis of olivine is parallel to the N‐S direcdirec-tion of the pole figure.
The strength of the CPO was quantified using the dimensionless J index (Bunge, 1982). The J index for a ran-dom CPO is 1; it can reach up to 20 in natural peridotites, with a peak at 3–5 (Tommasi & Vauchez, 2015). We use the dimensionless BA index (Mainprice et al., 2014) to describe the olivine CPO symmetry. This index allows classifying the olivine CPO into three types: (i)fiber‐[010], defined by a [010] point concentra-tion and girdle distribuconcentra-tions of [100] and [001] (BA‐index <0.35); (ii) orthorhombic, characterized by ortho-gonal point concentrations of [100], [010], and [001] (0.35 < BA index <0.65); and (iii)fiber‐[100], defined by a point concentration of [010] and girdle distributions of [010] and [001] (BA Index > 0.65).
We used the grain detection method in MTEX (Bachmann et al., 2011) to identify the grains in the map. Grain boundaries were defined by misorientation angles between adjacent pixels higher than 15°. Grains composed by less than 10 pixels were not considered in the microstructural analyses, since grain shapes and intragranular misorientations are poorly defined for grains described by few pixels. The misorientation of each pixel relative to the mean orientation of the grain (M2M) and the grain orientation spread (GOS) were calculated using built‐in MTEX functions to quantify the intracrystalline orientation gradients, which are a proxy of the dislocation density. Both should decrease during dynamic and static recrystallization due to nucleation and grain boundary migration (Rollet et al., 2017). Area‐weighted M2M averages over the entire EBSD map are thus used to compare the degree of recrystallization between different samples. The sinuosity of grain shapes is quantified by the shape factor, which is the ratio between the actual perimeter of the grain and the perimeter of a circle with the same area. The shape factor should decrease in response to recrystallization, in particular during annealing, when decrease in grain boundary energy becomes the main driving force for grain boundary migration (Rollet et al., 2017).
3.3. Mineral Compositions andP‐T Calculations
Mineral compositions of olivine (ol), orthopyroxene (opx), clinopyroxene (cpx), and spinel were measured on a Cameca SX100 electron microprobe at the University of Montpellier, France. The experiments were car-ried out using a 20‐kV accelerating voltage and a 10‐nA current. For each sample, we analyzed rim and core compositions in three to four grains of olivine, orthopyroxene, clinopyroxene, and spinel.
Following Nimis and Grutter (2010), we used the two‐pyroxene geothermometer (Taylor, 1998) and the Ca‐ in‐opx geothermometer (Brey & Kohler, 1990; revised by Nimis & Grutter, 2010) to calculate equilibrium temperatures. Average rim and core equilibrium temperatures were calculated by averaging the tempera-tures calculated using three to four rim or core compositions of individual opx grains or opx‐cpx pairs for each sample. Since no reliable barometers are available for spinel‐facies peridotites, we chose 1.5 GPa (~46‐km depth) as the pressure to calculate the two thermometers. Uncertainty in the assumed pressure pro-duces ~10 °C variation per 0.5 GPa (~11 km).
3.4. Seismic Properties
Seismic properties were computed using the MTEX toolbox (Mainprice et al., 2011). The seismic properties of each sample were calculated using a Voigt‐Reuss‐Hill averaging, based on the CPOs and modal content of olivine, orthopyroxene, and clinopyroxene derived from the EBSD maps and on the single crystal elastic con-stant tensors of olivine, orthopyroxene, and clinopyroxene and their temperature and pressure derivatives (Abramson et al., 1997; Anderson et al., 1992; Chai et al., 1997; Isaak et al., 2006; Jackson et al., 2007; Sang & Bass, 2014). Average seismic properties for the lithospheric mantle beneath Fernando de Noronha were estimated by averaging the elastic constant tensors of all samples. For this, the CPO data were rotated into a common reference frame in which the olivine [100] and [010] maxima of all samples are parallel. In aligning the CPO data, priority was arbitrarily given for aligning the [010] axes in the N‐S direction, leading to some dispersion in the alignment of the [100] axes. Although it results from an arbitrary choice, the non-perfect alignment of the CPO data mimics the variations in the orientation of the lineation observed when mappingflow structures in peridotite massifs at the hundreds of meters to kilometers scale even when the entire massif records a single large‐scale deformation event (e.g., Frets et al., 2014). This average is therefore a realistic estimate of the maximum seismic anisotropy that could be produced at scales larger than the kilo-meter in the lithospheric mantle beneath Fernando de Noronha.
4. Results
4.1. Modal Compositions
Modal compositions were defined based on the area fraction of each mineral in the EBSD maps (Figure 2 and Table 1). All xenoliths are spinel‐facies peridotites. Most are lherzolites with olivine contents ranging from 50 to 75% and clinopyroxene to orthopyroxene ratios of 0.2 to 1. Three are harzburgites and one is a dunite. Previous sampling of mantle xenoliths in Fernando de Noronha by Rivalenti et al. (2000) also displayed pre-dominance of fertile lherzolites (Figures 2a and 2b); the similarity between the two samplings suggests that it is a characteristic feature of the FN xenoliths.
Comparison of the observed modal compositions to those predicted by different partial melting models (Figure 2b) indicates that many FN xenoliths have modal compositions inconsistent with a simple partial melting evolution. At least seven lherzolites show too high cpx/opx ratios relative to their olivine modal
Figure 2. Modal compositions and EBSD phase maps. (a) Olivine‐clinopyroxene‐orthopyroxene ternary diagram compar-ing with the modal compositions from Rivalenti et al. (2000). (b) Clinopyroxene/orthopyroxene versus olivine diagram. Modal composition evolutions predicted by isobaric partial melting models with an initial fertile modal composition of 55% ol, 28.5% opx, and 16.5% cpx are plotted for comparison (Baker & Stolper, 1994; Kostopoulos, 1991; Niu, 1997; Walter, 1999; Walter et al., 1995). Gray arrows represent cpx and opx crystallization at the expense of ol (refertilization reactions); black arrow represents ol crystallization at the expense of cpx and opx (dunitization reactions). EBSD phase maps illus-trate the spatial distribution of the mineral phases and microstructures in representative samples. White dashed line A‐B in 16FN40 EBSD map marks the location of the chemical variation profile across the recrystallized band presented in Fig. 10.
content. Three lherzolites with low olivine modal content (<60%) display too low cpx/opx ratios. Two harzburgites and the dunite show higher cpx/opx ratios than those predicted by the partial melting models for the same olivine modal content. These modal compositions may be explained by reactive melt percolation leading to either crystallization of orthopyroxene or clinopyroxene at the expense of olivine (refertilization reactions; represented by the gray arrows in Figure 2), or crystallization of olivine at the expense of pyroxenes (dunitization reactions; black arrow in Figure 2). Petrographic evidence for such reactions in the Fernando de Noronha peridotites encompasses (i) sinuous olivine‐pyroxene boundaries and (ii) cusp‐like shapes of pyroxenes when in contact with two olivine grains (cf. EBSD phase maps in Figure 2).
4.2. Microstructures
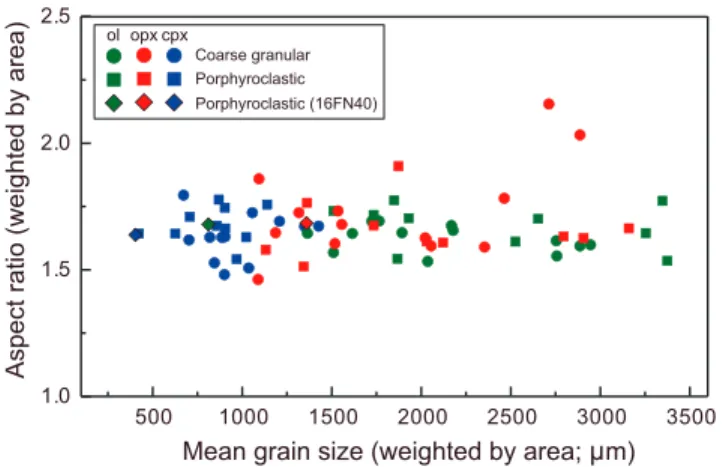
All studied xenoliths are coarse‐grained. Mean 2‐D grain sizes (diameter of the equivalent sphere with the same area as the grain in EBSD map, weighted by the grain area) of olivine and orthopyroxene range between 1 and 3.5 mm, except for the strongly recrystallized lherzolite 16FN40, which has smaller average olivine grain sizes (Figure 3). Clinopyroxene has smaller mean grain sizes between 0.4 and 1.5 mm. Average apparent (2‐D) aspect ratios (the ratio between the length and width of the equivalent ellipsoid on the plane of the thin section, weighted by the grain area) of the three phases have a similar range between 1.5 and 1.9, except for orthopyroxene in lherzolites 16FN33 and FN50, which have average apparent aspect ratios of 2.03 and 2.15 (Table 2 and Figure 3). Despite the slight elongation of the grains, many samples show no clear shape preferred orientation defining a foliation or a lineation (Figures 2 and 4).
Previous studies (Rivalenti et al., 2000) tried to correlate the microstructures with the chemical composi-tions and equilibrium temperatures. They divided FN xenoliths into a protogranular and a porphyroclastic group. In the present study, we combined optical observations (Figures 4 and 5) with quantitative data
Table 1
Rock Types, Microstructures, Modal Compositions, Thermometry, and Bulk‐Rock Mg#
Sample Rock Type Microstructure rex Fraction (%) Modal Composition (%) Thermometrya(°C) Bulk Rockb
Two‐pyroxene Ca‐in‐opx
Ol Opx Cpx Sp Rim Sd Core Sd Rim Sd Core Sd Mg#
16FN05 Du CG 91 7 6 2 1070 66 978 11 1009 3 1008 2 89.9 16FN07 Hz CG 90 8 3 <1 970 25 963 22 1008 0 1005 5 89.7 16FN35 Hz CG 83 12 4 <1 979 25 979 8 1020 4 1018 3 90.0 16FN01 Lz CG 64 23 12 1 840 22 863 28 908 6 937 8 89.0 16FN16 Lz CG 66 24 9 1 965 18 977 13 1004 4 1004 4 90.3 16FN18 Lz CG 57 34 8 2 948 5 949 16 1010 49 987 6 89.9 16FN21 Lz CG 55 32 13 <1 16FN29 Lz CG 69 16 14.81 1 864 52 868 21 889 28 911 17 89.6 16FN32 Lz CG 68 24 8 0.32 997 14 989 11 1020 7 1019 3 89.4 16FN33 Lz CG 62 28 9 <1 16FN38 Lz CG 67 22 10 1 16FN50 Lz CG 70 19 10 2 FN50c Lz CG 62 31 6 1 992 914 90.0 16FN02 Lz Porph 8 63 28 7 2 16FN06 Lz Porph 15 60 20 18 2 16FN09 Lz Porph 13 53 34 12 2 16FN12 Lz Porph 14 73 15 12 1 886 12 898 10 926 6 933 19 89.9 16FN19 Lz Porph 26 64 22 11 3 1002 116 993 95 960 9 965 8 88.3 16FN30 Lz Porph 18 59 21 18 2 815 22 849 23 895 5 899 6 89.7 16FN37 Lz Porph 12 74 14 11 <1 1000 19 993 12 1009 9 1010 5 89.4 16FN48 Lz Porph 13 68 21 11 <1 FN6c Lz Porph 15 67 19 12 2 948 1030 90.8 FN93–55c Hz Porph 14 79 19 2 <1 959 976 89.5 16FN40 Lz Porph 46 70 19 9 1 926 6 957 34 966 3 972 16 89.7
Note. Hz: harzburgite, Lz: lherzolite, Du: dunite, CG: coarse‐granular; Porph: porphyroclastic.
aTwo‐pyroxene thermometer (TTA98; Taylor, 1998), Ca‐in‐opx thermometer (Ca‐in‐opx; Brey & Kohler, 1990; revised by Nimis & Grutter, 2010). bEstimated from average chemical composition and modal contents (area.%) of each mineral. cSamples from Rivalenti et al. (2000).
Table 2 Micro structur al and CPO Para meters Deriv ed From EBSD Mapping Sample Micro structure rex Fracti on (%) EBS D Map Ste p Si ze (μ m) Olivin e Data Orthop yroxen e Data Clinop yroxen e Data Numb er of Grains Ana lyzed J Index J Inde x rex BA Inde x M2M (°) a Grain Size (μm) a Sha pe Factor a Asp ect Ra tio a Numb er of Grains Ana lyzed Gr ain Si ze (μ m) a Sha pe Factor a Aspect Rati o a Numb er of Gr ains Ana lyzed Grain Size (μm) a Aspect Rati o a 16FN05 CG 25 250 6.69 0 .69 1.87 2886 1.76 1.60 6 5 1 186 1 .77 1.65 16FN07 CG 28 407 3.93 0 .72 2.70 2167 1.69 1.67 7 3 1 088 1 .56 1.46 54 818.9 7 1.63 16FN35 CG 20 329 7.09 0 .61 2.81 1892 1.89 1.65 8 7 1 092 1 .80 1.86 184 702.3 1 1.62 16FN01 CG 35 219 5.65 0 .63 2.84 2178 1.90 1.65 11 7 2 054 1 .81 1.59 125 1055.9 5 1.73 16FN16 CG 15 414 4.69 0 .56 2.52 1724 1.73 1.69 12 2 1 316 1 .74 1.73 136 1036.4 4 1.51 16FN18 CG 16 631 3.91 0 .19 2.20 1364 1.82 1.64 23 2 2 022 1 .95 1.63 300 845.2 1 1.53 16FN21 CG 16 655 3.52 0 .29 1.85 1510 1.72 1.57 20 5 1 517 1 .78 1.60 204 900.3 2 1.48 16FN29 CG 30 281 5.37 0 .67 1.94 2945 1.74 1.60 7 1 2 463 1 .94 1.78 221 1427.0 3 1.67 16FN32 CG 30 797 3.36 0 .57 2.68 1615 1.92 1.64 11 3 1 556 1 .71 1.68 105 903.9 7 1.63 16FN33 CG 26 181 6.58 0 .49 1.85 2757 1.89 1.55 9 8 2 886 1 .69 2.03 121 1208.2 1 1.69 16FN38 CG 27 394 4.90 0 .75 2.25 2753 2.08 1.61 9 9 2 354 2 .14 1.59 180 1349.0 1 1.67 16FN50 CG 25 366 3.81 0 .47 2.83 2036 1.79 1.53 9 5 1 534 1 .70 1.73 165 885.2 2 1.63 FN50 b CG 13 142 6.84 0 .56 2.25 1764 1.98 1.69 6 6 2 712 2 .71 2.15 75 672.9 0 1.80 16FN02 Porph 8 27 300 8.92 4.04 0 .60 2.97 2526 2.09 1.61 15 4 2 906 2 .06 1.63 129 1021.9 3 1.63 16FN06 Porph 15 25 521 3.64 2.50 0 .58 3.27 1734 1.98 1.72 21 1 1 343 1 .90 1.51 271 969.0 4 1.54 16FN09 Porph 13 14 651 4.66 3.39 0 .49 3.93 1930 2.15 1.70 20 3 3 159 1 .99 1.66 347 903.1 8 1.75 16FN12 Porph 14 16 903 6.48 3.03 0 .47 4.89 3254 2.48 1.65 37 1 2 031 2 .69 1.61 556 904.4 4 1.66 16FN19 Porph 26 15 1529 3.97 2.74 0 .48 4.67 1510 2.24 1.73 48 9 1 734 2 .39 1.68 1101 626.2 9 1.64 16FN30 Porph 18 15 1313 4.45 2.33 0 .52 4.12 1849 2.10 1.77 51 4 1 363 1 .93 1.76 531 1138.8 2 1.76 16FN37 Porph 12 14 1051 4.63 3.01 0 .51 3.60 1867 1.96 1.54 12 3 1 131 1 .80 1.58 452 707.8 4 1.71 16FN48 Porph 13 23 645 8.32 3.28 0 .57 4.16 3347 2.55 1.77 15 8 2 795 2 .39 1.63 319 858.5 7 1.67 FN6 b Porph 15 11.5 356 9.71 4.28 0 .57 3.79 2652 2.13 1.70 18 5 1 873 2 .18 1.91 214 869.5 8 1.78 FN93 –55 b Porph 14 8.5 307 13.26 5.34 0 .45 5.98 3374 2.38 1.54 12 7 2 120 2 .25 1.61 149 422.6 4 1.64 16FN40 Porph 46 14 2728 2.55 3.44 0 .71 2.29 811 2.03 1.68 74 6 1 360 2 .18 1.68 930 403.9 0 1.64 Note . CG: coar se ‐granu lar, Porph : porphy roclas tic. Aspect ratio s are minim um values si nce most thin se ctions are cu t on rand om orien tation s and not on the xz plane. a Weig hted (by the gra in are a) av erages over the enti re EBS D map; app arent 2‐ D measu remen ts without topologi cal corre ction s. b Samp les from Rivalenti et al. (2 000).
derived from EBSD mapping (Table 2 and Figure 6) to analyze the microstructures of the xenoliths. This analysis reveals a continuous var-iation between two microstructural end‐members: coarse‐granular and coarse‐porphyroclastic. Although the variation between the two micro-structures is continuous, the quantitative analysis of the olivine intracrys-talline misorientations and of the shapes of olivine and ortho‐pyroxene (Figure 6) allows separating the samples into two groups.
Coarse‐granular peridotites correspond roughly to the protogranular tex-tures of Rivalenti et al. (2000). However, we choose not to use the term protogranular, because the later has, in its original definition (Mercier & Nicolas, 1975), a connotation of undeformed, which is not applicable to the samples studied here, as it will be shown by the analysis of the crystal preferred orientations. Coarse‐granular peridotites have equigranular microstructures (Figures 4a and 4b). Olivine shows dominantly polygonal grain shapes (Figures 2 [phase maps], 4a, and 4b), with straight to slightly curvilinear grain boundaries, often forming 120° triple junctions (Figure 5b), which indicate effective annealing. Pyroxenes have more irre-gular grain shapes (Figures 2 and 4b), but straight grain boundaries and 120° triple junctions are also locally observed (Figure 4a and arrows in Figure 5b) These grain shapes are associated with low shape factors (Figure 6), which range between 1.6 and 2.1 for olivine and 1.5 and 2.3 for orthopyroxene. A single outlier (FN50) has an orthopyroxene shape factor of 2.7, which may result from the low number of orthopyroxene grains analyzed due to the small size
Figure 3. Mean grain size (2‐D) versus aspect ratio of olivine (ol), ortho‐ pyroxene (opx), and clinopyroxene (cpx) for all analyzed peridotites; both are apparent (2‐D) values derived from EBSD data weighted by grain area. Aspect ratios are minimum values, since many thin sections were cut in random orientations and not on the plane normal to the foliation and par-allel to the lineation.
Figure 4. Thin‐section‐scale photomicrographs in cross‐polarized light of typical microstructures. (a, b) Coarse granular peridotites; white circle in (a) marks the pyroxene‐spinel aggregate shown in Figure 5a. (c–e) Porphyroclastic peridotites showing increasing degrees of recrystallization. (f) Strongly recrystallized porphyroclastic lherzolite 16FN40; dashed line A–B locates the profile along which the variations in mineral chemistry across the recrystallized band in 16FN40 were analyzed (Figure 10). The scale bar is the same for all photomicrographs.
of the sample. Olivine grains display weak intracrystalline misorientations, except in harzburgites 16FN07 and 16FN35, which have olivines with undulose extinction. The weak intragranular misorientation is con-sistent with the low average M2M values for olivine of coarse‐granular peridotites, from 1.85° to 2.84° (Figure 6a). Orthopyroxene and clinopyroxene occur most often dispersed in the thin sections, but some coarse‐granular peridotites (16FN05, 16FN18, 16FN29, and 16FN33) show opx‐cpx‐sp aggregates (Figures 4a and 5a) that might represent former garnets. Orthopyroxene may contain olivine inclusions. Undulose extinction or kinks are rare. Spinel grains have smaller grain sizes than the other major phases and irregular grain shapes.
Porphyroclastic peridotites (Figures 4c–4e) are characterized by more sinuous grain boundaries of both oli-vine and pyroxenes (higher shape factors up to 2.55 and 2.69 for olioli-vine and orthopyroxene, respectively; Figure 6) and higher average intragranular misorientations in olivine (average M2M≥ 3°; Figure 6). Some porphyroclastic peridotites show a bimodal distribution of olivine grain sizes and shapes, characterized by
Figure 5. Photomicrographs in cross‐polarized light illustrating characteristic features of both microstructures. (a) Opx‐ cpx‐sp aggregate in coarse granular harzburgite 16FN05. (b) Coarse granular lherzolite 16FN18 exhibiting straight grain boundaries with 120° junctions even between olivine and pyroxenes (white arrows). (c–e) Porphyroclastic lherzolites 16FN30, 16FN12, and 16FN19 showing olivine porphyroclasts with undulose extinction and subgrain boundaries (white arrows) as well as variable amounts of polygonal, strain‐free olivine neoblasts (black arrows), pyroxenes with exsolutions (gray arrows in (c) and (d)), and sinuous olivine‐pyroxene boundaries implying melt‐rock reaction. (f) Strongly recrys-tallized porphyroclastic lherzolite 16FN40 showing the assemblage of strain‐free ol + cpx ± opx neoblasts that characterize the recrystallized domains, as well as an opx porphyroclast (top left) with very sinuous grain boundaries. Scale bar is the same for all photomicrographs.
co‐existence of coarse olivine crystals (>1 mm) with serrated grain boundaries, undulose extinction, and common subgrain boundaries (porphyroclasts) and fine grains with more polygonal shapes and low intracrystalline misorientations (recrystallized grains; Figures 4c–4f and 5c–5f). The proportion of fine grains attains 46% in lherzolite 16FN40 (Figures 4f and 5f), resulting in low average M2M and shape factors for this sample (Figure 6). However, most porphyroclastic peridotites show low volumes of recrystallized olivine (Figures 4c–4e and Table 2). Fine‐grained olivine is often accompanied by local enrichment infine‐grained orthopyroxene and clinopyroxene (Figures 2 [phase maps] and 5d–5f). It is noteworthy that thefine‐grained domains are not arranged preferentially parallel to the elongation of the coarse olivine grains, marking a foliation. They either form irregular patches or vein‐like structures (Figures 4d–4f). Olivine porphyroclasts are often slightly elongated, marking a weak foliation (Figures 4c and 4d). They display undulose extinction and well‐developed subgrains (white arrows in Figures 5c–5e). Coarse orthopyroxene and clinopyroxene crystals have very irregular shapes and pyroxene‐olivine grain boundaries are highly sinuous, with pyroxenes often displaying cusp‐like shapes when in contact with two olivine grains (Figures 2 [phase maps], 4c–4f, and 5c–5f). Orthopyroxene porphyroclasts show weak undulose extinction. Exsolutions in pyroxenes are observed in several samples (gray arrows in Figures 5c and 5d). Small pyroxene crystals have interstitial shapes (Figures 5d–5f). Spinel is present as irregularly shaped grains usually associated with orthopyroxene and/or clinopyroxene (cf. EBSD phase maps in Figure 2).
4.3. Crystallographic Preferred Orientations
Crystallographic preferred orientations (CPOs) of olivine, orthopyroxene, and clinopyroxene for all stu-died xenoliths are shown in Figure 7. The relationship between CPO and shape‐preferred orientation could not be analyzed in many samples, because the foliation and lineation were not identified in hand samples or thin sections. However, in most samples, the olivine CPO is characterized by orthorhombic patterns with stronger maxima of [100] and [010] relatively to [001]. This qualitative observation is corro-borated by the analysis of the olivine CPO strength (J index) versus CPO symmetry (BA index) diagram, which shows that moderated or strong CPOs with orthorhombic to fiber‐[100] patterns predominate (Figure 8; data presented in Table 2). Porphyroclastic peridotites display dominantly orthorhombic pat-terns, but of highly variable intensity (J indexes between 2.6 and 13.3, with the strongly recrystallized lherzolite 11FN40 displaying the lowest value and coarse porphyroclastic lherzolites with very low volume fractions of recrystallized grains, the higher values, >8). Coarse‐granular peridotites show more homogeneous olivine CPO intensities (J indexes between 3.4 and 7.1), but more variable CPO symmetry. Orthorhombic patterns predominate, but some coarse granular samples show a tendency toward a fiber‐[010] pattern (16FN18, 16FN21) and others toward a fiber‐[100] pattern (16FN05, 16FN07, 16FN29, 16FN38).
In porphyroclastic peridotites, separate analysis of the CPO of recrystallized olivine crystals (discriminated based on their intracrystalline misorientation, grain orientation spread < 2.5°, and grain sizes <350μm)
Figure 6. Microstructural parameters derived from EBSD data. (a) Mean olivine shape factor versus mean intragranular misorientation (M2M; misorientation relative to the mean orientation of the grain in degrees). (b) Orthopyroxene shape factor versus olivine M2M. All values are area‐weighted averages over the entire EBSD map. The shape factor is the ratio between the actual perimeter of the grain and the perimeter of a circle with the same area as the grain.
shows that recrystallized grains have in general more dispersed CPO (gray crosses in Figure 8) than the bulk rock. The exception is the strongly recrystallized lherzolite 16FN40, in which 46% of the mapped area is composed by recrystallized grains and, by consequence, has a weak bulk CPO. However, although the bulk and recrystallized grains CPO strength is similar, the recrystallized grains show a
Figure 7. Crystal preferred orientations (CPO) of olivine, orthopyroxene, and clinopyroxene for all samples. Lower hemisphere stereographic projections. All pole figures are presented using the same color scale, which ranges between 0 and 8 multiples of a uniform distribution. Contours at 1 multiple of a uniform distribution interval. Black arrows indicate pyroxene CPOs correlated with the olivine ones and gray arrows mark those that are partially correlated (see text for definition of the correlation criterion). Very strong maxima in pyroxenes CPO for some samples result from the presence of a few coarse grains, in the analyzed area, these CPO are, by consequence, not statistically representative When <100 grains were measured, data are presented as points, instead of density‐contoured.
fiber‐[010] CPO, whereas the bulk CPO has a symmetry intermediate between orthorhombic andfiber‐[100]. In the remainder porphyroclastic peridotites, the variation in olivine CPO symmetry accompanying recrystallization is smaller: both the bulk rock and the recrystallized grains have orthorhombic patterns. Yet half of the samples show lower BA indexes for the recrystallized grains than for the bulk rock and only one sample is characterized by a higher BA index for the recrystallized grains (Figure 8).
Pyroxenes have on average more dispersed CPOs, which in many cases are not consistent with the olivine CPO (Figure 7). Correlated CPOs, sug-gesting coherent deformation of the three phases, are characterized by [001]pxmaxima parallel or subparallel to the [100]ol maximum and by
[100]opxand [010]cpxmaxima aligned with the [010]olmaximum (arrows
in Figure 7). Eight out of 13 of the coarse granular samples and 5 out of 11 of the porphyroclastic samples display well or partially correlated ortho-pyroxene and olivine CPO patterns. Nine out of 13 of the coarse granular samples and 4 out of 11 of the porphyroclastic samples show well or par-tially correlated clinopyroxene and olivine CPO patterns. Among these, 16FN05, 16FN12, 16FN29, and FN93‐55 display well‐correlated CPOs for all three phases. Pyroxenes with CPO noncorrelated with the olivine CPO, either have very weak CPO or one to two maxima of [001] at high angle to the olivine [100] maximum.
4.4. Mineral Compositions
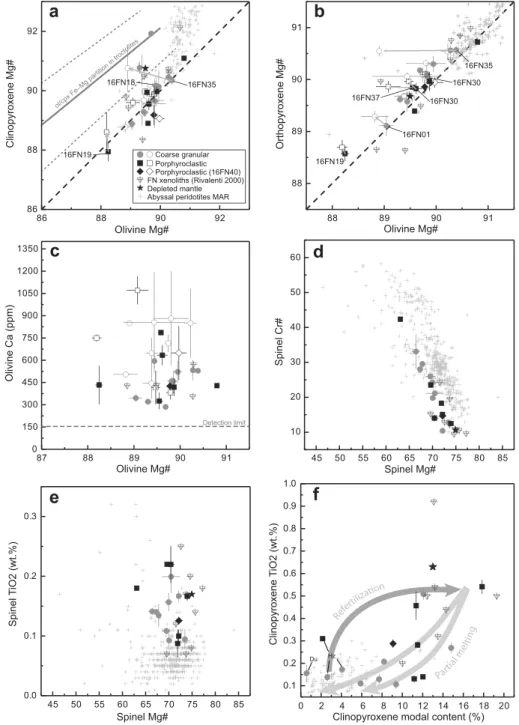
Chemical compositions of olivine, orthopyroxene, clinopyroxene, and spinel are presented in Figure 9. New data obtained in this study are listed in Table S1 in the supporting information. Data from Rivalenti et al. (2000) used in the present study are recalled Table S2 in the supporting information.
There is no clear relationship between the minerals' chemical compositions and the peridotites' microstruc-ture. Within the studied FN peridotites, the Mg# number [Mg# = 100 × Mg/(Fe + Mg), atomic ratio] of oli-vine, ortho‐pyroxene, and clinopyroxene ranges between 88.2–90.8 (average = 89.6), 88.6–90.7 (average = 89.9), and 88.0–91.9 (average = 89.8), respectively. Within a sample, grain cores show almost equal Mg# values for the three mineral phases (Figures 9a and 9b), except two samples (16FN29, FN50) that display higher Mg# values for clinopyroxene than for olivine. Rim compositions show a higher dispersion within a sample than core ones, but a few samples (16FN01, 16FN05, 16FN19, 16FN32) also show high bility in core compositions indicating stronger chemical disequilibrium. Many samples show a weak varia-tion in Mg# values between cores and rims. The olivine Mg# decreases and the orthopyroxene Mg# increases from core to rim in samples 16FN01, 16FN19, and 16FN30, whereas the olivine Mg# decreases from core to rim at constant orthopyroxene Mg# in samples 16FN35 and 16FN37 (Figure 9b). Most samples show very small core‐rim variations for the clino‐pyroxene Mg#, but samples 16FN19 and 16FN35 show higher Mg# in the rims. Comparison of the present data set to the mineral compositions in abyssal peridotites from Mid‐Atlantic Ridge (MAR; Warren, 2016) highlights that our samples display significantly lower Mg# for all three minerals. Moreover, Mg# values of clino‐pyroxene in abyssal peridotites tend to be higher than the Mg# of coexisting olivine, spreading between the 1:1 line and the Fe‐Mg partition trend between olivine, clinopyroxene, and melt determined based on data in oceanic troctolites (Lissenberg & Dick, 2008). There is no systematic variation of Ca content (ppm) in olivine as a function of olivine Mg#, but rims have higher and more variable Ca contents than the cores in all samples (Figure 9c).
The Cr number [Cr# = 100 × Cr/(Cr + Al), atomic ratio] of spinel rises with decreasing Mg# of spinel. Spinels in FN peridotites display a similar trend to the one from abyssal peridotites from the MAR (Warren, 2016), but have systematically lower Mg# at the same Cr# (Figure 9d). TiO2contents (wt %) in
spi-nel in FN peridotites range between 0.13 and 0.22%, marking a clear enrichment in Ti relatively to MAR abyssal peridotites (Figure 9e).
Figure 8. Olivine CPO symmetry (BA index) versus CPO strength (J index) in the Fernando de Noronha mantle xenoliths (data presented in Table 2). Similar data for mantle xenoliths from Canary Islands in the Atlantic Ocean (Vonlanthen et al., 2006) and French Polynesia in the Pacific Ocean (Tommasi et al., 2004) recalculated using MTEX with the same parameters as the present study (Table S3 in the supporting information) are shown for comparison. For the porphyroclastic peridotites, the CPO strength and symmetry of the recrystallized grains is compared to the one of the bulk rock. The variation in olivine CPO symmetry as a function of the BA index is illustrated at the top of the diagram.
Figure 9. Chemical compositions of major rock‐forming minerals in Fernando de Noronha peridotites. Error bars represent the chemical variation at the thin‐section scale. (a–c) Clinopyroxene Mg#, orthopyroxene Mg#, and olivine Ca content (ppm) versus olivine Mg#; solid symbols indicate core compositions and hollow symbols, rim compositions. (d and e) Spinel Cr# and TiO2content (wt %) versus Mg#. (f) Clinopyroxene TiO2content (wt %) versus modal content (%) compared to theoretical partial melting trends and to refertilization trends documented in Lherz by Le Roux et al. (2007). For comparison, data for FN mantle xenoliths from Rivalenti et al. (2000) are plotted on all diagrams. Mineral compositions for the depleted mantle (DM) and from abyssal peridotites from the Mid‐Atlantic Ridge (MAR) compiled by Warren (2016) are plotted on (a), (b), (d), (e), and (f). Fe‐Mg partition in troctolites from Lissenberg and Dick (2008) is plotted in (a). Gray arrows in (a) and (b) link core‐rim pairs referred to in the text. Data presented in Table S1 in the supporting information.
TiO2 contents in clinopyroxene in the lherzolites tend to increase
with clinopyroxene modal content up to approximately 10–12% of clino‐ pyroxene and to remain stable at approximately 0.5 wt % for higher clino‐pyroxene contents. Clinopyroxene in harzburgites (16FN07, 16FN35, FN93‐55) and in the dunite (16FN05) tends nevertheless to show higher or similar TiO2content (0.15–0.3 wt %) than lherzolites with <10%
cpx (Figure 9f).
As described in the previous section, the partially recrystallized porphyro‐ clastic sample 16FN40 contains afine‐grained domain with a vein‐like shape, composed of olivine, orthopyroxene, and clinopyroxene neoblasts (Figures 2, 4f, and 5f). In order to investigate the chemical variation between this fine‐grained domain and the coarse grains that compose the remainder of the sample, we performed a line profile across the recrystallized domain (location of the profile is indicated in Figures 2b and 4f). These analyses indicate that there is no clear variation in chemical compositions of orthopyroxene and clinopyroxene, but that the olivine composition changes (Figures 10a–10c). The data show a strong variabil-ity indicating disequilibrium at the millimeter scale, but there is a clear decrease of olivine Mg# and Ni content (ppm) and increase of Ca content (ppm) toward the center of thefine‐grained domain. A similar variation in composition is also observed between the cores and rims of coarse olivine grains outside the recrystallized domain.
4.5. Equilibrium Temperatures and Geotherm Estimation Comparison between the equilibrium temperature for the cores and the rims calculated using the two‐pyroxene geothermometer of Taylor (1998; TTA98) and the Ca in orthopyroxene (Ca‐in‐opx) of Brey and Kohler (1990) revised by Nimis and Grutter (2010) shows that the tem-peratures predicted by the two thermometers agree within the ±70 °C error bar of these thermometers for most samples (Figure 11); this sug-gests that the temperature estimates are reliable. Three core temperature values (16FN01, FN6, FN50) and three rim temperatures (16FN01, 16FN05, 16FN30) are slightly out of this range. These samples also show a high dispersion of the temperatures calculated using different grains in the sample, which further points toward chemical disequilibrium. In addition, 16FN19, which plots within the ±70 °C confidence area, shows a ±110 °C dispersion of the temperatures calculated with the TTA98 ther-mometer, consistently with the lack of equilibrium in cpx compositions in this sample (Figure 9a). We also recalculated equilibrium temperatures for the FN peridotites studied by Rivalenti et al. (2000) based on the pub-lished average pyroxenes compositions (Table S2 in the supporting infor-mation). This earlier data set defines a temperature range similar to the one obtained in the present study, but some samples show a marked dif-ference between the temperatures predicted by the two thermometers, suggesting chemical disequilibrium.
The values calculated using the TTA98 thermometer are considered as the equilibrium temperature following the recommendation by Nimis and Grutter (2010). There is no clear correlation between the equilibrium tem-peratures and the microstructures (Figure 11). The equilibrium tempera-tures for the cores and the rims are concentrated between 860 °C and 1,000 °C and 815 °C and 1,070 °C, respectively. The rim temperatures usually show higher dispersion within a sample. Samples equilibrated at temperatures≤950 °C have average rim temperatures similar or lower than core ones, denoting cooling. Samples equilibrated at >950 °C tend to display rim temperatures
Figure 10. Variations in olivine (a) Mg#, (b) Ni content (ppm), and (c) Ca content (ppm) along a profile across a recrystallized domain in strongly recrystallized porphyroclastic lherzolite (16FN40); core values in small (<350‐μm wide) grains. Average core and rim values outside the recrystal-lized domain are plotted for comparison.
similar to core ones, with exception of 16FN05, which shows a hotter rim temperature. However, the strong variability of rim temperatures in this sample indicates that rim compositions are not in equilibrium.
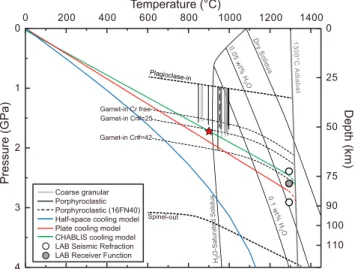
Geotherms estimated using three cooling models for a 100‐Myr‐old ocea-nic plate, i.e., the half‐space cooling, a plate model with an 80‐km‐thick plate and a 1300 °C mantle temperature (Turcotte & Schubert, 2014), and the CHABLIS model (Doin & Fleitout, 1996), are compared to the FN peridotites equilibration conditions in Figure 12. As no reliable bar-ometers are available for spinel‐facies peridotites, the equilibrium pres-sure range for the studied xenoliths is only defined by the occurrence of spinel and absence of plagioclase or garnet. These reactions depend on the fertility of the peridotite and on its Cr content (Klemme, 2004; O'Neill, 1981). Thus, P equilibrium conditions for FN peridotites are represented as bars, which length is a function of the sample spinel Cr#. All samples with equilibrium temperatures <900 °C have low spinel Cr# (≤15); the absence of garnet in these Al‐rich, Cr‐poor peridotites implies that they were equilibrated at pressures≤1.5 GPa (Figure 12). Samples equilibrated at temperatures >900 °C have slightly higher spinel Cr#, but with exception of FN6 (spinel Cr# = 42), all others have spinel Cr#≤ 30. The absence of garnet implies therefore that their equilibration depths remain shallow (<60 km; Figure 12). Considering the age of the crust of 100 Myr, the P‐T equilibration conditions of the FN peridotite xenoliths are betterfitted by the CHABLIS model, which predicts a 75‐ km‐thick lithosphere beneath FN. The plate model predicts a slightly cooler geotherm, which results in an approximately 85‐km‐thick litho-sphere. As expected for such old plate ages, the half‐space model strongly overestimates both cooling and the lithosphere thickness; its predictions cannot be reconciled with the FN peridotite equilibration conditions. 4.6. Seismic Properties
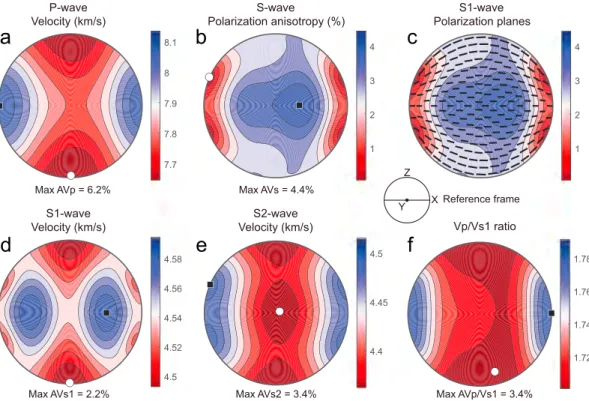
Seismic properties for all samples were calculated at 900 °C and 1.72 GPa, which correspond to the average equilibrium temperature of the FN peridotites and the pressure at which this value is attained in a 100‐Myr‐ old oceanic plate for the CHABLIS model (Doin & Fleitout, 1996). Seismic anisotropy patterns of the indivi-dual samples are similar as most samples show orthorhombic olivine CPO. However, seismic anisotropy intensities are variable due to changes in both the olivine content and intensity of olivine CPO among sam-ples (Figure 13). The maximum S wave polarization anisotropy varies between 4.1 and 9.6%, but most data cluster between 4 and 6% of anisotropy (Figure 13). The maximum propagation anisotropy for P waves ranges between 4.3 and 12.9% (median at 6.4%), whereas the maximum propagation anisotropy for fast (S1) and slow (S2) waves varies from 1.3 to 6.2% (median at 2.9%) and from 1.9 to 7.3% (median at 4.1%), respectively (Table 3).
Since seismic waves average elastic properties over large volumes, we averaged the elastic tensor constants of all samples (seismic properties for the individual samples are presented in Table S4 in the supporting infor-mation) using a common structural reference frame, with the assumption that most deformation in an ocea-nic domain takes place in the asthenosphere where olivine deforms by dislocation creep with dominant activation of the [100](010) systems (Tommasi, 1998; Tommasi et al., 2000). This hypothesis supposes, in absence of changes in the plate motion as it is the case for the equatorial Atlantic, a coherent deformation structure frozen in the entire lithospheric column (Tommasi, 1998). It results in an estimation of the max-imum seismic anisotropy in the oceanic lithosphere mantle of this area (Figure 14).
Pwave velocities range between 8.1 and 7.6 km/s. P waves propagate fastest in the direction of the lineation and slowest perpendicular to the foliation. The S wave polarization anisotropy is the lowest at ±20° from the lineation (apparent isotropy directions) in the xz plane and the highest (4.4%) in the foliation plane, but at high angle to the lineation. Low S wave polarization anisotropy (~1%) is detected for waves propagating par-allel to the lineation. The fast split S wave (S1) will be polarized parpar-allel to the lineation for any propagation
Figure 11. Average core and rim equilibrium temperatures calculated using the two‐pyroxene thermometer (TTA98; Taylor, 1998) and the Ca‐in‐opx thermometer (Brey & Kohler, 1990, revised by Nimis & Grutter, 2010). Equilibrium temperatures for the peridotites previously studied by Rivalenti et al. (2000) were recalculated using the same methods based on published mineral chemistry (recalled in Table S2 in the supporting information). Error bars represent the variation in mineral chemistry at the thin section scale. Gray lines link core‐rim pairs discussed in the main text. The black dashed line indicates equal predictions by the two thermometers, and the gray dashed lines define the ±70 °C variation.
direction. S1 waves velocities range between 4.6 and 4.5 km/s; they are fastest for propagation within the foliation plane at approximately 45° to the lineation and slowest for propagation perpendicular to the foliation. Propagation directions at low and high angle to the lineation sample on average low S1 velocities. The maximum anisotropy of Vs1 is 2.2%. S2 waves have the lowest velocity within the plane normal to the lineation (4.35 km/s) and the highest velocity at low angle to the lineation in the xz plane (4.5 km/s). The maximum anisotropy of Vs2 is 3.4%. The Vp/Vs1 ratio is the highest (1.8) when the waves propagate parallel to the lineation and the lowest (1.7) when they propagate normal to the folia-tion. The maximum anisotropy of the Vp/Vs1 ratio is 3.4%.
5. Discussion
5.1. Composition of the Deep Oceanic Lithosphere
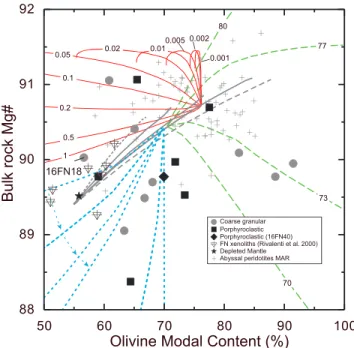
FN peridotites are significantly more fertile than Mid‐Atlantic Ridge abys-sal peridotites (Figure 9). The higher fertility may result from a lower degree of partial melting, consistently with the fact that the FN xenoliths sample asthenospheric material accreted to the lithospheric mantle by cooling far from the mid‐ocean ridge. By consequence, this material has seen less decompression and should not have been submitted to large degrees of partial melting. However, if this was the only process control-ling the composition of the lithospheric mantle, FN peridotites should have compositions ranging between those of the depleted mantle (black star) and the abyssal peridotites (gray crosses) along the trend defined by the partial melting models in Figure 15. However, very few of the FN xenoliths plot along this trend. Most samples plot below the partial melt-ing curves (Figure 15), indicatmelt-ing that they are enriched in Fe (low Mg#) and, in some cases, in olivine. These compositions may be produced by reactive melt percolation of low Mg# basaltic melts leading to dunitization (Bodinier & Godard, 2014; dashed green lines in Figure 15, where the numbers indicate the melt Mg#) or by melt‐rock interaction with or without pyroxene crystallization, but in which the melt composition continuously changes as the result of earlier reaction stages (Bodinier et al., 2008, dashed blue lines in Figure 15). A few FN xenoliths plot above the partial melting trend, indicating enrichment in pyroxenes; these compositions may be produced by refer-tilization reactions during reactive melt percolation (Bodinier & Godard, 2014; thin red lines in Figure 15, where the numbers indicate the mass ratio of crystallized minerals to infiltrated melt). Indeed, many lher-zolites (e.g., 16FN12, 16FN18, 16FN21) are characterized by clinopyroxene and a few (16FN18, 16FN21) by orthopyroxene enrichment relatively to the predictions of partial melting models (Figure 2b) and the
Figure 12. P‐T diagram comparing the equilibration conditions estimated for the Fernando de Noronha mantle peridotites to geotherms predicted for a 100‐Myr‐old oceanic plate using three theoretical cooling models. As no barometers are available for spinel peridotites equilibrium pressure ranges are presented as bars, based on the absence of plagioclase and of garnet in the studied peridotites, considering their Cr# (Table S1 in the supporting information) and the effect of Cr on the spinel‐garnet phase transition. Phase transitions after Klemme (2004) and O'Neill (1981). Dry and wet solidus with variable H2O contents after Ringwood (1975). The red star marks the P‐T condition (900 °C, 1.72 GPa) used for the seismic property calculations. White and gray circles indicate lithosphere‐asthenosphere boundary (LAB) depths predicted by seismic refraction (Mehouachi and Singh, 2018) and receiver function (Rychert et al., 2018) studies in the equatorial Atlantic.
Figure 13. Maximum S wave polarization anisotropy (%) of individual samples versus (a) olivine CPO strength (J index) and (b) olivine modal content (%).
Table 3
Calculated Seismic Properties at 900 °C and 1.72 GPa for Individual Samples and for the Average of All FN Peridotites
Sample Rock Type Microstructure/ Rex Fraction (%)
Seismic Properties (Velocity in km/s and Anisotropy in %)
AVp Vp Max
Vp
Min AVs AVs1
Vs1 Max Vs1 Min AVs2 Vs2 Max Vs2 Min AVp/ Vs1 Vp/ Vs1 Max Vp/ Vs1 Min AVp/ Vs2 Vp/ Vs2 Max Vp/ Vs2 Min 16FN01 Lz CG 5.7 8.2 7.7 5.1 3.6 4.6 4.5 4.5 4.6 4.4 6.6 1.8 1.7 4.8 1.8 1.7 16FN05 Du CG 10.3 8.5 7.6 8.1 2.9 4.7 4.5 7.3 4.6 4.3 10.0 1.8 1.7 5.1 1.9 1.8 16FN07 Hz CG 9.0 8.3 7.6 5.9 2.9 4.6 4.5 5.3 4.5 4.3 8.3 1.8 1.7 4.9 1.9 1.8 16FN16 Lz CG 8.4 8.2 7.6 6.0 3.4 4.6 4.5 4.7 4.5 4.3 6.8 1.8 1.7 5.3 1.8 1.7 16FN18 Lz CG 6.0 8.0 7.6 5.0 4.4 4.6 4.4 1.9 4.5 4.4 2.2 1.7 1.7 5.8 1.8 1.7 16FN29 Lz CG 6.5 8.2 7.6 5.5 2.2 4.6 4.5 4.1 4.5 4.3 5.3 1.8 1.7 4.4 1.8 1.7 16FN32 Lz CG 4.7 8.1 7.7 4.1 1.3 4.6 4.5 3.3 4.5 4.4 5.0 1.8 1.7 2.4 1.8 1.7 16FN35 Hz CG 12.1 8.5 7.5 8.4 4.7 4.7 4.5 7.3 4.6 4.2 12.1 1.8 1.6 7.1 1.9 1.8 FN50 Lz CG 4.5 8.0 7.7 5.0 4.2 4.6 4.4 3.2 4.5 4.4 4.4 1.8 1.7 4.9 1.8 1.7 16FN12 Lz Porph 14 4.3 8.0 7.7 4.6 3.6 4.6 4.5 2.1 4.5 4.4 4.6 1.8 1.7 3.8 1.8 1.7 16FN19 Lz Porph 26 5.7 8.1 7.6 4.6 2.0 4.6 4.5 3.2 4.5 4.4 4.8 1.8 1.7 3.2 1.8 1.7 16FN30 Lz Porph 18 6.4 8.2 7.7 4.5 2.5 4.6 4.5 3.7 4.5 4.4 6.4 1.8 1.7 3.7 1.8 1.8 16FN37 Lz Porph 12 8.8 8.2 7.6 6.0 2.9 4.6 4.5 4.8 4.5 4.3 7.8 1.8 1.7 4.6 1.8 1.7 FN6 Lz Porph 15 6.1 8.2 7.7 4.6 3.4 4.7 4.5 3.1 4.5 4.4 6.1 1.8 1.7 5.0 1.8 1.7 FN93–55 Hz Porph 14 12.9 8.4 7.4 9.6 6.2 4.7 4.4 6.4 4.5 4.3 9.7 1.8 1.7 8.8 1.9 1.7 16FN40 Lz Porph 46 7.5 8.2 7.6 5.9 1.7 4.6 4.5 4.8 4.5 4.3 6.4 1.8 1.7 3.6 1.8 1.8 Average ‐ ‐ 6.2 8.1 7.6 4.4 2.2 4.6 4.5 3.4 4.5 4.4 5.2 1.8 1.7 3.3 1.8 1.8
Note. AVp = maximum P wave propagation anisotropy; AVs = maximum S wave polarization anisotropy; AVs1 = maximum propagation anisotropy for the fast Swave; AVs2 = maximum propagation anisotropy for the slow S wave; AVp/Vs1 = maximum anisotropy of the Vp/Vs1 ratio; AVp/Vs2 = maximum anisotropy of the Vp/Vs2 ratio; Lz = lherzolite; CG = coarse‐granular; Du = dunite; Hz = harzburgite; Porph = porphyroclastic.
aSamples from Rivalenti et al. (2000).
Figure 14. Average seismic properties for the lithospheric mantle beneath Fernando de Noronha at 900 °C and 1.72 GPa (~50‐km depth; cf. Fig. 12). (a) P wave velocities (Vp; km/s). (b) S wave polarization anisotropy (AVs = 200 × (Vs1− Vs2)/(Vs1 + Vs2) in %). (c) Direction of fast S1 wave polarization planes. (d) S1 wave velocities (Vs1; km/s). (e) S2 wave velocities (Vs2; km/s). (f) Vp/Vs1 ratio. Lower hemisphere stereographic projections presenting the variation of the property as a function of the propagation direction relatively to the structural reference frame (flow direction (x) and normal to the flow plane (z), shown by the insert in the middle right of thefigure). Black squares indicate the highest values and white circles, the lowest ones.
two coarse granular harzburgites (16FN07 and 16FN35) and the dunite (16FN05) are characterized by olivine enrichment (Figures 2b and 15). Petrographic and other chemical evidence further imply variable melt‐ rock interaction leading to changes in modal and chemical compositions of FN peridotites. The petrographic evidence encompasses interpenetrat-ing olivine‐pyroxene grain boundaries, the cusp shapes of pyroxene grain boundaries when in contact with two olivine grains, and the interstitial shapes of small pyroxenes (Figures 4 and 5). These features are observed in both coarse‐granular and porphyroclastic peridotites, but they are best expressed in the porphyroclastic peridotites. Additional chemical evi-dence for reactive melt percolation in both coarse granular and porphyro-clastic peridotites includes Ti enrichment in spinel and clinopyroxene (Figures 9e and 9f) and Ca enrichment in some olivine cores and in all rims (Figure 9c). Enrichment in Ca and Fe and depletion in Ni in olivine in the center of thefine‐grained recrystallized domain and in the rims in lherzolite 16FN40 (Figure 10) imply increased reactive melt percolation in this domain. In addition, the lack of or the only partial correlation between olivine and pyroxene CPO (Figure 7), which also characterizes both microstructures, suggests that at least part of the pyroxenes may have crystallized after the deformation has ceased.
Why and when did these melt‐rock reactions occur? They may result from (1) continuous percolation of small fractions of melt from the astheno-sphere into the base of the oceanic plate as the latter cools and thickens with time (Process 1) and/or (2) localized percolation of larger volumes of melt associated with Cenozoic alkaline volcanism and related dikes leading to the formation of the volcanic islands (Process 2). Thefirst pro-cess corresponds to a protracted percolation history, which may produce limited refertilization of the base of the lithosphere in a continuous mode, as it cools and thickens with increasing aging and, hence, distance from the ridge (Figure 16). This process is, for instance, recorded by the pre-sence of lherzolites at the base of the mantle section in the Oman ophiolite (Godard et al., 2000). Yet infiltration and freezing of small melt volumes into the cooling lithospheric plate cannot explain the marked enrichment in Fe in olivine relative to partial melting models that characterize some FN peridotites (Figure 15). Such an enrichment may only be produced
Figure 15. Olivine modal content (%) versus bulk rock Mg# in Fernando de Noronha peridotites compared to evolutions predicted for partial melting and reactive melt percolation in the mantle. Gray lines represent the com-position evolution predicted by various partial melting models using a source composition with 55% of olivine and Mg# of 89.3 up to complete consumption of clinopyroxene (Bodinier & Godard, 2014). Colored lines represent different melt‐rock reactions after Bodinier & Godard (2014). Red solid lines correspond to precipitation of clinopyroxene and orthopyroxene at the expense of olivine and melt with different mass ratio of crystallized minerals versus infiltrated melt (numbers of the top of the curves). Green dashed lines show olivine‐forming reactions with melts with different Mg# (numbers of the top of the curves). Blue dotted lines represent multiple episodes of refertilization, starting with low Mg# melts (“primitive” melt Mg# = 74.5), in which the peridotites successively reacted with the evolved melt resulting from previous infiltration stage (Bodinier et al., 2008). Compositions of FN peridotites previously studied by Rivalenti et al. (2000), depleted mantle (DM), and abyssal peridotites from Mid‐Atlantic Ridge (MAR; Warren, 2016) are plotted for comparison.
Figure 16. Schematic diagram depicting the proposed evolution for the studied oceanic mantle section. The horizontal axis represents time (not to scale). Gray stars and rectangle represent predicted positions of the xenoliths at different times. The lithosphere‐asthenosphere boundary (LAB) evolution corresponds to the CHABLIS model prediction.
by high time‐integrated melt‐rock ratios and/or a continued reaction history, which are more likely achieved in the vicinity of melt channels or dikes (Bodinier et al., 2008). These rocks probably record the percolation of the melts associated with the formation of the FN island (Process 2). In such an environment, the associa-tion of pervasive and localized melt percolaassocia-tion may produce a wide range of composiassocia-tional signatures as it results in a large spatial variability of the melt‐rock ratios. Reactions characterized by very high time‐ integrated melt‐rock ratios may be produced in the walls of dikes feeding the surface volcanism. The most extreme compositional changes affect therefore small volumes of the mantle (<1 m away from the dike; Bodinier et al., 2008) at each diking episode, but repeated diking episodes may result in significant volumes of chemically modified lithospheric mantle beneath a large volcanic island, which may be sampled by late‐ stage island volcanism.
In summary, FN mantle xenoliths show compositions that point to variable modification of a rather fertile mantle by reactive melt percolation. There is clear chemical evidence for reactions involving high melt‐rock ratios and hence for changes directly associated with the Fernando de Noronha magmatism, independently on the origins of the latter (plume or a more diffuse mantle upwelling with focusing of the melt transport to the surface by lithospheric structures, such as fossil transforms). In addition, there is evidence pointing to “recent” melt‐rock interaction, which is also consistent with Process 2. This evidence includes the chemical disequilibrium recorded by many samples (core‐rim compositional gradients and compositional variations in both cores and rims for fast‐diffusing species such as Fe and Mg in pyroxenes and olivine or Ca in olivine at the thin section scale; Figure 9). Moreover, the clear spatial correlation between changes in olivine com-position and thefine‐grained domains in lherzolite 16FN40 (Figure 10) suggests that the development of fine‐grained domains with irregular, vein‐like shapes in the porphyroclastic peridotites is also related to “recent” melt percolation.
Is there also evidence for Process 1? Melt‐rock reactions in peridotites leading to either pyroxene crystalliza-tion at the expenses of olivine or vice versa result in interpenetrating olivine‐pyroxene grain boundaries. Pyroxene‐rich lherzolites (16FN18, 16FN21) from the coarse granular group have well equilibrated pyroxene grain shapes (Figures 2, 4a, 4b, 5a, and 5b), which indicate that long‐range solid‐state diffusion (millimeter scale) allowing for re‐equilibration of pyroxene grain shapes, followed refertilization. If melt‐rock reactions occurred shortly before the extraction, this would not have been possible. This suggests that the refertiliza-tion recorded by these samples results from an older melt percolarefertiliza-tion process, such as Process 1. It is note-worthy that orthopyroxene‐rich lherzolite 16FN18 has olivine and pyroxene compositions similar to primitive mantle ones (Table 2).
In conclusion, we propose that both processes (Figure 16) have occurred in the oceanic lithosphere beneath the Fernando de Noronha archipelago, but that only the localized melt percolation associated with the island formation (Process 2) produced significant Fe enrichment, dunitization, and marked grain refine-ment. These processes probably affect small volumes of the lithospheric mantle, being limited to domains underlying the oceanic islands.
5.2. Microstructural and CPO Evolution
Porphyroclastic peridotites preserve clear evidence for deformation by dislocation creep. Olivine has com-mon undulose extinction and subgrain boundaries (Figures 4 and 5). It displays strong to moderate ortho‐ rhombic CPO patterns with stronger concentrations of [100] and [010] relatively to [001], which imply dominant activation of the [100](010) slip system (Figures 7 and 8a). These features are characteristic of deformation at high‐temperature, low‐pressure, and low‐ to moderate‐stress conditions. The coarse grain sizes (Figure 3) also point to low‐stress conditions. Decrease in the strength of the olivine CPO is associated with the formation offine‐grained domains (Figure 8b), which, when they are well developed, such as in 16FN40, are characterized by change in olivine compositions. This suggests that the crystallization offine grains is associated with reactive melt percolation, which may result in recrystallization of the existing coarse minerals and in neo‐crystallization from the melt. Both processes produce dispersion of the olivine CPO. The preservation of chemical disequilibrium at the millimeter scale indicates that this process is recent, being probably related to the volcanism that formed the island; it should affect therefore limited volumes of the lithospheric mantle. It is noteworthy that comparison between the CPO of the recrystallized domains and of the bulk rock in strongly recrystallized peridotite 16FN40 highlights that the recrystallized domains have olivine CPO with a strongerfiber‐[010] tendency. This change in olivine CPO pattern is
consistent with previous observations on peridotites deformed in presence of melts both in nature and experiments (Higgie & Tommasi, 2012, 2014; Qi et al., 2018). Weakfiber‐[010] olivine CPO was also described in troctolites formed by reactive melt percolation in the shallow mantle beneath the Mid‐ Atlantic Ridge (Drouin et al., 2010).
Coarse granular peridotites have more re‐equilibrated grain shapes and weaker intracrystalline misorienta-tions than porphyroclastic ones. All coarse‐granular peridotites display clear olivine CPO, supporting defor-mation by dislocation creep with dominant activation of [100](010). However, olivine CPO intensities are on average lower than those of porphyroclastic peridotites and olivine CPO patterns are more variable, (Figure 8a). These observations imply variable degrees of annealing following the deformation. The two most annealed coarse‐granular lherzolites (16FN18 and 16FN21) show fiber‐[010] patterns, low J index, and rather high equilibrium temperatures. However, there is neither a systematic correlation of annealing degree with equilibrium temperature (Figure 11), nor with chemical composition.
Pyroxene CPOs in many peridotites from both groups are either only partially correlated or uncorrelated with the olivine CPO (Figure 7). Most uncorrelated pyroxene CPOs are very dispersed. Pyroxene crystalliza-tion under static condicrystalliza-tions should not result in CPO. By consequence, it should disperse the original, deformation‐related CPO of the primary pyroxenes. The poor correlation between pyroxenes and olivine CPO therefore indicates that refertilization occurred after last main deformation episode, that is, after the incorporation of the peridotites to the lithosphere. Olivine‐pyroxene grain boundaries are very sinuous in porphyroclastic peridotites, supporting a recent refertilization, probably associated with the volcanism form-ing the islands. Pyroxenes in coarse‐granular peridotites have more equilibrated grain shapes, suggesting that annealing succeeded refertilization.
Peridotites from Canary Islands in the central Atlantic (Vonlanthen et al., 2006) show, similarly to the FN peridotites, dominantly orthorhombic olivine CPO patterns with highly variable strength (Figure 8). In con-trast, mantle xenoliths from French Polynesia (Tommasi et al., 2004), which sample the Pacific oceanic litho-sphere, have two olivine CPO pattern groups, which only weakly overlap the Atlantic oceanic lithosphere data (Figure 8). Coarse porphyroclastic lherzolites and harzburgites have strong to moderate olivine CPO (J index between 4.5 and 6.5) with dominantlyfiber‐[100] patterns, whereas the dunites and wehrlites, which are characterized by annealed microstructures and strong Fe enrichment, have very weak orthorhom-bic tofiber‐[010] olivine CPO patterns (Figure 8). These observations further point to the role of reactive melt percolation, which in the French Polynesia resulted in dunitization under static conditions, on the disper-sion and change of symmetry of olivine CPO patterns (Tommasi et al., 2004).
To conclude, we argue that deformation of FN mantle xenoliths occurred essentially at the LAB due to dif-ferential motion between the plate and the convective mantle (Figure 16). This high‐temperature, low‐stress deformation was mainly accommodated by dislocation creep in olivine with dominant activation of [100] (010). The deformation ceased gradually as the plate cooled down and the LAB progressively deepened with time, leading to fossilization of the deformation microstructures and CPOs in the lithospheric mantle. Annealing occurred in a continuous way after deformation, recovering the deformation microstructures, but mostly preserving the CPO. Annealing rates decreased with cooling of the lithosphere. Refertilization or dunitization during reactive melt percolation related to the volcanism forming the islands (Process 2) pro-duced in contrast dispersion of the olivine CPO associated with the development of thefine‐grained domains in porphyroclastic peridotites. In addition, refertilization reactions resulted in inconsistency between olivine and pyroxene CPOs.
5.3. Comparison With Seismological Data From the Atlantic
Two recent seismic studies have investigated the lithosphere‐asthenosphere boundary (LAB) depth in the equatorial Atlantic northeast from the Fernando de Noronha Island. Based on refraction data, Mehouachi and Singh (2018) proposed a LAB at approximately 88 km for the 70‐Myr‐old oceanic plate north of the St. Paul fracture zone and at approximately 72 km for the 40‐Myr‐old oceanic plate south of it. Receiver func-tion data from the Passive Imaging of the Lithosphere‐Asthenosphere Boundary (PILAB) experiment deployed across the equatorial Atlantic ridge around the Romanche fracture zone suggest a LAB, which dee-pens from 30‐ to 80‐km depth beneath 0‐ to 40‐Myr‐old plate domains (Rychert et al., 2018). Surface wave data over the entire experiment area, which encompasses seafloor of 0–80 Myr old, produced a 1‐D